Aventura, FL
Demographics And Statistics
Living In Aventura, Florida Summary
Life in Aventura research summary. HomeSnacks has been using Saturday Night Science to research the quality of life in Aventura over the past nine years using Census, FBI, Zillow, and other primary data sources. Based on the most recently available data, we found the following about life in Aventura:
The population in Aventura is 39,372.
The median home value in Aventura is $433,486.
The median income in Aventura is $82,777.
The cost of living in Aventura is 131 which is 1.3x higher than the national average.
The median rent in Aventura is $2,423.
The unemployment rate in Aventura is 3.9%.
The poverty rate in Aventura is 11.6%.
The average high in Aventura is 83.0° and the average low is 69.9°.
Aventura SnackAbility
Overall SnackAbility
Aventura, FL Crime Report
Crime in Aventura summary. We use data from the FBI to determine the crime rates in Aventura. Key points include:
There were 1,630 total crimes in Aventura in the last reporting year.
The overall crime rate per 100,000 people in Aventura is 4,254.0 / 100k people.
The violent crime rate per 100,000 people in Aventura is 164.4 / 100k people.
The property crime rate per 100,000 people in Aventura is 4,089.6 / 100k people.
Overall, crime in Aventura is 100.73% above the national average.
Total Crimes
Above National Average
Crime In Aventura Comparison Table
| Statistic | Count Raw |
Aventura / 100k People |
Florida / 100k People |
National / 100k People |
|---|---|---|---|---|
| Total Crimes Per 100K | 1,630 | 4,254.0 | 1,687.5 | 2,119.2 |
| Violent Crime | 63 | 164.4 | 267.1 | 359.0 |
| Murder | 0 | 0.0 | 3.9 | 5.0 |
| Robbery | 25 | 65.2 | 38.2 | 61.0 |
| Aggravated Assault | 31 | 80.9 | 197.1 | 256.0 |
| Property Crime | 1,567 | 4,089.6 | 1,420.4 | 1,760.0 |
| Burglary | 56 | 146.1 | 152.5 | 229.0 |
| Larceny | 1,498 | 3,909.5 | 1,144.9 | 1,272.0 |
| Car Theft | 13 | 33.9 | 123.0 | 259.0 |
Aventura, FL Cost Of Living
Cost of living in Aventura summary. We use data on the cost of living to determine how expensive it is to live in Aventura. Real estate prices drive most of the variance in cost of living around Florida. Key points include:
The cost of living in Aventura is 131 with 100 being average.
The cost of living in Aventura is 1.3x higher than the national average.
The median home value in Aventura is $433,486.
The median income in Aventura is $82,777.
Aventura's Overall Cost Of Living
Higher Than The National Average
Cost Of Living In Aventura Comparison Table
| Living Expense | Aventura | Florida | National Average | |
|---|---|---|---|---|
| Overall | 131 | 97 | 100 | |
| Services | 106 | 96 | 100 | |
| Groceries | 102 | 99 | 100 | |
| Health | 94 | 98 | 100 | |
| Housing | 195 | 96 | 100 | |
| Transportation | 103 | 97 | 100 | |
| Utilities | 101 | 95 | 100 | |
Aventura, FL Weather
The average high in Aventura is 83.0° and the average low is 69.9°.
There are 75.6 days of precipitation each year.
Expect an average of 58.9 inches of precipitation each year with 0.0 inches of snow.
| Stat | Aventura |
|---|---|
| Average Annual High | 83.0 |
| Average Annual Low | 69.9 |
| Annual Precipitation Days | 75.6 |
| Average Annual Precipitation | 58.9 |
| Average Annual Snowfall | 0.0 |
Average High
Days of Rain
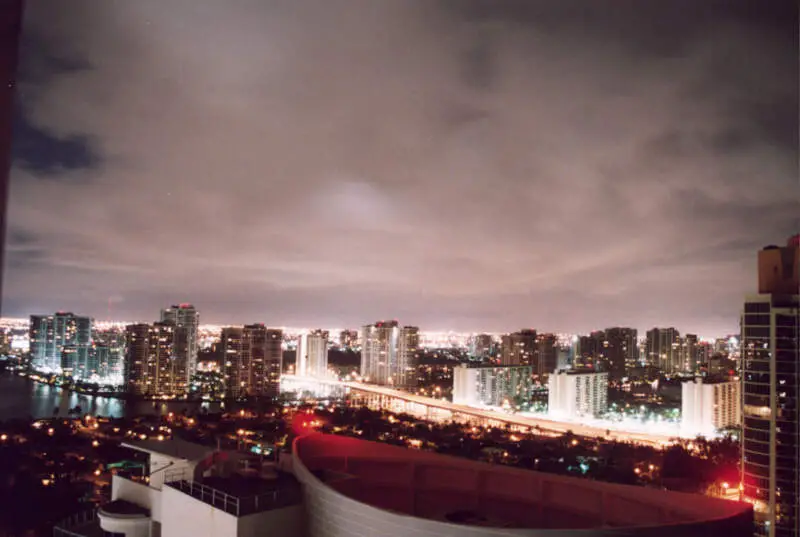
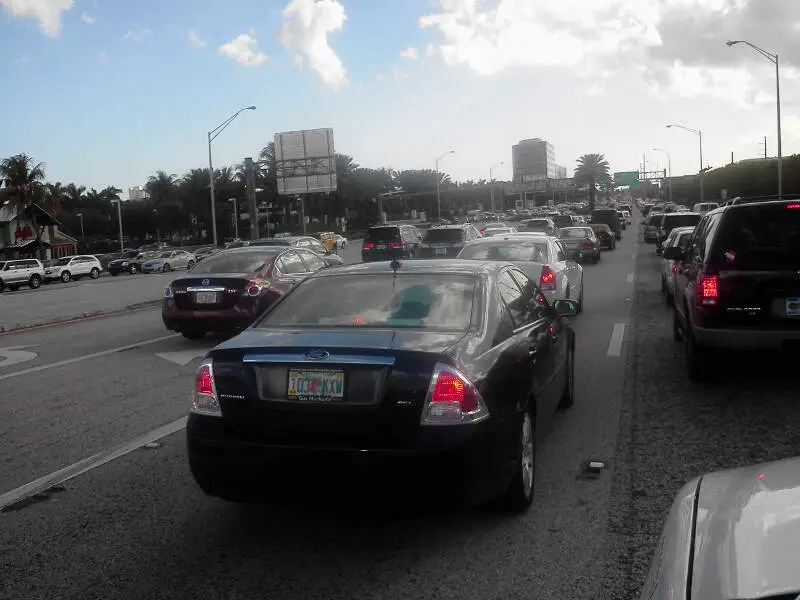
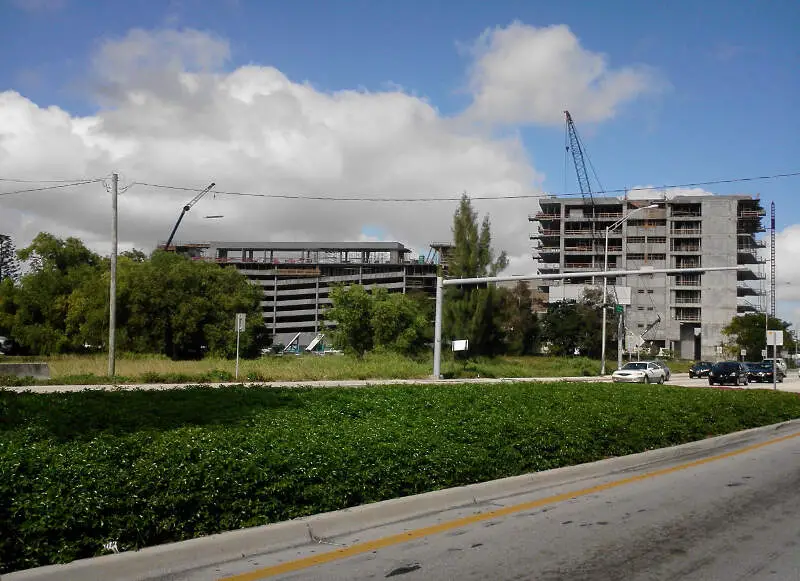
Aventura, FL Photos
Rankings for Aventura in Florida


Locations Around Aventura
Map Of Aventura, FL
Best Places Around Aventura
Weston, FL
Population 67,952
Coral Terrace, FL
Population 24,051
Pembroke Pines, FL
Population 170,557
Miami Lakes, FL
Population 30,731
Key Biscayne, FL
Population 14,560
Davie, FL
Population 106,412
Oakland Park, FL
Population 44,015
North Lauderdale, FL
Population 44,650
Hialeah Gardens, FL
Population 22,634
West Park, FL
Population 15,076
Aventura Demographics And Statistics
Population over time in Aventura
The current population in Aventura is 39,372. The population has increased 16.6% from 2010.
| Year | Population | % Change |
|---|---|---|
| 2023 | 39,372 | -0.6% |
| 2022 | 39,621 | -0.3% |
| 2021 | 39,734 | 7.0% |
| 2020 | 37,151 | -0.4% |
| 2019 | 37,303 | -1.3% |
| 2018 | 37,780 | -0.3% |
| 2017 | 37,875 | 1.0% |
| 2016 | 37,515 | 0.4% |
| 2015 | 37,357 | 1.0% |
| 2014 | 36,979 | 1.9% |
| 2013 | 36,307 | 1.9% |
| 2012 | 35,613 | 2.6% |
| 2011 | 34,726 | 2.8% |
| 2010 | 33,772 | - |
Race / Ethnicity in Aventura
Aventura is:
47.3% White with 18,623 White residents.
1.6% African American with 628 African American residents.
0.0% American Indian with 0 American Indian residents.
1.7% Asian with 670 Asian residents.
0.0% Hawaiian with 2 Hawaiian residents.
0.8% Other with 298 Other residents.
3.6% Two Or More with 1,425 Two Or More residents.
45.0% Hispanic with 17,726 Hispanic residents.
| Race | Aventura | FL | USA |
|---|---|---|---|
| White | 47.3% | 51.4% | 58.2% |
| African American | 1.6% | 14.8% | 12.0% |
| American Indian | 0.0% | 0.1% | 0.5% |
| Asian | 1.7% | 2.8% | 5.7% |
| Hawaiian | 0.0% | 0.1% | 0.2% |
| Other | 0.8% | 0.6% | 0.5% |
| Two Or More | 3.6% | 3.5% | 3.9% |
| Hispanic | 45.0% | 26.7% | 19.0% |
Gender in Aventura
Aventura is 55.5% female with 21,865 female residents.
Aventura is 44.5% male with 17,507 male residents.
| Gender | Aventura | FL | USA |
|---|---|---|---|
| Female | 55.5% | 50.9% | 50.5% |
| Male | 44.5% | 49.1% | 49.5% |
Highest level of educational attainment in Aventura for adults over 25
2.0% of adults in Aventura completed < 9th grade.
2.0% of adults in Aventura completed 9-12th grade.
15.0% of adults in Aventura completed high school / ged.
17.0% of adults in Aventura completed some college.
8.0% of adults in Aventura completed associate's degree.
32.0% of adults in Aventura completed bachelor's degree.
16.0% of adults in Aventura completed master's degree.
6.0% of adults in Aventura completed professional degree.
2.0% of adults in Aventura completed doctorate degree.
| Education | Aventura | FL | USA |
|---|---|---|---|
| < 9th Grade | 2.0% | 5.0% | 5.0% |
| 9-12th Grade | 2.0% | 6.0% | 6.0% |
| High School / GED | 15.0% | 27.0% | 26.0% |
| Some College | 17.0% | 19.0% | 19.0% |
| Associate's Degree | 8.0% | 10.0% | 9.0% |
| Bachelor's Degree | 32.0% | 21.0% | 21.0% |
| Master's Degree | 16.0% | 9.0% | 10.0% |
| Professional Degree | 6.0% | 2.0% | 2.0% |
| Doctorate Degree | 2.0% | 1.0% | 2.0% |
Household Income For Aventura, Florida
6.6% of households in Aventura earn Less than $10,000.
3.0% of households in Aventura earn $10,000 to $14,999.
7.9% of households in Aventura earn $15,000 to $24,999.
6.2% of households in Aventura earn $25,000 to $34,999.
9.5% of households in Aventura earn $35,000 to $49,999.
14.2% of households in Aventura earn $50,000 to $74,999.
12.5% of households in Aventura earn $75,000 to $99,999.
13.3% of households in Aventura earn $100,000 to $149,999.
10.7% of households in Aventura earn $150,000 to $199,999.
16.1% of households in Aventura earn $200,000 or more.
| Income | Aventura | FL | USA |
|---|---|---|---|
| Less than $10,000 | 6.6% | 5.1% | 4.9% |
| $10,000 to $14,999 | 3.0% | 3.4% | 3.6% |
| $15,000 to $24,999 | 7.9% | 7.0% | 6.6% |
| $25,000 to $34,999 | 6.2% | 7.7% | 6.8% |
| $35,000 to $49,999 | 9.5% | 11.6% | 10.4% |
| $50,000 to $74,999 | 14.2% | 17.3% | 15.7% |
| $75,000 to $99,999 | 12.5% | 13.1% | 12.7% |
| $100,000 to $149,999 | 13.3% | 16.8% | 17.4% |
| $150,000 to $199,999 | 10.7% | 8.0% | 9.3% |
| $200,000 or more | 16.1% | 10.1% | 12.6% |


