Delray Beach SnackAbility
Overall SnackAbility
Crime in Delray Beach summary. We use data from the FBI to determine the crime rates in Delray Beach. Key points include:
There were 2,069 total crimes in Delray Beach in the last reporting year.
The overall crime rate per 100,000 people in Delray Beach is 3,052.5 / 100k people.
The violent crime rate per 100,000 people in Delray Beach is 422.0 / 100k people.
The property crime rate per 100,000 people in Delray Beach is 2,630.6 / 100k people.
Overall, crime in Delray Beach is 44.04% above the national average.
Total Crimes
Above National Average
Crime In Delray Beach Comparison Table
| Statistic | Count Raw |
Delray Beach / 100k People |
Florida / 100k People |
National / 100k People |
|---|---|---|---|---|
| Total Crimes Per 100K | 2,069 | 3,052.5 | 1,687.5 | 2,119.2 |
| Violent Crime | 286 | 422.0 | 267.1 | 359.0 |
| Murder | 2 | 3.0 | 3.9 | 5.0 |
| Robbery | 37 | 54.6 | 38.2 | 61.0 |
| Aggravated Assault | 220 | 324.6 | 197.1 | 256.0 |
| Property Crime | 1,783 | 2,630.6 | 1,420.4 | 1,760.0 |
| Burglary | 117 | 172.6 | 152.5 | 229.0 |
| Larceny | 1,541 | 2,273.5 | 1,144.9 | 1,272.0 |
| Car Theft | 125 | 184.4 | 123.0 | 259.0 |
Source: FBI Uniform Crime Reporting (2024)
Cost of living in Delray Beach summary. We use data on the cost of living to determine how expensive it is to live in Delray Beach. Real estate prices drive most of the variance in cost of living around Florida. Key points include:
The cost of living in Delray Beach is 120 with 100 being average.
The cost of living in Delray Beach is 1.2x higher than the national average.
The median home value in Delray Beach is $340,487.
The median income in Delray Beach is $82,041.
Delray Beach's Overall Cost Of Living
Higher Than The National Average
Cost Of Living In Delray Beach Comparison Table
| Living Expense | Delray Beach | Florida | National Average |
|---|---|---|---|
| Overall | 120 | 104 | 100 |
| Services | 102 | 101 | 100 |
| Groceries | 104 | 105 | 100 |
| Health | 164 | 99 | 100 |
| Housing | 104 | 104 | 100 |
| Transportation | 113 | 109 | 100 |
| Utilities | 101 | 105 | 100 |
Source: Cost of living index, normalized to US average = 100
Delray Beach, FL Weather
The average high in Delray Beach is 82.7° and the average low is 68.2°.
There are 85.3 days of precipitation each year.
Expect an average of 55.6 inches of precipitation each year with 0.0 inches of snow.
| Stat | Delray Beach |
|---|---|
| Average Annual High | 82.7 |
| Average Annual Low | 68.2 |
| Annual Precipitation Days | 85.3 |
| Average Annual Precipitation | 55.6 |
| Average Annual Snowfall | 0.0 |
Average High
Days of Rain
Source: NOAA climate normals (30-year)
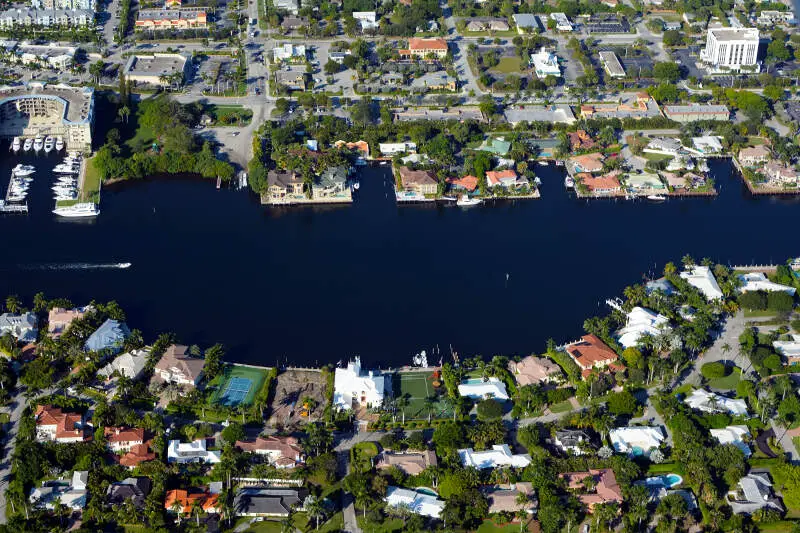
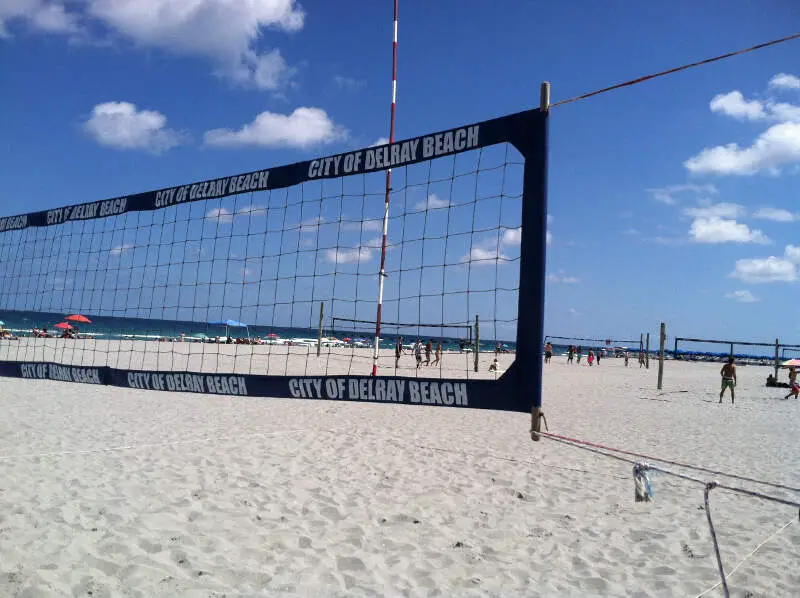
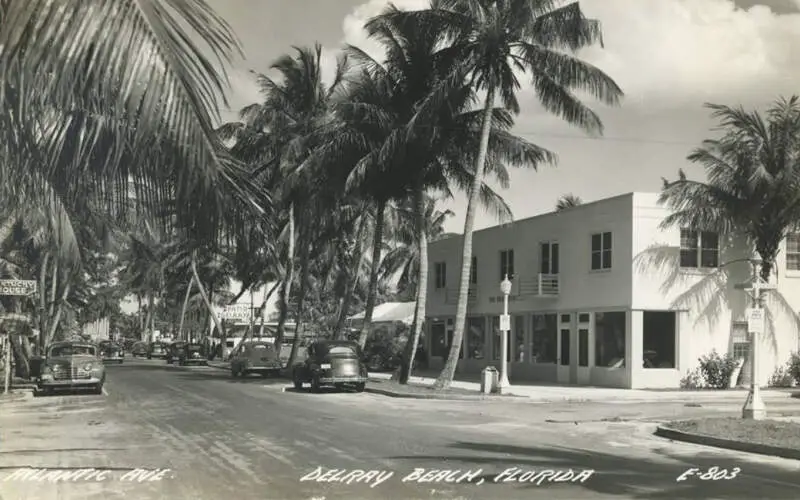
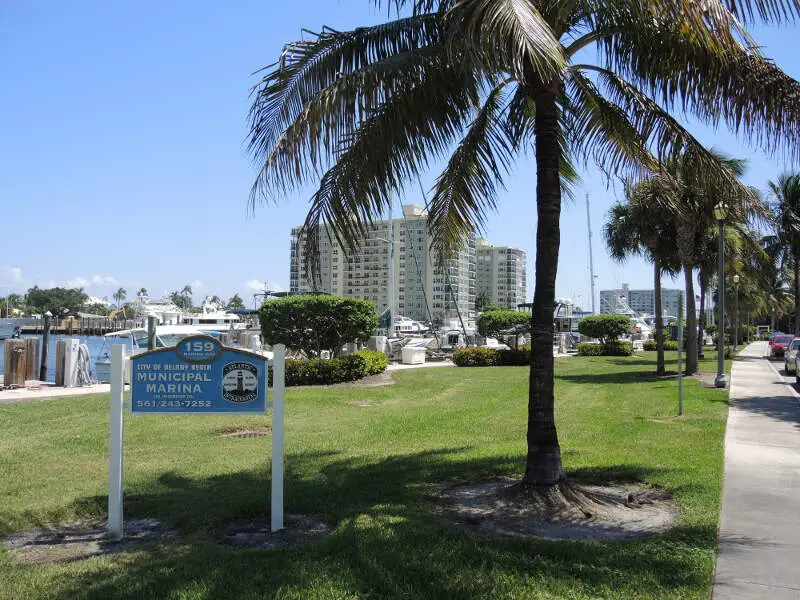
Delray Beach, FL Photos


Rankings & Articles For Delray Beach


Locations Around Delray Beach
Map Of Delray Beach, FL
Best Places Around Delray Beach
Coral Springs, FL
Population 136,103
Coconut Creek, FL
Population 58,330
Boca Raton, FL
Population 100,234
Parkland, FL
Population 37,178
Royal Palm Beach, FL
Population 40,344
Lighthouse Point, FL
Population 10,600
Oakland Park, FL
Population 44,682
North Lauderdale, FL
Population 45,234
Margate, FL
Population 59,198
Greenacres, FL
Population 44,373
Delray Beach Demographics And Statistics
Population over time in Delray Beach
The current population in Delray Beach is 67,979. The population has increased 11.3% from 2010.
| Year | Population | % Change |
|---|---|---|
| 2024 | 67,979 | 1.6% |
| 2023 | 66,940 | 0.4% |
| 2022 | 66,646 | 0.3% |
| 2021 | 66,434 | -3.6% |
| 2020 | 68,916 | 1.0% |
| 2019 | 68,217 | 1.3% |
| 2018 | 67,353 | 1.4% |
| 2017 | 66,453 | 2.2% |
| 2016 | 65,044 | 1.7% |
| 2015 | 63,939 | 1.8% |
| 2014 | 62,828 | 1.5% |
| 2013 | 61,875 | 1.1% |
| 2012 | 61,231 | 0.5% |
| 2011 | 60,912 | -0.3% |
| 2010 | 61,088 | - |
Race / Ethnicity in Delray Beach
See the full breakdown
Delray Beach is:
52.4% White with 35,646 White residents.
29.0% African American with 19,704 African American residents.
0.0% American Indian with 6 American Indian residents.
2.6% Asian with 1,746 Asian residents.
0.0% Hawaiian with 0 Hawaiian residents.
0.5% Other with 342 Other residents.
4.3% Two Or More with 2,951 Two Or More residents.
11.2% Hispanic with 7,584 Hispanic residents.
| Race | Delray Beach | FL | USA |
|---|---|---|---|
| White | 52.4% | 50.4% | 57.4% |
| African American | 29.0% | 14.6% | 11.9% |
| American Indian | 0.0% | 0.1% | 0.5% |
| Asian | 2.6% | 2.9% | 5.9% |
| Hawaiian | 0.0% | 0.1% | 0.2% |
| Other | 0.5% | 0.7% | 0.6% |
| Two Or More | 4.3% | 3.8% | 4.3% |
| Hispanic | 11.2% | 27.4% | 19.3% |
Gender in Delray Beach
See the full breakdown
Delray Beach is 52.7% female with 35,800 female residents.
Delray Beach is 47.3% male with 32,179 male residents.
| Gender | Delray Beach | FL | USA |
|---|---|---|---|
| Female | 52.7% | 50.9% | 50.5% |
| Male | 47.3% | 49.1% | 49.5% |
Highest level of educational attainment in Delray Beach for adults over 25
See the full breakdown
5.0% of adults in Delray Beach completed < 9th grade.
6.0% of adults in Delray Beach completed 9-12th grade.
20.0% of adults in Delray Beach completed high school / ged.
17.0% of adults in Delray Beach completed some college.
8.0% of adults in Delray Beach completed associate's degree.
28.0% of adults in Delray Beach completed bachelor's degree.
10.0% of adults in Delray Beach completed master's degree.
4.0% of adults in Delray Beach completed professional degree.
2.0% of adults in Delray Beach completed doctorate degree.
| Education | Delray Beach | FL | USA |
|---|---|---|---|
| < 9th Grade | 5.0% | 5.0% | 4.0% |
| 9-12th Grade | 6.0% | 6.0% | 6.0% |
| High School / GED | 20.0% | 27.0% | 26.0% |
| Some College | 17.0% | 19.0% | 19.0% |
| Associate's Degree | 8.0% | 10.0% | 9.0% |
| Bachelor's Degree | 28.0% | 21.0% | 22.0% |
| Master's Degree | 10.0% | 9.0% | 10.0% |
| Professional Degree | 4.0% | 2.0% | 2.0% |
| Doctorate Degree | 2.0% | 1.0% | 2.0% |
Household Income For Delray Beach, Florida
See the full breakdown
5.9% of households in Delray Beach earn Less than $10,000.
2.7% of households in Delray Beach earn $10,000 to $14,999.
6.6% of households in Delray Beach earn $15,000 to $24,999.
8.4% of households in Delray Beach earn $25,000 to $34,999.
10.5% of households in Delray Beach earn $35,000 to $49,999.
12.2% of households in Delray Beach earn $50,000 to $74,999.
12.0% of households in Delray Beach earn $75,000 to $99,999.
17.9% of households in Delray Beach earn $100,000 to $149,999.
8.3% of households in Delray Beach earn $150,000 to $199,999.
15.5% of households in Delray Beach earn $200,000 or more.
| Income | Delray Beach | FL | USA |
|---|---|---|---|
| Less than $10,000 | 5.9% | 5.1% | 5.0% |
| $10,000 to $14,999 | 2.7% | 3.3% | 3.4% |
| $15,000 to $24,999 | 6.6% | 6.6% | 6.3% |
| $25,000 to $34,999 | 8.4% | 7.3% | 6.6% |
| $35,000 to $49,999 | 10.5% | 11.1% | 10.1% |
| $50,000 to $74,999 | 12.2% | 16.8% | 15.5% |
| $75,000 to $99,999 | 12.0% | 13.1% | 12.6% |
| $100,000 to $149,999 | 17.9% | 17.2% | 17.5% |
| $150,000 to $199,999 | 8.3% | 8.4% | 9.6% |
| $200,000 or more | 15.5% | 11.0% | 13.4% |
Source: U.S. Census ACS 5-year estimates (2024)


