Compare Atlanta to…
Atlanta SnackAbility
Overall SnackAbility
Crime in Atlanta summary. We use data from the FBI to determine the crime rates in Atlanta. Key points include:
There were 23,009 total crimes in Atlanta in the last reporting year.
The overall crime rate per 100,000 people in Atlanta is 4,599.8 / 100k people.
The violent crime rate per 100,000 people in Atlanta is 707.3 / 100k people.
The property crime rate per 100,000 people in Atlanta is 3,892.5 / 100k people.
Overall, crime in Atlanta is 117.05% above the national average.
Total Crimes
Above National Average
Crime In Atlanta Comparison Table
| Statistic | Count Raw |
Atlanta / 100k People |
Georgia / 100k People |
National / 100k People |
|---|---|---|---|---|
| Total Crimes Per 100K | 23,009 | 4,599.8 | 2,000.6 | 2,119.2 |
| Violent Crime | 3,538 | 707.3 | 325.7 | 359.0 |
| Murder | 132 | 26.4 | 6.9 | 5.0 |
| Robbery | 602 | 120.3 | 40.8 | 61.0 |
| Aggravated Assault | 2,688 | 537.4 | 245.9 | 256.0 |
| Property Crime | 19,471 | 3,892.5 | 1,674.9 | 1,760.0 |
| Burglary | 1,735 | 346.9 | 202.8 | 229.0 |
| Larceny | 12,506 | 2,500.1 | 1,247.3 | 1,272.0 |
| Car Theft | 5,230 | 1,045.6 | 224.7 | 259.0 |
Source: FBI Uniform Crime Reporting (2024)
Cost of living in Atlanta summary. We use data on the cost of living to determine how expensive it is to live in Atlanta. Real estate prices drive most of the variance in cost of living around Georgia. Key points include:
The cost of living in Atlanta is 119 with 100 being average.
The cost of living in Atlanta is 1.2x higher than the national average.
The median home value in Atlanta is $385,599.
The median income in Atlanta is $85,652.
Atlanta's Overall Cost Of Living
Higher Than The National Average
Cost Of Living In Atlanta Comparison Table
| Living Expense | Atlanta | Georgia | National Average |
|---|---|---|---|
| Overall | 119 | 95 | 100 |
| Services | 99 | 97 | 100 |
| Groceries | 102 | 99 | 100 |
| Health | 163 | 88 | 100 |
| Housing | 100 | 101 | 100 |
| Transportation | 106 | 104 | 100 |
| Utilities | 104 | 101 | 100 |
Source: Cost of living index, normalized to US average = 100
Atlanta, GA Weather
The average high in Atlanta is 71.6° and the average low is 50.8°.
There are 78.2 days of precipitation each year.
Expect an average of 51.4 inches of precipitation each year with 1.4 inches of snow.
| Stat | Atlanta |
|---|---|
| Average Annual High | 71.6 |
| Average Annual Low | 50.8 |
| Annual Precipitation Days | 78.2 |
| Average Annual Precipitation | 51.4 |
| Average Annual Snowfall | 1.4 |
Average High
Days of Rain
Source: NOAA climate normals (30-year)
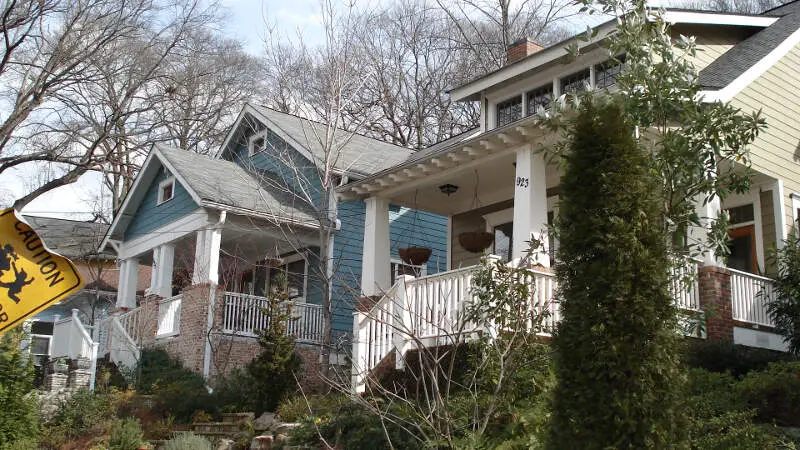
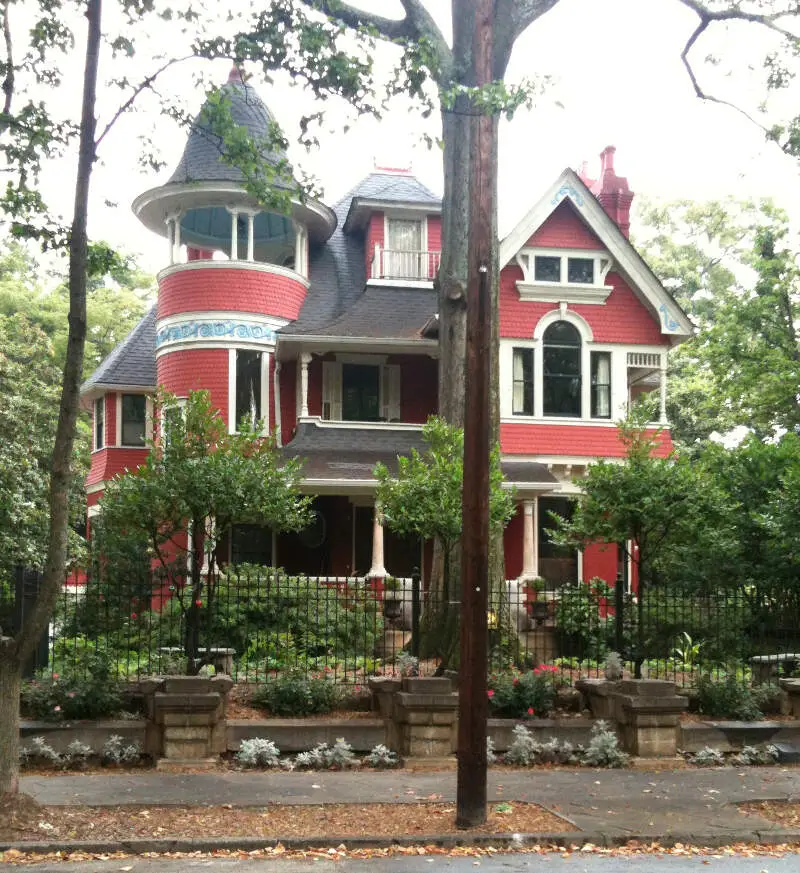
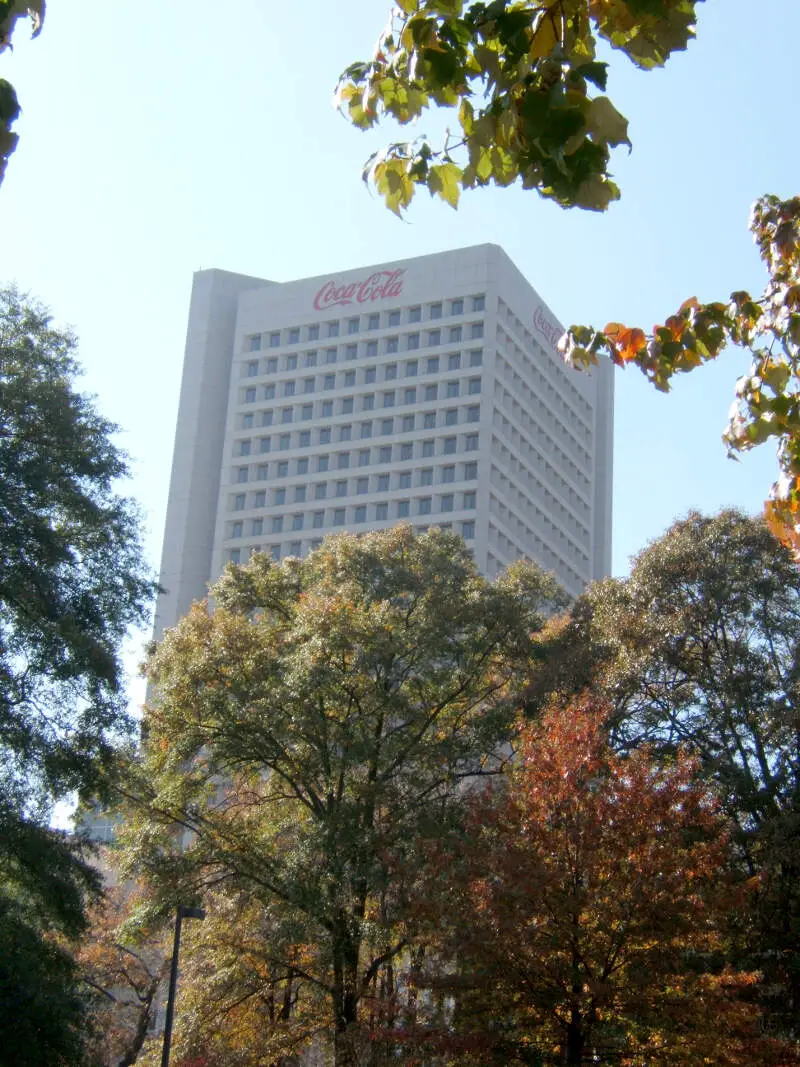
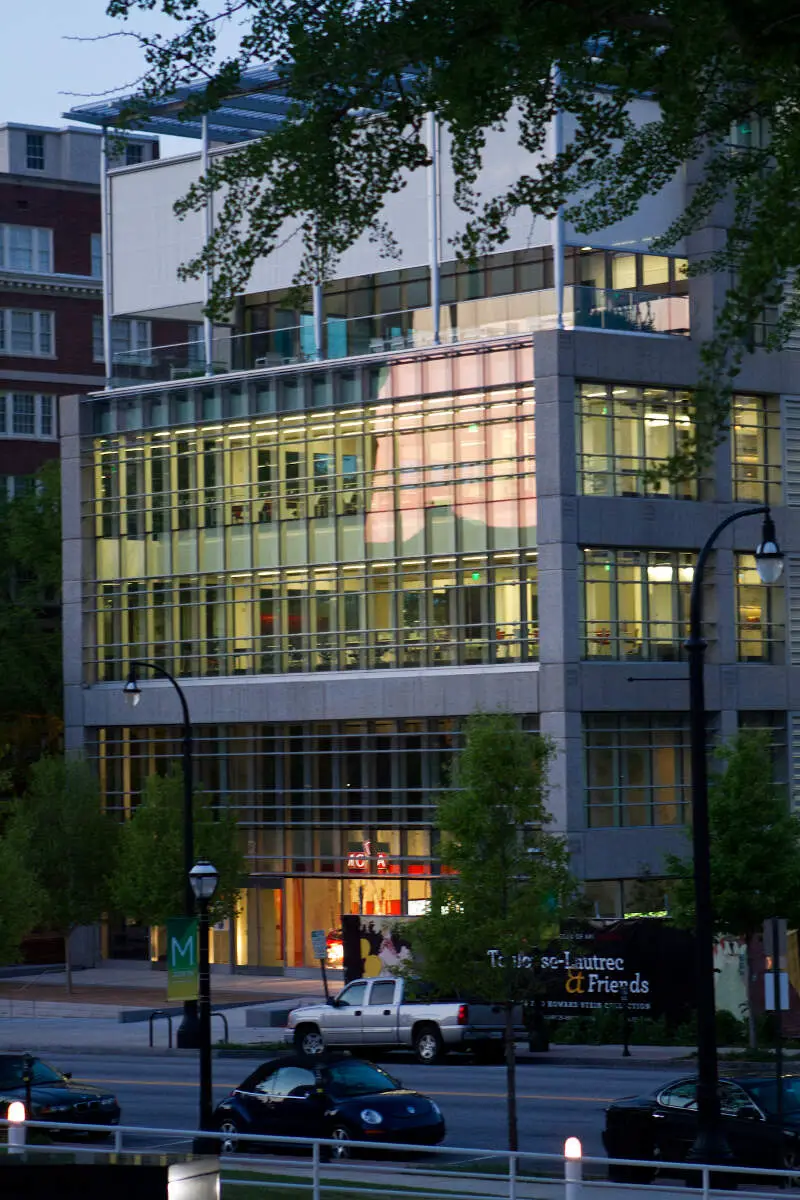
Atlanta, GA Photos


13 Reviews & Comments About Atlanta

Lol funny Atlanta is one of the best cities for women that's a joke, I lived in Paulding County a suburb county of Metro Atlanta and the people there rather play games like which guy has the most tats, how strong he is, what kind of car he's got, and how much money he has
So yeah the single part is right for a reason but some of the men are the same way about how a woman looks-
I'm from Atlanta all 34 years of my life and I've notice the dating scene has changed for the worst.
Lots to do, Crime can be high but there are good and bad parts.
Favorite places was the world of coke and the braves stadium. As well as the Varsity restaurant is a classic.
I try to not think about the crime level too much, although Georgia has had its share! Going to schools here were some of my most memorable moments! Between the best environments, wonderful friends and motivating teachers school is awesome!
The best thing that stands out about Georgia is the always growing to fit the needs of the people! Even though old buildings are being torn down, new and exciting buildings are coming up!
I love the Atlanta Botanical Gardens. They are awesome. I always find new flowers and interesting facts. The place is beautiful and a must see. They even have a spot for your children to play and rest.
The observatory is wonderful. Please go in and look around. You will love the flowers.
I love Atlanta. Crime is at a moderate amount. Quality of schools are dependent on the area you are in within the city. There are many things to do and many small stores/shops. There is a diverse range of people. The scenery is nice. There are alot of tourist and fun attractions inside and outside of the city.
A few of my favorite places are: Lenox Mall, Piedmont/Chastain Park, World of Coca Cola, Six Flags over Georgia, White Waters, the hookah lounges, and Edgewood bars.
I HATE the traffic and the overcrowded population in the city.
It's always dirty. Everytime I go to this airport I end up getting sick afterward.
The employees are rude and not helpful. Everytime I ask for help it seems that everyone is in a bad mood.
I like how big Atlanta Georgia is and how lively and nice this place is.
I like the roads and how busy and nice this place is.
Sometimes I have to go to Atlanta for business. Every time I go, I see way to much crime and feel very uncomfortable in many areas of the city. I don't feel like it is a safe place to raise a family.
There are some good things about Atlanta such as the museums and restaurants. The part that stands out the most is the crime. I would not raise my family in Atlanta.
I hate Atlanta. To start with the airport. It is so crowded, no good places to eat if you are stuck there, has no architectural charm. Invariably you arrive late as everything there is always backed up and then you have to change planes and take that stupid tram which is very time consuming. The only saving grace is that the connecting flight is frequently delayed.
I think besides the horrible airport the traffic is also quite crowded and the people drive like maniacs.
Atlanta is a great town. You will never run out of things to do no matter how many times you visit and if you live here, there is always something going on from festivals to awesome sporting events to farmers' markets to shows. It is a mix of the good and bad and you have to be careful but it will be worth it if you just follow some simple personal safety and have a safe form of transportation.
Atlanta has more to do than you could ever do in a lifetime. There are events all the time from annual events like DragonCon and the Peachtree Road Race to sporting events such as the Falcons, Braves or the new Atlanta United. If you get tired of that, there are tons of museums and parks.
Atlanta does have some dangerous areas and there is a significant amount of crime so one has to be careful and mind your wallet and if you are considering using the Marta train system as a tourist, you may want to consider a safer form of travel such as car or Uber.
Crime in downtown is really bad. Do not go there at night alone or at all really
traffic is terrible all across the city
I feel like there is always something to do in Atlanta. You have several attractions- like Six Flags, Stone Mountain, World of Coca Cola. and so much more. It is also several eating places as well.
The traffic was crazy busy, the buildings downtime was nice.
Rankings & Articles For Atlanta


Locations Around Atlanta
Map Of Atlanta, GA
Best Places Around Atlanta
Roswell, GA
Population 92,621
Mountain Park, GA
Population 12,850
Sandy Springs, GA
Population 107,087
Decatur, GA
Population 24,518
Druid Hills, GA
Population 8,169
Dunwoody, GA
Population 51,758
North Decatur, GA
Population 18,442
Smyrna, GA
Population 56,633
Atlanta Demographics And Statistics
Population over time in Atlanta
The current population in Atlanta is 505,268. The population has increased 22.2% from 2010.
| Year | Population | % Change |
|---|---|---|
| 2024 | 505,268 | 1.2% |
| 2023 | 499,287 | 0.9% |
| 2022 | 494,838 | 0.5% |
| 2021 | 492,204 | -1.1% |
| 2020 | 497,642 | 1.8% |
| 2019 | 488,800 | 1.9% |
| 2018 | 479,655 | 3.1% |
| 2017 | 465,230 | 1.9% |
| 2016 | 456,378 | 1.7% |
| 2015 | 448,901 | 1.9% |
| 2014 | 440,641 | 1.9% |
| 2013 | 432,589 | 1.6% |
| 2012 | 425,931 | 1.6% |
| 2011 | 419,250 | 1.4% |
| 2010 | 413,462 | - |
Race / Ethnicity in Atlanta
See the full breakdown
Atlanta is:
38.1% White with 192,259 White residents.
45.4% African American with 229,631 African American residents.
0.1% American Indian with 654 American Indian residents.
5.2% Asian with 26,370 Asian residents.
0.0% Hawaiian with 146 Hawaiian residents.
0.5% Other with 2,584 Other residents.
4.4% Two Or More with 22,029 Two Or More residents.
6.3% Hispanic with 31,595 Hispanic residents.
| Race | Atlanta | GA | USA |
|---|---|---|---|
| White | 38.1% | 49.1% | 57.4% |
| African American | 45.4% | 30.7% | 11.9% |
| American Indian | 0.1% | 0.1% | 0.5% |
| Asian | 5.2% | 4.5% | 5.9% |
| Hawaiian | 0.0% | 0.1% | 0.2% |
| Other | 0.5% | 0.6% | 0.6% |
| Two Or More | 4.4% | 3.9% | 4.3% |
| Hispanic | 6.3% | 11.0% | 19.3% |
Gender in Atlanta
See the full breakdown
Atlanta is 51.0% female with 257,710 female residents.
Atlanta is 49.0% male with 247,558 male residents.
| Gender | Atlanta | GA | USA |
|---|---|---|---|
| Female | 51.0% | 51.2% | 50.5% |
| Male | 49.0% | 48.8% | 49.5% |
Highest level of educational attainment in Atlanta for adults over 25
See the full breakdown
2.0% of adults in Atlanta completed < 9th grade.
4.0% of adults in Atlanta completed 9-12th grade.
16.0% of adults in Atlanta completed high school / ged.
14.0% of adults in Atlanta completed some college.
5.0% of adults in Atlanta completed associate's degree.
33.0% of adults in Atlanta completed bachelor's degree.
17.0% of adults in Atlanta completed master's degree.
6.0% of adults in Atlanta completed professional degree.
3.0% of adults in Atlanta completed doctorate degree.
| Education | Atlanta | GA | USA |
|---|---|---|---|
| < 9th Grade | 2.0% | 4.0% | 4.0% |
| 9-12th Grade | 4.0% | 7.0% | 6.0% |
| High School / GED | 16.0% | 27.0% | 26.0% |
| Some College | 14.0% | 19.0% | 19.0% |
| Associate's Degree | 5.0% | 8.0% | 9.0% |
| Bachelor's Degree | 33.0% | 21.0% | 22.0% |
| Master's Degree | 17.0% | 10.0% | 10.0% |
| Professional Degree | 6.0% | 2.0% | 2.0% |
| Doctorate Degree | 3.0% | 2.0% | 2.0% |
Household Income For Atlanta, Georgia
See the full breakdown
7.7% of households in Atlanta earn Less than $10,000.
5.1% of households in Atlanta earn $10,000 to $14,999.
6.3% of households in Atlanta earn $15,000 to $24,999.
5.5% of households in Atlanta earn $25,000 to $34,999.
8.0% of households in Atlanta earn $35,000 to $49,999.
12.5% of households in Atlanta earn $50,000 to $74,999.
11.4% of households in Atlanta earn $75,000 to $99,999.
15.5% of households in Atlanta earn $100,000 to $149,999.
8.8% of households in Atlanta earn $150,000 to $199,999.
19.1% of households in Atlanta earn $200,000 or more.
| Income | Atlanta | GA | USA |
|---|---|---|---|
| Less than $10,000 | 7.7% | 5.4% | 5.0% |
| $10,000 to $14,999 | 5.1% | 3.4% | 3.4% |
| $15,000 to $24,999 | 6.3% | 6.6% | 6.3% |
| $25,000 to $34,999 | 5.5% | 6.8% | 6.6% |
| $35,000 to $49,999 | 8.0% | 10.7% | 10.1% |
| $50,000 to $74,999 | 12.5% | 15.9% | 15.5% |
| $75,000 to $99,999 | 11.4% | 13.0% | 12.6% |
| $100,000 to $149,999 | 15.5% | 17.3% | 17.5% |
| $150,000 to $199,999 | 8.8% | 9.2% | 9.6% |
| $200,000 or more | 19.1% | 11.9% | 13.4% |
Source: U.S. Census ACS 5-year estimates (2024)


