Bloomington SnackAbility
Overall SnackAbility
Crime in Bloomington summary. We use data from the FBI to determine the crime rates in Bloomington. Key points include:
There were 1,050 total crimes in Bloomington in the last reporting year.
The overall crime rate per 100,000 people in Bloomington is 1,360.7 / 100k people.
The violent crime rate per 100,000 people in Bloomington is 308.4 / 100k people.
The property crime rate per 100,000 people in Bloomington is 1,052.3 / 100k people.
Overall, crime in Bloomington is -35.79% below the national average.
Total Crimes
Below National Average
Crime In Bloomington Comparison Table
| Statistic | Count Raw |
Bloomington / 100k People |
Illinois / 100k People |
National / 100k People |
|---|---|---|---|---|
| Total Crimes Per 100K | 1,050 | 1,360.7 | 2,004.4 | 2,119.2 |
| Violent Crime | 238 | 308.4 | 289.2 | 359.0 |
| Murder | 4 | 5.2 | 5.8 | 5.0 |
| Robbery | 19 | 24.6 | 90.2 | 61.0 |
| Aggravated Assault | 152 | 197.0 | 146.3 | 256.0 |
| Property Crime | 812 | 1,052.3 | 1,715.2 | 1,760.0 |
| Burglary | 139 | 180.1 | 290.5 | 229.0 |
| Larceny | 611 | 791.8 | 1,134.4 | 1,272.0 |
| Car Theft | 62 | 80.3 | 290.4 | 259.0 |
Source: FBI Uniform Crime Reporting (2024)
Cost of living in Bloomington summary. We use data on the cost of living to determine how expensive it is to live in Bloomington. Real estate prices drive most of the variance in cost of living around Illinois. Key points include:
The cost of living in Bloomington is 95 with 100 being average.
The cost of living in Bloomington is 0.9x lower than the national average.
The median home value in Bloomington is $261,268.
The median income in Bloomington is $77,384.
Bloomington's Overall Cost Of Living
Lower Than The National Average
Cost Of Living In Bloomington Comparison Table
| Living Expense | Bloomington | Illinois | National Average |
|---|---|---|---|
| Overall | 95 | 98 | 100 |
| Services | 101 | 99 | 100 |
| Groceries | 99 | 99 | 100 |
| Health | 92 | 96 | 100 |
| Housing | 101 | 101 | 100 |
| Transportation | 102 | 99 | 100 |
| Utilities | 96 | 101 | 100 |
Source: Cost of living index, normalized to US average = 100
Bloomington, IL Weather
The average high in Bloomington is 61.4° and the average low is 41.7°.
There are 70.2 days of precipitation each year.
Expect an average of 38.5 inches of precipitation each year with 20.7 inches of snow.
| Stat | Bloomington |
|---|---|
| Average Annual High | 61.4 |
| Average Annual Low | 41.7 |
| Annual Precipitation Days | 70.2 |
| Average Annual Precipitation | 38.5 |
| Average Annual Snowfall | 20.7 |
Average High
Days of Rain
Source: NOAA climate normals (30-year)
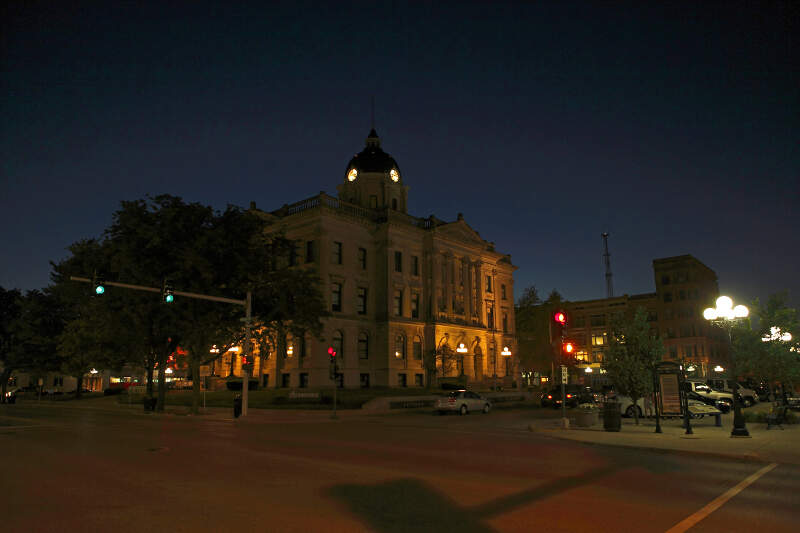
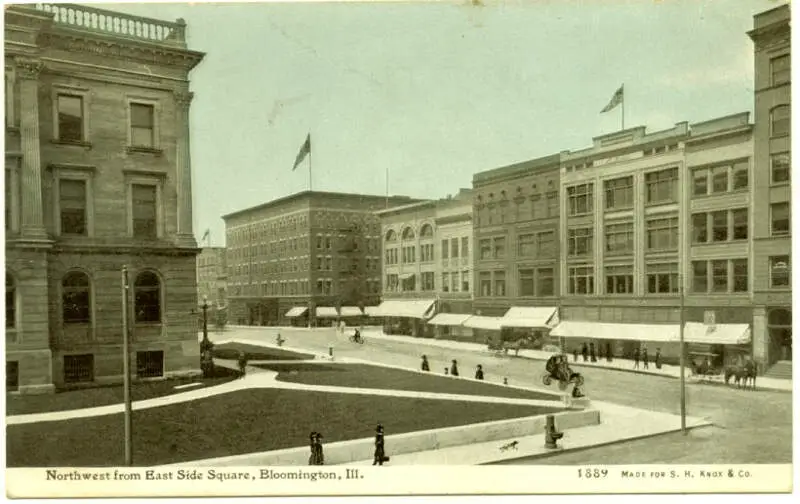
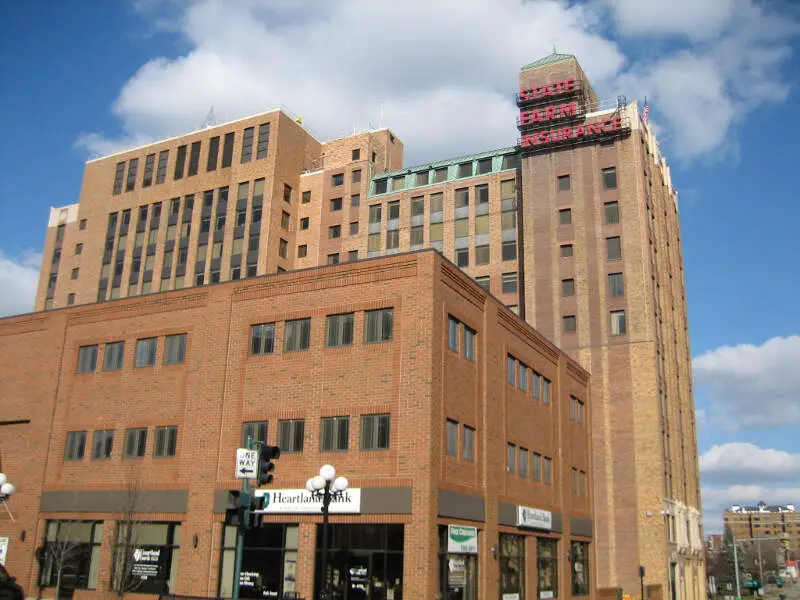
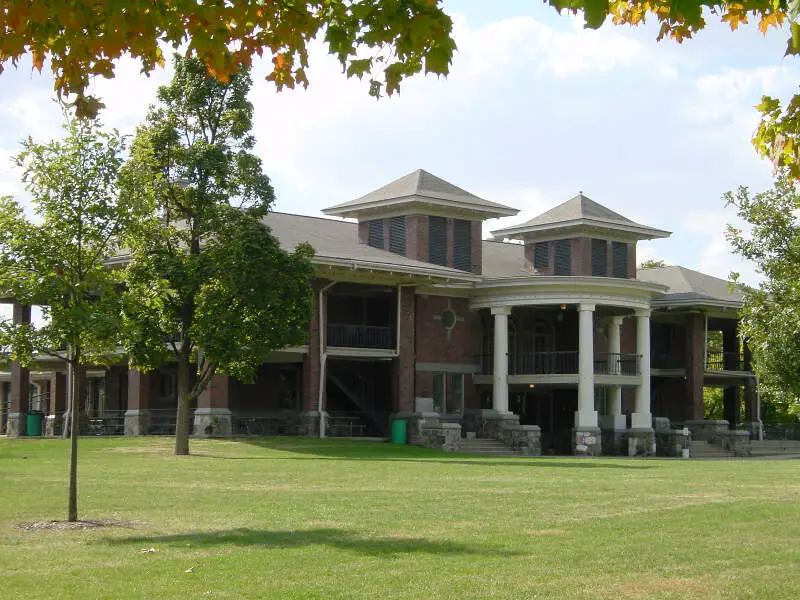
Bloomington, IL Photos


1 Reviews & Comments About Bloomington

i live in bloomington. it's such a nice place to live
Rankings & Articles For Bloomington


Locations Around Bloomington
Map Of Bloomington, IL
Best Places Around Bloomington
Mahomet, IL
Population 10,049
Morton, IL
Population 16,595
Washington, IL
Population 15,919
Savoy, IL
Population 8,968
Monticello, IL
Population 6,304
Champaign, IL
Population 89,996
Normal, IL
Population 53,569
Eureka, IL
Population 5,007
Mount Zion, IL
Population 5,660
Urbana, IL
Population 39,341
Bloomington Demographics And Statistics
Population over time in Bloomington
The current population in Bloomington is 78,907. The population has increased 5.4% from 2010.
| Year | Population | % Change |
|---|---|---|
| 2024 | 78,907 | 0.3% |
| 2023 | 78,703 | -0.1% |
| 2022 | 78,788 | 0.5% |
| 2021 | 78,372 | 0.8% |
| 2020 | 77,725 | -0.4% |
| 2019 | 78,015 | -0.4% |
| 2018 | 78,331 | -0.1% |
| 2017 | 78,426 | 0.1% |
| 2016 | 78,368 | 0.2% |
| 2015 | 78,206 | 0.4% |
| 2014 | 77,883 | 0.8% |
| 2013 | 77,293 | 1.0% |
| 2012 | 76,527 | 1.0% |
| 2011 | 75,757 | 1.2% |
| 2010 | 74,864 | - |
Race / Ethnicity in Bloomington
See the full breakdown
Bloomington is:
69.4% White with 54,779 White residents.
10.2% African American with 8,073 African American residents.
0.0% American Indian with 35 American Indian residents.
8.3% Asian with 6,543 Asian residents.
0.1% Hawaiian with 46 Hawaiian residents.
0.5% Other with 363 Other residents.
4.2% Two Or More with 3,328 Two Or More residents.
7.3% Hispanic with 5,740 Hispanic residents.
| Race | Bloomington | IL | USA |
|---|---|---|---|
| White | 69.4% | 58.1% | 57.4% |
| African American | 10.2% | 13.3% | 11.9% |
| American Indian | 0.0% | 0.1% | 0.5% |
| Asian | 8.3% | 5.9% | 5.9% |
| Hawaiian | 0.1% | 0.0% | 0.2% |
| Other | 0.5% | 0.4% | 0.6% |
| Two Or More | 4.2% | 3.4% | 4.3% |
| Hispanic | 7.3% | 18.8% | 19.3% |
Gender in Bloomington
See the full breakdown
Bloomington is 51.3% female with 40,467 female residents.
Bloomington is 48.7% male with 38,440 male residents.
| Gender | Bloomington | IL | USA |
|---|---|---|---|
| Female | 51.3% | 50.6% | 50.5% |
| Male | 48.7% | 49.4% | 49.5% |
Highest level of educational attainment in Bloomington for adults over 25
See the full breakdown
3.0% of adults in Bloomington completed < 9th grade.
3.0% of adults in Bloomington completed 9-12th grade.
20.0% of adults in Bloomington completed high school / ged.
17.0% of adults in Bloomington completed some college.
9.0% of adults in Bloomington completed associate's degree.
32.0% of adults in Bloomington completed bachelor's degree.
12.0% of adults in Bloomington completed master's degree.
2.0% of adults in Bloomington completed professional degree.
2.0% of adults in Bloomington completed doctorate degree.
| Education | Bloomington | IL | USA |
|---|---|---|---|
| < 9th Grade | 3.0% | 5.0% | 4.0% |
| 9-12th Grade | 3.0% | 5.0% | 6.0% |
| High School / GED | 20.0% | 25.0% | 26.0% |
| Some College | 17.0% | 19.0% | 19.0% |
| Associate's Degree | 9.0% | 8.0% | 9.0% |
| Bachelor's Degree | 32.0% | 23.0% | 22.0% |
| Master's Degree | 12.0% | 11.0% | 10.0% |
| Professional Degree | 2.0% | 2.0% | 2.0% |
| Doctorate Degree | 2.0% | 2.0% | 2.0% |
Household Income For Bloomington, Illinois
See the full breakdown
6.8% of households in Bloomington earn Less than $10,000.
3.7% of households in Bloomington earn $10,000 to $14,999.
5.8% of households in Bloomington earn $15,000 to $24,999.
6.6% of households in Bloomington earn $25,000 to $34,999.
10.2% of households in Bloomington earn $35,000 to $49,999.
15.3% of households in Bloomington earn $50,000 to $74,999.
14.7% of households in Bloomington earn $75,000 to $99,999.
15.7% of households in Bloomington earn $100,000 to $149,999.
10.2% of households in Bloomington earn $150,000 to $199,999.
11.1% of households in Bloomington earn $200,000 or more.
| Income | Bloomington | IL | USA |
|---|---|---|---|
| Less than $10,000 | 6.8% | 5.4% | 5.0% |
| $10,000 to $14,999 | 3.7% | 3.2% | 3.4% |
| $15,000 to $24,999 | 5.8% | 5.9% | 6.3% |
| $25,000 to $34,999 | 6.6% | 6.3% | 6.6% |
| $35,000 to $49,999 | 10.2% | 9.7% | 10.1% |
| $50,000 to $74,999 | 15.3% | 14.8% | 15.5% |
| $75,000 to $99,999 | 14.7% | 12.6% | 12.6% |
| $100,000 to $149,999 | 15.7% | 18.0% | 17.5% |
| $150,000 to $199,999 | 10.2% | 10.1% | 9.6% |
| $200,000 or more | 11.1% | 13.8% | 13.4% |
Source: U.S. Census ACS 5-year estimates (2024)


