Union SnackAbility
Overall SnackAbility
Cost of living in Union summary. We use data on the cost of living to determine how expensive it is to live in Union. Real estate prices drive most of the variance in cost of living around Kentucky. Key points include:
The cost of living in Union is 116 with 100 being average.
The cost of living in Union is 1.2x higher than the national average.
The median home value in Union is $449,092.
The median income in Union is $136,712.
Union's Overall Cost Of Living
Higher Than The National Average
Cost Of Living In Union Comparison Table
| Living Expense | Union | Kentucky | National Average |
|---|---|---|---|
| Overall | 116 | 89 | 100 |
| Services | 94 | 100 | 100 |
| Groceries | 95 | 98 | 100 |
| Health | 165 | 68 | 100 |
| Housing | 96 | 98 | 100 |
| Transportation | 97 | 95 | 100 |
| Utilities | 95 | 96 | 100 |
Source: Cost of living index, normalized to US average = 100
Union, KY Weather
The average high in Union is 63.9° and the average low is 44.6°.
There are 69.5 days of precipitation each year.
Expect an average of 42.2 inches of precipitation each year with 18.2 inches of snow.
| Stat | Union |
|---|---|
| Average Annual High | 63.9 |
| Average Annual Low | 44.6 |
| Annual Precipitation Days | 69.5 |
| Average Annual Precipitation | 42.2 |
| Average Annual Snowfall | 18.2 |
Average High
Days of Rain
Source: NOAA climate normals (30-year)
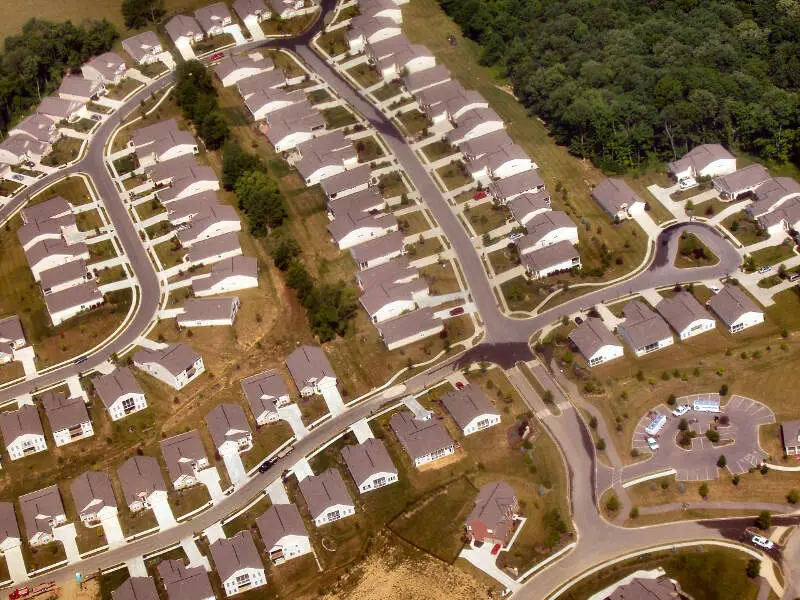
Union, KY Photos
Rankings & Articles For Union


Locations Around Union
Map Of Union, KY
Best Places Around Union
Oakwood, OH
Population 9,458
Kettering, OH
Population 57,206
Germantown, OH
Population 5,825
Wapakoneta, OH
Population 9,894
Clayton, OH
Population 13,277
Oxford, OH
Population 21,753
St. Marys, OH
Population 8,301
Vandalia, OH
Population 15,053
Celina, OH
Population 10,903
Brookville, OH
Population 5,779
Union Demographics And Statistics
Population over time in Union
The current population in Union is 7,642. The population has increased 52.3% from 2010.
| Year | Population | % Change |
|---|---|---|
| 2024 | 7,642 | 2.0% |
| 2023 | 7,494 | 1.7% |
| 2022 | 7,369 | 2.0% |
| 2021 | 7,227 | 20.7% |
| 2020 | 5,988 | 1.3% |
| 2019 | 5,910 | 1.6% |
| 2018 | 5,815 | 1.1% |
| 2017 | 5,751 | 1.3% |
| 2016 | 5,677 | 0.7% |
| 2015 | 5,635 | 1.2% |
| 2014 | 5,569 | 1.7% |
| 2013 | 5,477 | 2.2% |
| 2012 | 5,357 | 2.7% |
| 2011 | 5,217 | 4.0% |
| 2010 | 5,018 | - |
Race / Ethnicity in Union
See the full breakdown
Union is:
89.4% White with 6,832 White residents.
0.0% African American with 0 African American residents.
0.0% American Indian with 0 American Indian residents.
1.8% Asian with 139 Asian residents.
0.0% Hawaiian with 0 Hawaiian residents.
0.0% Other with 0 Other residents.
5.8% Two Or More with 442 Two Or More residents.
3.0% Hispanic with 229 Hispanic residents.
| Race | Union | KY | USA |
|---|---|---|---|
| White | 89.4% | 81.5% | 57.4% |
| African American | 0.0% | 7.6% | 11.9% |
| American Indian | 0.0% | 0.1% | 0.5% |
| Asian | 1.8% | 1.6% | 5.9% |
| Hawaiian | 0.0% | 0.1% | 0.2% |
| Other | 0.0% | 0.3% | 0.6% |
| Two Or More | 5.8% | 3.9% | 4.3% |
| Hispanic | 3.0% | 5.0% | 19.3% |
Gender in Union
See the full breakdown
Union is 47.0% female with 3,591 female residents.
Union is 53.0% male with 4,050 male residents.
| Gender | Union | KY | USA |
|---|---|---|---|
| Female | 47.0% | 50.5% | 50.5% |
| Male | 53.0% | 49.5% | 49.5% |
Highest level of educational attainment in Union for adults over 25
See the full breakdown
0.0% of adults in Union completed < 9th grade.
1.0% of adults in Union completed 9-12th grade.
19.0% of adults in Union completed high school / ged.
12.0% of adults in Union completed some college.
9.0% of adults in Union completed associate's degree.
35.0% of adults in Union completed bachelor's degree.
18.0% of adults in Union completed master's degree.
1.0% of adults in Union completed professional degree.
5.0% of adults in Union completed doctorate degree.
| Education | Union | KY | USA |
|---|---|---|---|
| < 9th Grade | 0.0% | 4.0% | 4.0% |
| 9-12th Grade | 1.0% | 7.0% | 6.0% |
| High School / GED | 19.0% | 33.0% | 26.0% |
| Some College | 12.0% | 20.0% | 19.0% |
| Associate's Degree | 9.0% | 9.0% | 9.0% |
| Bachelor's Degree | 35.0% | 16.0% | 22.0% |
| Master's Degree | 18.0% | 8.0% | 10.0% |
| Professional Degree | 1.0% | 2.0% | 2.0% |
| Doctorate Degree | 5.0% | 1.0% | 2.0% |
Household Income For Union, Kentucky
See the full breakdown
1.0% of households in Union earn Less than $10,000.
2.4% of households in Union earn $10,000 to $14,999.
0.4% of households in Union earn $15,000 to $24,999.
5.1% of households in Union earn $25,000 to $34,999.
4.6% of households in Union earn $35,000 to $49,999.
2.9% of households in Union earn $50,000 to $74,999.
13.3% of households in Union earn $75,000 to $99,999.
31.6% of households in Union earn $100,000 to $149,999.
15.7% of households in Union earn $150,000 to $199,999.
23.1% of households in Union earn $200,000 or more.
| Income | Union | KY | USA |
|---|---|---|---|
| Less than $10,000 | 1.0% | 6.1% | 5.0% |
| $10,000 to $14,999 | 2.4% | 5.2% | 3.4% |
| $15,000 to $24,999 | 0.4% | 8.3% | 6.3% |
| $25,000 to $34,999 | 5.1% | 8.3% | 6.6% |
| $35,000 to $49,999 | 4.6% | 12.1% | 10.1% |
| $50,000 to $74,999 | 2.9% | 17.1% | 15.5% |
| $75,000 to $99,999 | 13.3% | 12.8% | 12.6% |
| $100,000 to $149,999 | 31.6% | 15.9% | 17.5% |
| $150,000 to $199,999 | 15.7% | 7.1% | 9.6% |
| $200,000 or more | 23.1% | 7.2% | 13.4% |
Source: U.S. Census ACS 5-year estimates (2024)


