Benton Harbor SnackAbility
Overall SnackAbility
Crime in Benton Harbor summary. We use data from the FBI to determine the crime rates in Benton Harbor. Key points include:
There were 649 total crimes in Benton Harbor in the last reporting year.
The overall crime rate per 100,000 people in Benton Harbor is 7,371.6 / 100k people.
The violent crime rate per 100,000 people in Benton Harbor is 1,874.1 / 100k people.
The property crime rate per 100,000 people in Benton Harbor is 5,497.5 / 100k people.
Overall, crime in Benton Harbor is 247.85% above the national average.
Total Crimes
Above National Average
Crime In Benton Harbor Comparison Table
| Statistic | Count Raw |
Benton Harbor / 100k People |
Michigan / 100k People |
National / 100k People |
|---|---|---|---|---|
| Total Crimes Per 100K | 649 | 7,371.6 | 1,813.2 | 2,119.2 |
| Violent Crime | 165 | 1,874.1 | 434.3 | 359.0 |
| Murder | 0 | 0.0 | 5.2 | 5.0 |
| Robbery | 14 | 159.0 | 31.3 | 61.0 |
| Aggravated Assault | 145 | 1,647.0 | 341.3 | 256.0 |
| Property Crime | 484 | 5,497.5 | 1,378.9 | 1,760.0 |
| Burglary | 72 | 817.8 | 184.2 | 229.0 |
| Larceny | 278 | 3,157.7 | 963.6 | 1,272.0 |
| Car Theft | 134 | 1,522.0 | 231.0 | 259.0 |
Source: FBI Uniform Crime Reporting (2024)
Cost of living in Benton Harbor summary. We use data on the cost of living to determine how expensive it is to live in Benton Harbor. Real estate prices drive most of the variance in cost of living around Michigan. Key points include:
The cost of living in Benton Harbor is 81 with 100 being average.
The cost of living in Benton Harbor is 0.8x lower than the national average.
The median home value in Benton Harbor is $151,454.
The median income in Benton Harbor is $31,117.
Benton Harbor's Overall Cost Of Living
Lower Than The National Average
Cost Of Living In Benton Harbor Comparison Table
| Living Expense | Benton Harbor | Michigan | National Average |
|---|---|---|---|
| Overall | 81 | 91 | 100 |
| Services | 93 | 97 | 100 |
| Groceries | 99 | 98 | 100 |
| Health | 44 | 75 | 100 |
| Housing | 92 | 98 | 100 |
| Transportation | 95 | 101 | 100 |
| Utilities | 95 | 98 | 100 |
Source: Cost of living index, normalized to US average = 100
Benton Harbor, MI Weather
The average high in Benton Harbor is 58.4° and the average low is 40.2°.
There are 80.5 days of precipitation each year.
Expect an average of 38.2 inches of precipitation each year with 73.1 inches of snow.
| Stat | Benton Harbor |
|---|---|
| Average Annual High | 58.4 |
| Average Annual Low | 40.2 |
| Annual Precipitation Days | 80.5 |
| Average Annual Precipitation | 38.2 |
| Average Annual Snowfall | 73.1 |
Average High
Days of Rain
Source: NOAA climate normals (30-year)
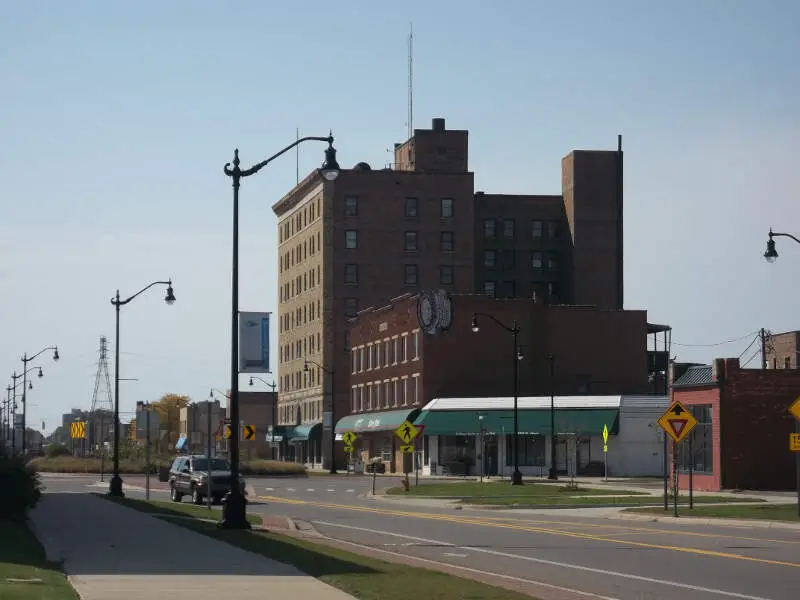
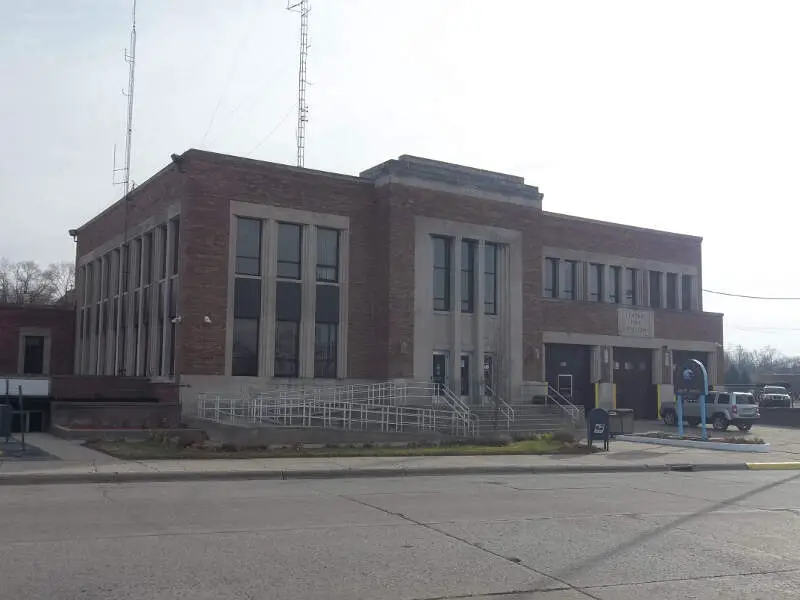
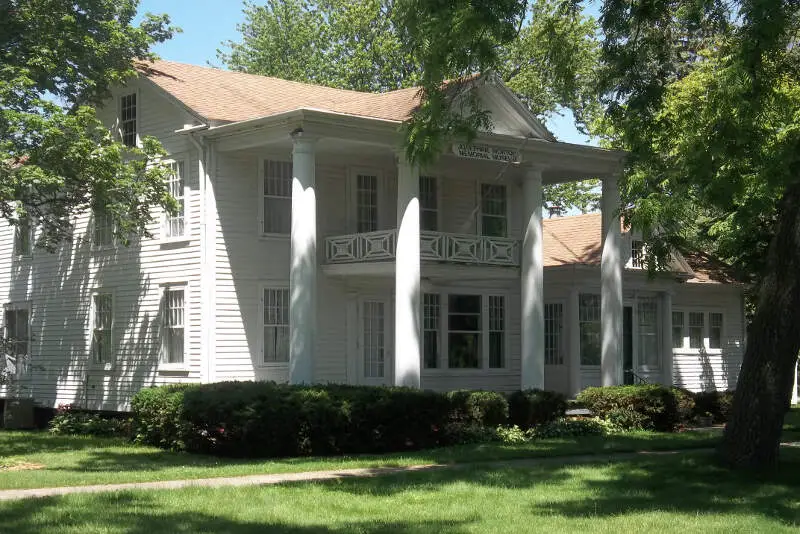
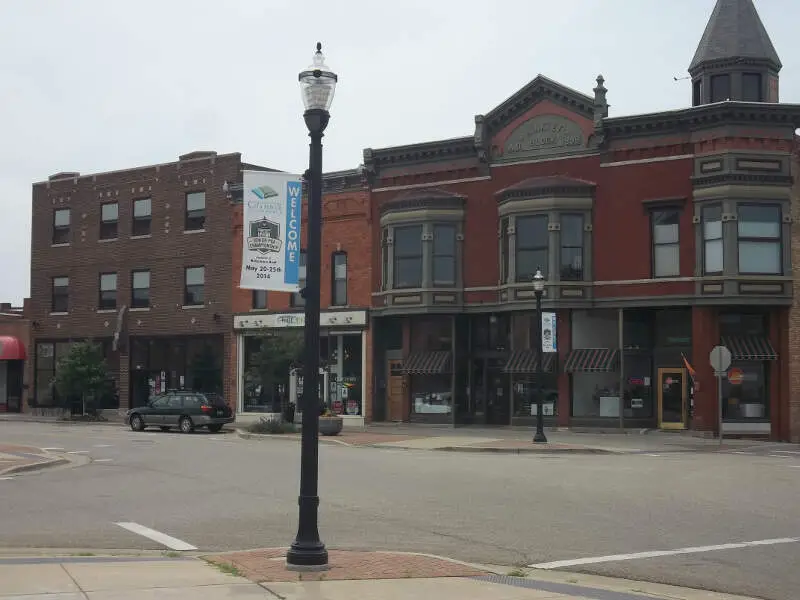
Benton Harbor, MI Photos
1 Reviews & Comments About Benton Harbor

I live in Benton Harbor, it really isn't that bad here. The massive Whirlpool corporation is headquartered here, and they're investing money into the city. It will be a decent place in the coming decades.
Rankings & Articles For Benton Harbor


Locations Around Benton Harbor
Map Of Benton Harbor, MI
Best Places Around Benton Harbor
Portage, MI
Population 49,259
Westwood, MI
Population 8,867
Comstock Northwest, MI
Population 5,391
St. Joseph, MI
Population 7,986
Eastwood, MI
Population 6,669
Dunlap, IN
Population 6,109
Holland, MI
Population 34,423
Granger, IN
Population 30,321
Westville, IN
Population 5,279
Goshen, IN
Population 34,420
Benton Harbor Demographics And Statistics
Population over time in Benton Harbor
The current population in Benton Harbor is 8,953. The population has decreased 12.7% from 2010.
| Year | Population | % Change |
|---|---|---|
| 2024 | 8,953 | -0.8% |
| 2023 | 9,023 | -0.9% |
| 2022 | 9,101 | -0.8% |
| 2021 | 9,171 | -6.5% |
| 2020 | 9,806 | -0.4% |
| 2019 | 9,843 | -0.8% |
| 2018 | 9,920 | -0.2% |
| 2017 | 9,944 | -0.4% |
| 2016 | 9,988 | -0.3% |
| 2015 | 10,014 | -0.4% |
| 2014 | 10,056 | 0.0% |
| 2013 | 10,054 | -0.6% |
| 2012 | 10,113 | -0.6% |
| 2011 | 10,173 | -0.8% |
| 2010 | 10,256 | - |
Race / Ethnicity in Benton Harbor
See the full breakdown
Benton Harbor is:
8.3% White with 747 White residents.
81.5% African American with 7,296 African American residents.
0.0% American Indian with 3 American Indian residents.
0.0% Asian with 0 Asian residents.
0.0% Hawaiian with 0 Hawaiian residents.
0.7% Other with 60 Other residents.
3.6% Two Or More with 326 Two Or More residents.
5.8% Hispanic with 521 Hispanic residents.
| Race | Benton Harbor | MI | USA |
|---|---|---|---|
| White | 8.3% | 72.4% | 57.4% |
| African American | 81.5% | 13.1% | 11.9% |
| American Indian | 0.0% | 0.3% | 0.5% |
| Asian | 0.0% | 3.4% | 5.9% |
| Hawaiian | 0.0% | 0.0% | 0.2% |
| Other | 0.7% | 0.5% | 0.6% |
| Two Or More | 3.6% | 4.5% | 4.3% |
| Hispanic | 5.8% | 5.9% | 19.3% |
Gender in Benton Harbor
See the full breakdown
Benton Harbor is 54.8% female with 4,906 female residents.
Benton Harbor is 45.2% male with 4,047 male residents.
| Gender | Benton Harbor | MI | USA |
|---|---|---|---|
| Female | 54.8% | 50.4% | 50.5% |
| Male | 45.2% | 49.6% | 49.5% |
Highest level of educational attainment in Benton Harbor for adults over 25
See the full breakdown
5.0% of adults in Benton Harbor completed < 9th grade.
16.0% of adults in Benton Harbor completed 9-12th grade.
37.0% of adults in Benton Harbor completed high school / ged.
29.0% of adults in Benton Harbor completed some college.
6.0% of adults in Benton Harbor completed associate's degree.
5.0% of adults in Benton Harbor completed bachelor's degree.
2.0% of adults in Benton Harbor completed master's degree.
0.0% of adults in Benton Harbor completed professional degree.
0.0% of adults in Benton Harbor completed doctorate degree.
| Education | Benton Harbor | MI | USA |
|---|---|---|---|
| < 9th Grade | 5.0% | 3.0% | 4.0% |
| 9-12th Grade | 16.0% | 5.0% | 6.0% |
| High School / GED | 37.0% | 28.0% | 26.0% |
| Some College | 29.0% | 22.0% | 19.0% |
| Associate's Degree | 6.0% | 10.0% | 9.0% |
| Bachelor's Degree | 5.0% | 20.0% | 22.0% |
| Master's Degree | 2.0% | 9.0% | 10.0% |
| Professional Degree | 0.0% | 2.0% | 2.0% |
| Doctorate Degree | 0.0% | 1.0% | 2.0% |
Household Income For Benton Harbor, Michigan
See the full breakdown
11.3% of households in Benton Harbor earn Less than $10,000.
18.4% of households in Benton Harbor earn $10,000 to $14,999.
12.4% of households in Benton Harbor earn $15,000 to $24,999.
14.3% of households in Benton Harbor earn $25,000 to $34,999.
19.8% of households in Benton Harbor earn $35,000 to $49,999.
11.7% of households in Benton Harbor earn $50,000 to $74,999.
3.6% of households in Benton Harbor earn $75,000 to $99,999.
5.4% of households in Benton Harbor earn $100,000 to $149,999.
2.0% of households in Benton Harbor earn $150,000 to $199,999.
1.1% of households in Benton Harbor earn $200,000 or more.
| Income | Benton Harbor | MI | USA |
|---|---|---|---|
| Less than $10,000 | 11.3% | 5.2% | 5.0% |
| $10,000 to $14,999 | 18.4% | 3.8% | 3.4% |
| $15,000 to $24,999 | 12.4% | 6.8% | 6.3% |
| $25,000 to $34,999 | 14.3% | 7.3% | 6.6% |
| $35,000 to $49,999 | 19.8% | 11.4% | 10.1% |
| $50,000 to $74,999 | 11.7% | 16.8% | 15.5% |
| $75,000 to $99,999 | 3.6% | 13.2% | 12.6% |
| $100,000 to $149,999 | 5.4% | 17.3% | 17.5% |
| $150,000 to $199,999 | 2.0% | 8.6% | 9.6% |
| $200,000 or more | 1.1% | 9.5% | 13.4% |
Source: U.S. Census ACS 5-year estimates (2024)


