Manchester, MO
Demographics And Statistics
Living In Manchester, Missouri Summary
Life in Manchester research summary. HomeSnacks has been using Saturday Night Science to research the quality of life in Manchester over the past nine years using Census, FBI, Zillow, and other primary data sources. Based on the most recently available data, we found the following about life in Manchester:
The population in Manchester is 18,189.
The median home value in Manchester is $365,772.
The median income in Manchester is $92,839.
The cost of living in Manchester is 102 which is 1.0x higher than the national average.
The median rent in Manchester is $1,248.
The unemployment rate in Manchester is 2.8%.
The poverty rate in Manchester is 5.7%.
The average high in Manchester is 65.9° and the average low is 46.8°.
Manchester SnackAbility
Overall SnackAbility
Manchester, MO Crime Report
Crime in Manchester summary. We use data from the FBI to determine the crime rates in Manchester. Key points include:
There were 241 total crimes in Manchester in the last reporting year.
The overall crime rate per 100,000 people in Manchester is 1,345.5 / 100k people.
The violent crime rate per 100,000 people in Manchester is 44.7 / 100k people.
The property crime rate per 100,000 people in Manchester is 1,300.8 / 100k people.
Overall, crime in Manchester is -36.51% below the national average.
Total Crimes
Below National Average
Crime In Manchester Comparison Table
| Statistic | Count Raw |
Manchester / 100k People |
Missouri / 100k People |
National / 100k People |
|---|---|---|---|---|
| Total Crimes Per 100K | 241 | 1,345.5 | 2,403.3 | 2,119.2 |
| Violent Crime | 8 | 44.7 | 462.0 | 359.0 |
| Murder | 1 | 5.6 | 7.8 | 5.0 |
| Robbery | 1 | 5.6 | 51.5 | 61.0 |
| Aggravated Assault | 3 | 16.7 | 357.5 | 256.0 |
| Property Crime | 233 | 1,300.8 | 1,941.2 | 1,760.0 |
| Burglary | 4 | 22.3 | 236.3 | 229.0 |
| Larceny | 223 | 1,245.0 | 1,306.5 | 1,272.0 |
| Car Theft | 6 | 33.5 | 398.4 | 259.0 |
Manchester, MO Cost Of Living
Cost of living in Manchester summary. We use data on the cost of living to determine how expensive it is to live in Manchester. Real estate prices drive most of the variance in cost of living around Missouri. Key points include:
The cost of living in Manchester is 102 with 100 being average.
The cost of living in Manchester is 1.0x higher than the national average.
The median home value in Manchester is $365,772.
The median income in Manchester is $92,839.
Manchester's Overall Cost Of Living
Higher Than The National Average
Cost Of Living In Manchester Comparison Table
| Living Expense | Manchester | Missouri | National Average | |
|---|---|---|---|---|
| Overall | 102 | 88 | 100 | |
| Services | 94 | 93 | 100 | |
| Groceries | 96 | 96 | 100 | |
| Health | 91 | 91 | 100 | |
| Housing | 125 | 78 | 100 | |
| Transportation | 92 | 90 | 100 | |
| Utilities | 103 | 99 | 100 | |
Manchester, MO Weather
The average high in Manchester is 65.9° and the average low is 46.8°.
There are 71.9 days of precipitation each year.
Expect an average of 42.6 inches of precipitation each year with 14.3 inches of snow.
| Stat | Manchester |
|---|---|
| Average Annual High | 65.9 |
| Average Annual Low | 46.8 |
| Annual Precipitation Days | 71.9 |
| Average Annual Precipitation | 42.6 |
| Average Annual Snowfall | 14.3 |
Average High
Days of Rain
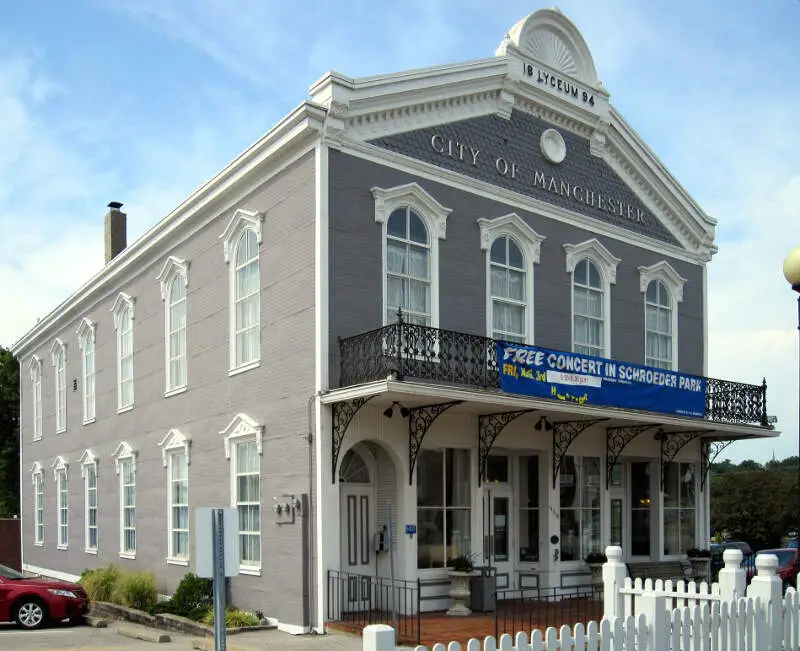
Manchester, MO Photos
Rankings for Manchester in Missouri


Locations Around Manchester
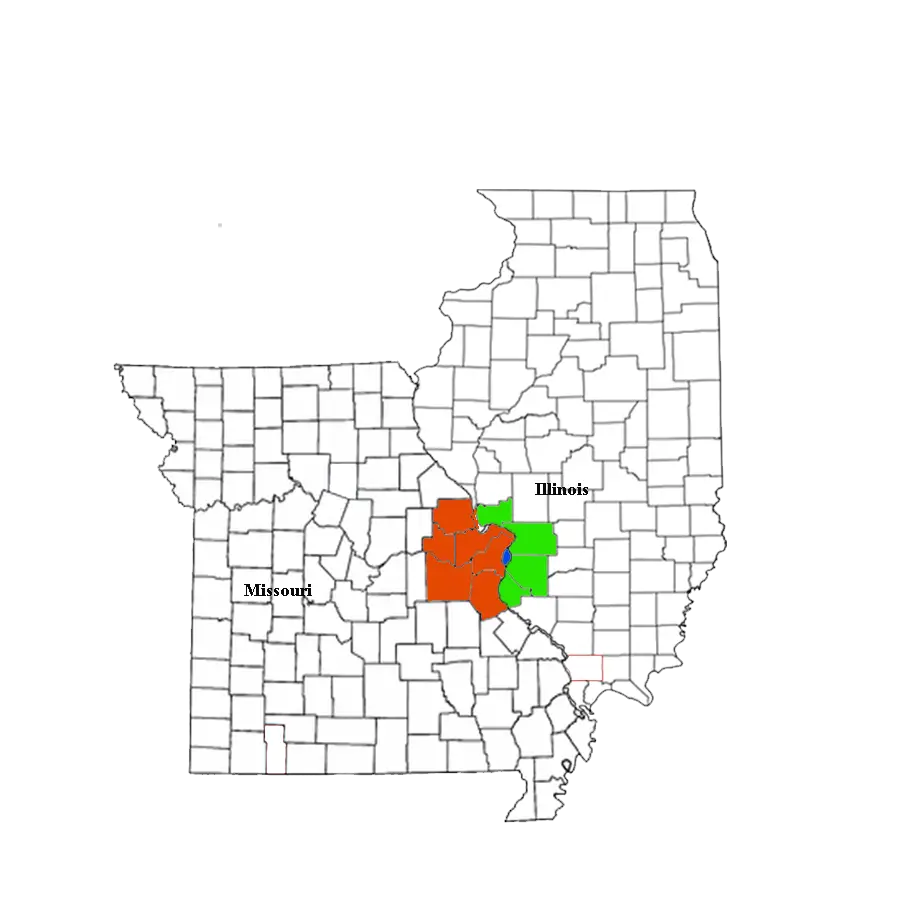
Map Of Manchester, MO
Best Places Around Manchester
Columbia, IL
Population 11,063
Wildwood, MO
Population 35,168
Ballwin, MO
Population 30,835
Chesterfield, MO
Population 49,591
O'Fallon, MO
Population 92,697
Dardenne Prairie, MO
Population 13,137
Town and Country, MO
Population 11,605
Kirkwood, MO
Population 29,302
Glendale, MO
Population 6,111
Weldon Spring, MO
Population 5,291
Manchester Demographics And Statistics
Population over time in Manchester
The current population in Manchester is 18,189. The population has decreased -0.1% from 2010.
| Year | Population | % Change |
|---|---|---|
| 2023 | 18,189 | -0.3% |
| 2022 | 18,240 | -0.4% |
| 2021 | 18,308 | 1.1% |
| 2020 | 18,102 | -0.0% |
| 2019 | 18,110 | -0.4% |
| 2018 | 18,189 | 0.3% |
| 2017 | 18,130 | -0.3% |
| 2016 | 18,183 | -0.0% |
| 2015 | 18,187 | 0.3% |
| 2014 | 18,125 | -0.1% |
| 2013 | 18,152 | -0.0% |
| 2012 | 18,154 | -0.0% |
| 2011 | 18,157 | -0.3% |
| 2010 | 18,215 | - |
Race / Ethnicity in Manchester
Manchester is:
73.1% White with 13,303 White residents.
3.1% African American with 556 African American residents.
0.0% American Indian with 0 American Indian residents.
11.7% Asian with 2,121 Asian residents.
0.1% Hawaiian with 14 Hawaiian residents.
0.5% Other with 93 Other residents.
6.9% Two Or More with 1,251 Two Or More residents.
4.7% Hispanic with 851 Hispanic residents.
| Race | Manchester | MO | USA |
|---|---|---|---|
| White | 73.1% | 76.8% | 58.2% |
| African American | 3.1% | 11.0% | 12.0% |
| American Indian | 0.0% | 0.2% | 0.5% |
| Asian | 11.7% | 2.1% | 5.7% |
| Hawaiian | 0.1% | 0.1% | 0.2% |
| Other | 0.5% | 0.4% | 0.5% |
| Two Or More | 6.9% | 4.4% | 3.9% |
| Hispanic | 4.7% | 5.1% | 19.0% |
Gender in Manchester
Manchester is 49.5% female with 9,011 female residents.
Manchester is 50.5% male with 9,178 male residents.
| Gender | Manchester | MO | USA |
|---|---|---|---|
| Female | 49.5% | 50.7% | 50.5% |
| Male | 50.5% | 49.3% | 49.5% |
Highest level of educational attainment in Manchester for adults over 25
1.0% of adults in Manchester completed < 9th grade.
2.0% of adults in Manchester completed 9-12th grade.
13.0% of adults in Manchester completed high school / ged.
16.0% of adults in Manchester completed some college.
6.0% of adults in Manchester completed associate's degree.
37.0% of adults in Manchester completed bachelor's degree.
20.0% of adults in Manchester completed master's degree.
3.0% of adults in Manchester completed professional degree.
2.0% of adults in Manchester completed doctorate degree.
| Education | Manchester | MO | USA |
|---|---|---|---|
| < 9th Grade | 1.0% | 3.0% | 5.0% |
| 9-12th Grade | 2.0% | 6.0% | 6.0% |
| High School / GED | 13.0% | 30.0% | 26.0% |
| Some College | 16.0% | 21.0% | 19.0% |
| Associate's Degree | 6.0% | 8.0% | 9.0% |
| Bachelor's Degree | 37.0% | 20.0% | 21.0% |
| Master's Degree | 20.0% | 9.0% | 10.0% |
| Professional Degree | 3.0% | 2.0% | 2.0% |
| Doctorate Degree | 2.0% | 1.0% | 2.0% |
Household Income For Manchester, Missouri
1.6% of households in Manchester earn Less than $10,000.
1.4% of households in Manchester earn $10,000 to $14,999.
4.6% of households in Manchester earn $15,000 to $24,999.
6.0% of households in Manchester earn $25,000 to $34,999.
10.4% of households in Manchester earn $35,000 to $49,999.
16.4% of households in Manchester earn $50,000 to $74,999.
11.3% of households in Manchester earn $75,000 to $99,999.
19.5% of households in Manchester earn $100,000 to $149,999.
14.3% of households in Manchester earn $150,000 to $199,999.
14.6% of households in Manchester earn $200,000 or more.
| Income | Manchester | MO | USA |
|---|---|---|---|
| Less than $10,000 | 1.6% | 4.8% | 4.9% |
| $10,000 to $14,999 | 1.4% | 4.0% | 3.6% |
| $15,000 to $24,999 | 4.6% | 7.6% | 6.6% |
| $25,000 to $34,999 | 6.0% | 7.9% | 6.8% |
| $35,000 to $49,999 | 10.4% | 12.2% | 10.4% |
| $50,000 to $74,999 | 16.4% | 17.5% | 15.7% |
| $75,000 to $99,999 | 11.3% | 13.3% | 12.7% |
| $100,000 to $149,999 | 19.5% | 16.9% | 17.4% |
| $150,000 to $199,999 | 14.3% | 7.7% | 9.3% |
| $200,000 or more | 14.6% | 8.1% | 12.6% |


