Moberly SnackAbility
Overall SnackAbility
Crime in Moberly summary. We use data from the FBI to determine the crime rates in Moberly. Key points include:
There were 177 total crimes in Moberly in the last reporting year.
The overall crime rate per 100,000 people in Moberly is 1,340.3 / 100k people.
The violent crime rate per 100,000 people in Moberly is 318.0 / 100k people.
The property crime rate per 100,000 people in Moberly is 1,022.3 / 100k people.
Overall, crime in Moberly is -36.76% below the national average.
Total Crimes
Below National Average
Crime In Moberly Comparison Table
| Statistic | Count Raw |
Moberly / 100k People |
Missouri / 100k People |
National / 100k People |
|---|---|---|---|---|
| Total Crimes Per 100K | 177 | 1,340.3 | 2,403.3 | 2,119.2 |
| Violent Crime | 42 | 318.0 | 462.0 | 359.0 |
| Murder | 0 | 0.0 | 7.8 | 5.0 |
| Robbery | 1 | 7.6 | 51.5 | 61.0 |
| Aggravated Assault | 35 | 265.0 | 357.5 | 256.0 |
| Property Crime | 135 | 1,022.3 | 1,941.2 | 1,760.0 |
| Burglary | 28 | 212.0 | 236.3 | 229.0 |
| Larceny | 98 | 742.1 | 1,306.5 | 1,272.0 |
| Car Theft | 9 | 68.2 | 398.4 | 259.0 |
Source: FBI Uniform Crime Reporting (2024)
Cost of living in Moberly summary. We use data on the cost of living to determine how expensive it is to live in Moberly. Real estate prices drive most of the variance in cost of living around Missouri. Key points include:
The cost of living in Moberly is 87 with 100 being average.
The cost of living in Moberly is 0.9x lower than the national average.
The median home value in Moberly is $158,147.
The median income in Moberly is $44,145.
Moberly's Overall Cost Of Living
Lower Than The National Average
Cost Of Living In Moberly Comparison Table
| Living Expense | Moberly | Missouri | National Average |
|---|---|---|---|
| Overall | 87 | 90 | 100 |
| Services | 101 | 97 | 100 |
| Groceries | 96 | 98 | 100 |
| Health | 57 | 76 | 100 |
| Housing | 99 | 95 | 100 |
| Transportation | 97 | 94 | 100 |
| Utilities | 98 | 96 | 100 |
Source: Cost of living index, normalized to US average = 100
Moberly, MO Weather
The average high in Moberly is 64.1° and the average low is 44.2°.
There are 69.1 days of precipitation each year.
Expect an average of 43.1 inches of precipitation each year with 12.1 inches of snow.
| Stat | Moberly |
|---|---|
| Average Annual High | 64.1 |
| Average Annual Low | 44.2 |
| Annual Precipitation Days | 69.1 |
| Average Annual Precipitation | 43.1 |
| Average Annual Snowfall | 12.1 |
Average High
Days of Rain
Source: NOAA climate normals (30-year)
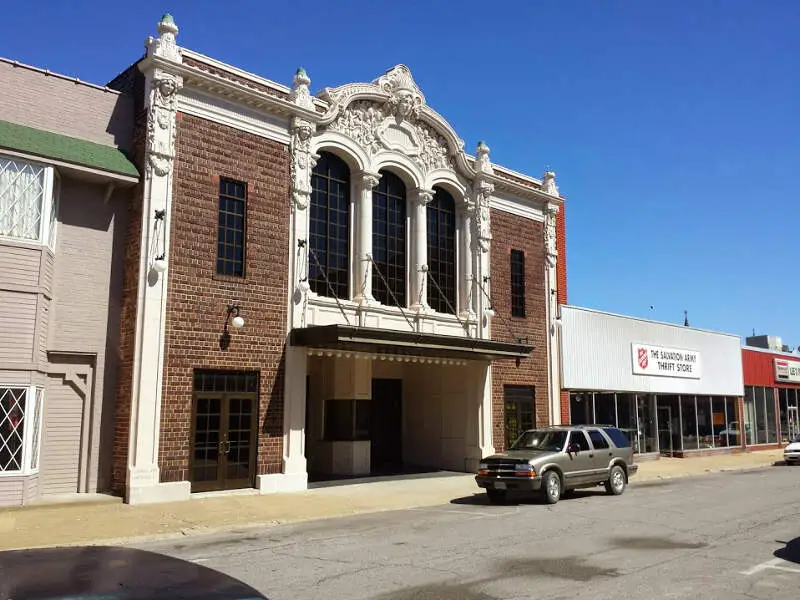
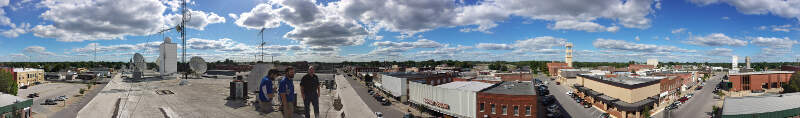
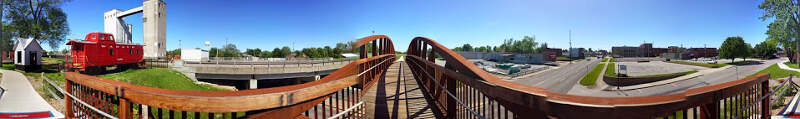
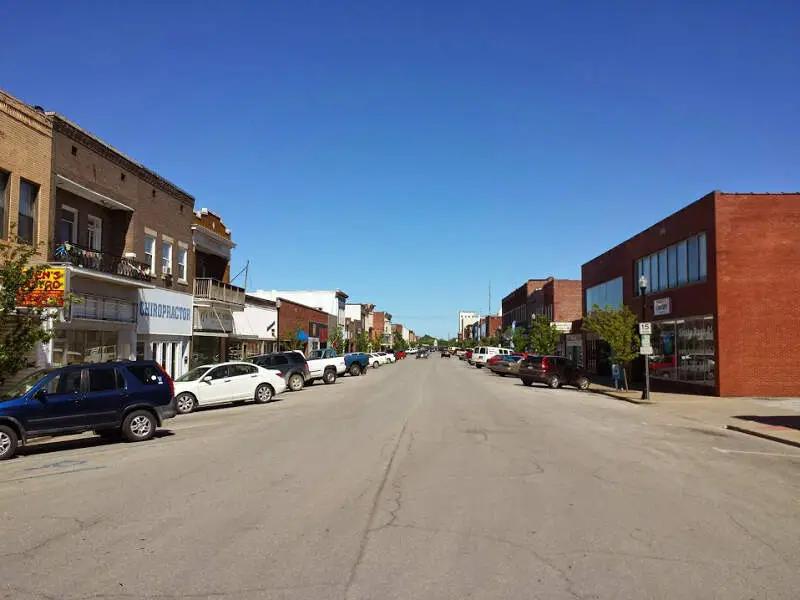
Moberly, MO Photos
Rankings & Articles For Moberly


Locations Around Moberly
Map Of Moberly, MO
Best Places Around Moberly
Columbia, MO
Population 128,548
Marshall, MO
Population 13,739
Boonville, MO
Population 7,689
Fulton, MO
Population 12,617
Mexico, MO
Population 11,477
Monroe, NC
Population 36,759
Macon, MO
Population 5,466
Jamestown, ND
Population 15,787
Moberly Demographics And Statistics
Population over time in Moberly
The current population in Moberly is 13,526. The population has decreased 3.8% from 2010.
| Year | Population | % Change |
|---|---|---|
| 2024 | 13,526 | -0.8% |
| 2023 | 13,634 | -0.5% |
| 2022 | 13,708 | -1.6% |
| 2021 | 13,933 | 1.6% |
| 2020 | 13,710 | 0.0% |
| 2019 | 13,707 | -0.4% |
| 2018 | 13,762 | -0.1% |
| 2017 | 13,775 | -0.7% |
| 2016 | 13,867 | -0.1% |
| 2015 | 13,879 | -0.1% |
| 2014 | 13,898 | -0.2% |
| 2013 | 13,925 | -0.4% |
| 2012 | 13,980 | -0.4% |
| 2011 | 14,035 | -0.2% |
| 2010 | 14,057 | - |
Race / Ethnicity in Moberly
See the full breakdown
Moberly is:
82.6% White with 11,175 White residents.
8.3% African American with 1,124 African American residents.
0.1% American Indian with 16 American Indian residents.
0.3% Asian with 38 Asian residents.
0.0% Hawaiian with 6 Hawaiian residents.
0.0% Other with 0 Other residents.
6.0% Two Or More with 811 Two Or More residents.
2.6% Hispanic with 356 Hispanic residents.
| Race | Moberly | MO | USA |
|---|---|---|---|
| White | 82.6% | 76.3% | 57.4% |
| African American | 8.3% | 10.9% | 11.9% |
| American Indian | 0.1% | 0.2% | 0.5% |
| Asian | 0.3% | 2.1% | 5.9% |
| Hawaiian | 0.0% | 0.1% | 0.2% |
| Other | 0.0% | 0.4% | 0.6% |
| Two Or More | 6.0% | 4.8% | 4.3% |
| Hispanic | 2.6% | 5.2% | 19.3% |
Gender in Moberly
See the full breakdown
Moberly is 46.8% female with 6,331 female residents.
Moberly is 53.2% male with 7,195 male residents.
| Gender | Moberly | MO | USA |
|---|---|---|---|
| Female | 46.8% | 50.7% | 50.5% |
| Male | 53.2% | 49.3% | 49.5% |
Highest level of educational attainment in Moberly for adults over 25
See the full breakdown
5.0% of adults in Moberly completed < 9th grade.
8.0% of adults in Moberly completed 9-12th grade.
46.0% of adults in Moberly completed high school / ged.
17.0% of adults in Moberly completed some college.
9.0% of adults in Moberly completed associate's degree.
12.0% of adults in Moberly completed bachelor's degree.
3.0% of adults in Moberly completed master's degree.
0.0% of adults in Moberly completed professional degree.
0.0% of adults in Moberly completed doctorate degree.
| Education | Moberly | MO | USA |
|---|---|---|---|
| < 9th Grade | 5.0% | 4.0% | 4.0% |
| 9-12th Grade | 8.0% | 5.0% | 6.0% |
| High School / GED | 46.0% | 30.0% | 26.0% |
| Some College | 17.0% | 21.0% | 19.0% |
| Associate's Degree | 9.0% | 8.0% | 9.0% |
| Bachelor's Degree | 12.0% | 20.0% | 22.0% |
| Master's Degree | 3.0% | 9.0% | 10.0% |
| Professional Degree | 0.0% | 2.0% | 2.0% |
| Doctorate Degree | 0.0% | 1.0% | 2.0% |
Household Income For Moberly, Missouri
See the full breakdown
4.7% of households in Moberly earn Less than $10,000.
5.8% of households in Moberly earn $10,000 to $14,999.
9.6% of households in Moberly earn $15,000 to $24,999.
17.9% of households in Moberly earn $25,000 to $34,999.
18.0% of households in Moberly earn $35,000 to $49,999.
13.4% of households in Moberly earn $50,000 to $74,999.
14.2% of households in Moberly earn $75,000 to $99,999.
9.9% of households in Moberly earn $100,000 to $149,999.
4.1% of households in Moberly earn $150,000 to $199,999.
2.4% of households in Moberly earn $200,000 or more.
| Income | Moberly | MO | USA |
|---|---|---|---|
| Less than $10,000 | 4.7% | 4.9% | 5.0% |
| $10,000 to $14,999 | 5.8% | 3.8% | 3.4% |
| $15,000 to $24,999 | 9.6% | 7.1% | 6.3% |
| $25,000 to $34,999 | 17.9% | 7.8% | 6.6% |
| $35,000 to $49,999 | 18.0% | 11.9% | 10.1% |
| $50,000 to $74,999 | 13.4% | 17.4% | 15.5% |
| $75,000 to $99,999 | 14.2% | 13.2% | 12.6% |
| $100,000 to $149,999 | 9.9% | 17.1% | 17.5% |
| $150,000 to $199,999 | 4.1% | 8.2% | 9.6% |
| $200,000 or more | 2.4% | 8.7% | 13.4% |
Source: U.S. Census ACS 5-year estimates (2024)


