Compare Overland to…
Overland SnackAbility
Overall SnackAbility
Crime in Overland summary. We use data from the FBI to determine the crime rates in Overland. Key points include:
There were 416 total crimes in Overland in the last reporting year.
The overall crime rate per 100,000 people in Overland is 2,708.7 / 100k people.
The violent crime rate per 100,000 people in Overland is 527.4 / 100k people.
The property crime rate per 100,000 people in Overland is 2,181.3 / 100k people.
Overall, crime in Overland is 27.81% above the national average.
Total Crimes
Above National Average
Crime In Overland Comparison Table
| Statistic | Count Raw |
Overland / 100k People |
Missouri / 100k People |
National / 100k People |
|---|---|---|---|---|
| Total Crimes Per 100K | 416 | 2,708.7 | 2,403.3 | 2,119.2 |
| Violent Crime | 81 | 527.4 | 462.0 | 359.0 |
| Murder | 3 | 19.5 | 7.8 | 5.0 |
| Robbery | 12 | 78.1 | 51.5 | 61.0 |
| Aggravated Assault | 65 | 423.2 | 357.5 | 256.0 |
| Property Crime | 335 | 2,181.3 | 1,941.2 | 1,760.0 |
| Burglary | 20 | 130.2 | 236.3 | 229.0 |
| Larceny | 239 | 1,556.2 | 1,306.5 | 1,272.0 |
| Car Theft | 76 | 494.9 | 398.4 | 259.0 |
Source: FBI Uniform Crime Reporting (2024)
Cost of living in Overland summary. We use data on the cost of living to determine how expensive it is to live in Overland. Real estate prices drive most of the variance in cost of living around Missouri. Key points include:
The cost of living in Overland is 89 with 100 being average.
The cost of living in Overland is 0.9x lower than the national average.
The median home value in Overland is $150,450.
The median income in Overland is $61,773.
Overland's Overall Cost Of Living
Lower Than The National Average
Cost Of Living In Overland Comparison Table
| Living Expense | Overland | Missouri | National Average |
|---|---|---|---|
| Overall | 89 | 90 | 100 |
| Services | 100 | 97 | 100 |
| Groceries | 99 | 98 | 100 |
| Health | 69 | 76 | 100 |
| Housing | 96 | 95 | 100 |
| Transportation | 94 | 94 | 100 |
| Utilities | 100 | 96 | 100 |
Source: Cost of living index, normalized to US average = 100
Overland, MO Weather
The average high in Overland is 65.9° and the average low is 47.7°.
There are 70.2 days of precipitation each year.
Expect an average of 41.9 inches of precipitation each year with 14.8 inches of snow.
| Stat | Overland |
|---|---|
| Average Annual High | 65.9 |
| Average Annual Low | 47.7 |
| Annual Precipitation Days | 70.2 |
| Average Annual Precipitation | 41.9 |
| Average Annual Snowfall | 14.8 |
Average High
Days of Rain
Source: NOAA climate normals (30-year)
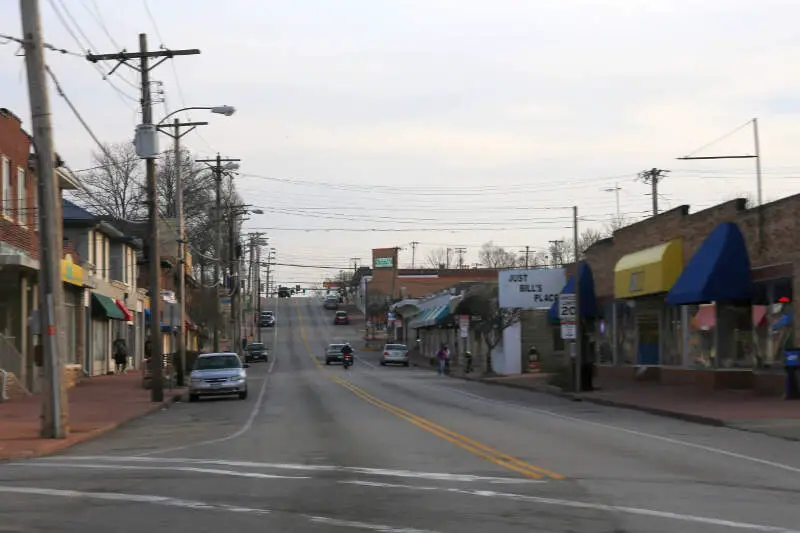
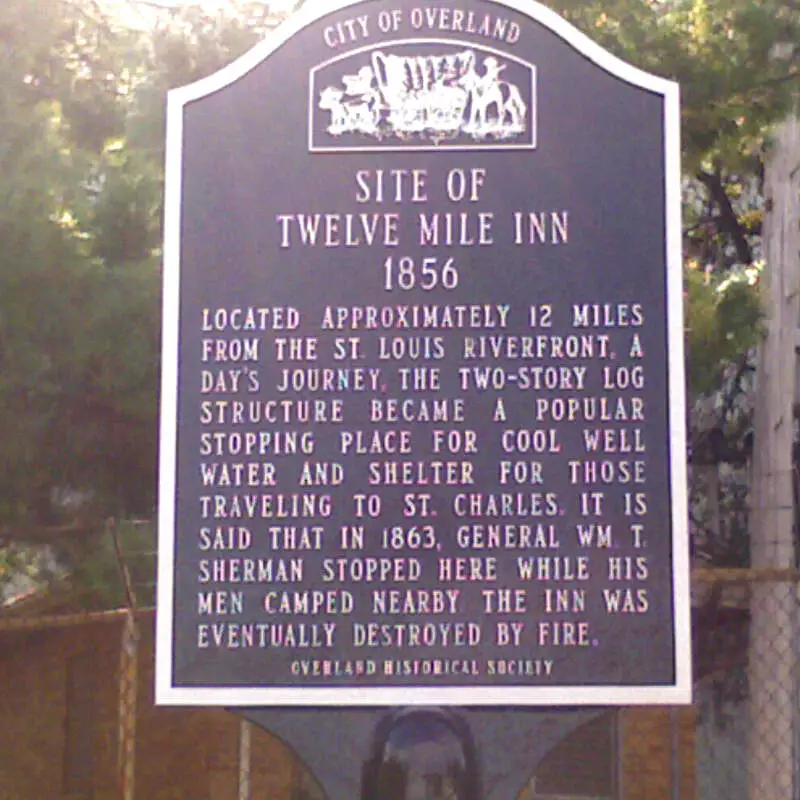
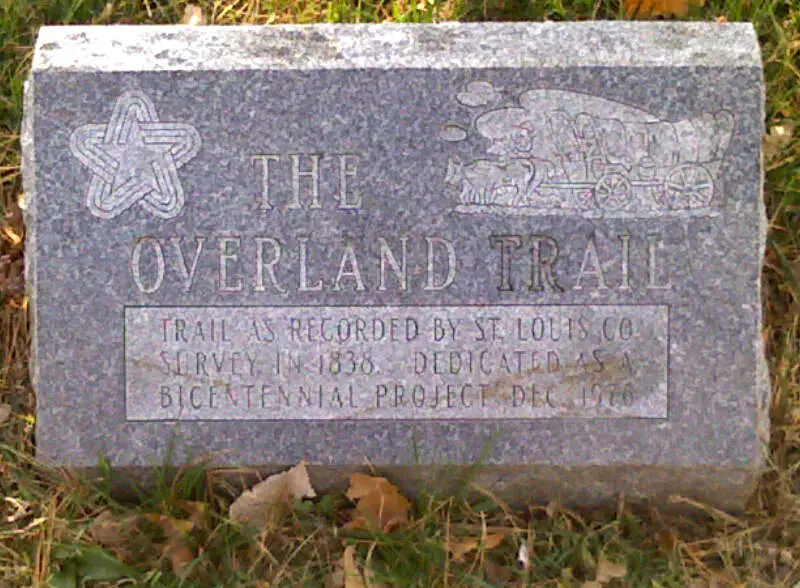
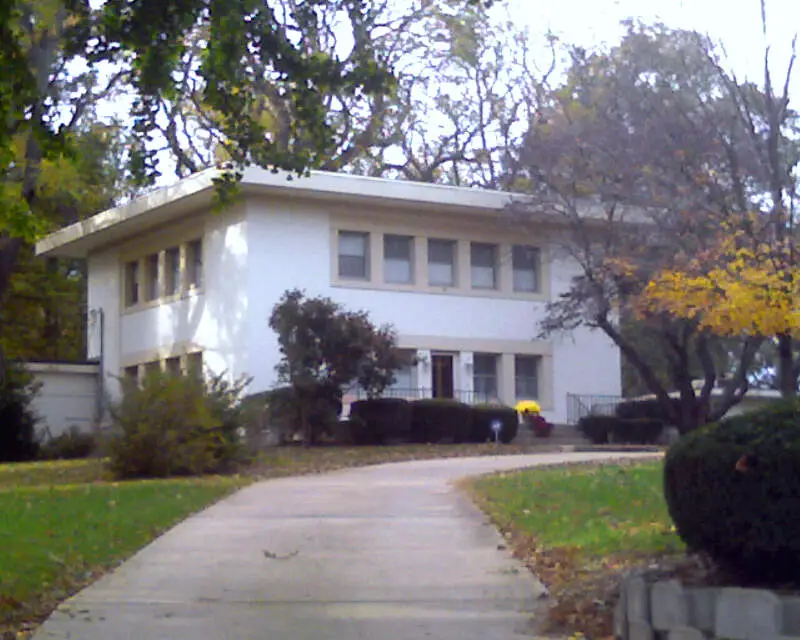
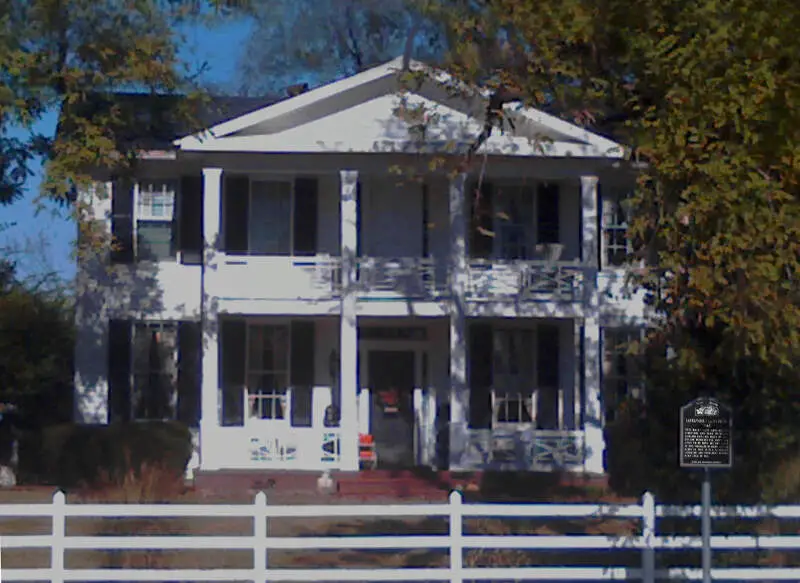
Overland, MO Photos

Rankings & Articles For Overland


Locations Around Overland
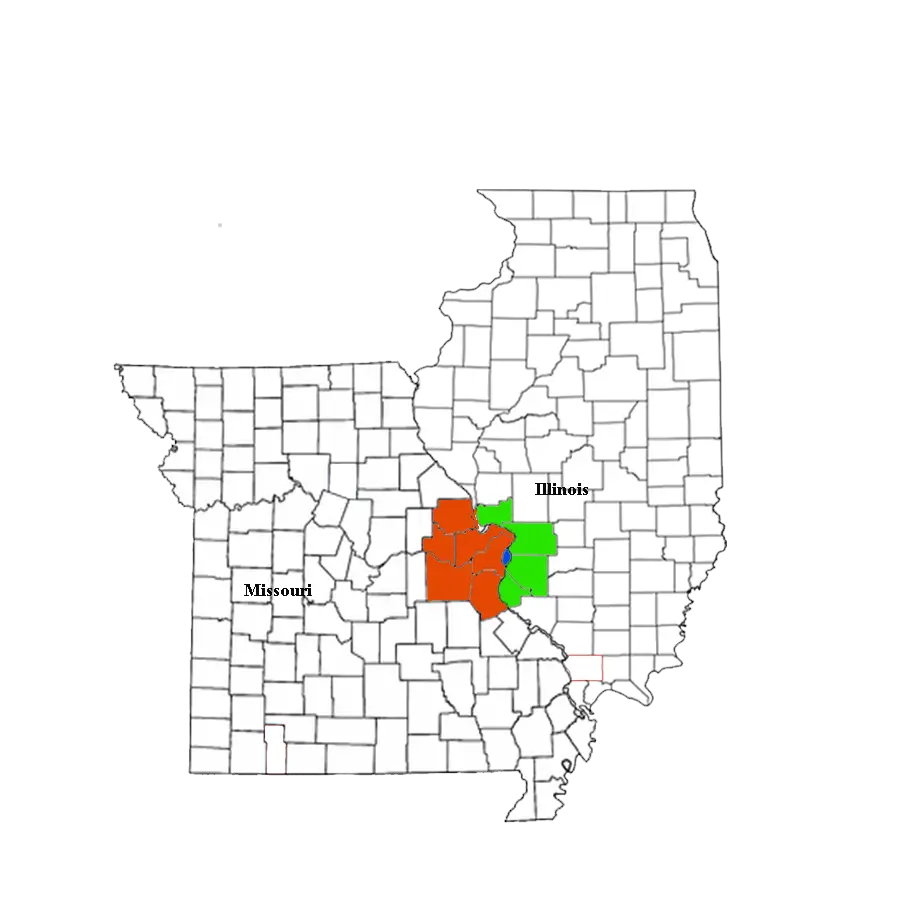
Map Of Overland, MO
Best Places Around Overland
Columbia, IL
Population 11,127
Godfrey, IL
Population 17,712
Pontoon Beach, IL
Population 6,025
Collinsville, IL
Population 24,031
Wood River, IL
Population 10,279
Wildwood, MO
Population 35,133
Ballwin, MO
Population 31,279
Chesterfield, MO
Population 49,574
O'Fallon, MO
Population 93,801
Dardenne Prairie, MO
Population 13,503
Overland Demographics And Statistics
Population over time in Overland
The current population in Overland is 15,695. The population has decreased 2.9% from 2010.
| Year | Population | % Change |
|---|---|---|
| 2024 | 15,695 | -0.4% |
| 2023 | 15,762 | -0.5% |
| 2022 | 15,838 | -0.4% |
| 2021 | 15,908 | 1.7% |
| 2020 | 15,644 | -0.5% |
| 2019 | 15,715 | -0.5% |
| 2018 | 15,787 | -0.7% |
| 2017 | 15,901 | -0.2% |
| 2016 | 15,932 | -0.5% |
| 2015 | 16,011 | -0.2% |
| 2014 | 16,043 | 0.0% |
| 2013 | 16,041 | -0.1% |
| 2012 | 16,063 | -0.3% |
| 2011 | 16,108 | -0.3% |
| 2010 | 16,163 | - |
Race / Ethnicity in Overland
See the full breakdown
Overland is:
49.0% White with 7,692 White residents.
27.0% African American with 4,241 African American residents.
0.1% American Indian with 12 American Indian residents.
1.9% Asian with 305 Asian residents.
0.0% Hawaiian with 0 Hawaiian residents.
1.7% Other with 272 Other residents.
4.9% Two Or More with 765 Two Or More residents.
15.3% Hispanic with 2,408 Hispanic residents.
| Race | Overland | MO | USA |
|---|---|---|---|
| White | 49.0% | 76.3% | 57.4% |
| African American | 27.0% | 10.9% | 11.9% |
| American Indian | 0.1% | 0.2% | 0.5% |
| Asian | 1.9% | 2.1% | 5.9% |
| Hawaiian | 0.0% | 0.1% | 0.2% |
| Other | 1.7% | 0.4% | 0.6% |
| Two Or More | 4.9% | 4.8% | 4.3% |
| Hispanic | 15.3% | 5.2% | 19.3% |
Gender in Overland
See the full breakdown
Overland is 52.4% female with 8,230 female residents.
Overland is 47.6% male with 7,465 male residents.
| Gender | Overland | MO | USA |
|---|---|---|---|
| Female | 52.4% | 50.7% | 50.5% |
| Male | 47.6% | 49.3% | 49.5% |
Highest level of educational attainment in Overland for adults over 25
See the full breakdown
7.0% of adults in Overland completed < 9th grade.
6.0% of adults in Overland completed 9-12th grade.
32.0% of adults in Overland completed high school / ged.
19.0% of adults in Overland completed some college.
7.0% of adults in Overland completed associate's degree.
20.0% of adults in Overland completed bachelor's degree.
7.0% of adults in Overland completed master's degree.
1.0% of adults in Overland completed professional degree.
1.0% of adults in Overland completed doctorate degree.
| Education | Overland | MO | USA |
|---|---|---|---|
| < 9th Grade | 7.0% | 4.0% | 4.0% |
| 9-12th Grade | 6.0% | 5.0% | 6.0% |
| High School / GED | 32.0% | 30.0% | 26.0% |
| Some College | 19.0% | 21.0% | 19.0% |
| Associate's Degree | 7.0% | 8.0% | 9.0% |
| Bachelor's Degree | 20.0% | 20.0% | 22.0% |
| Master's Degree | 7.0% | 9.0% | 10.0% |
| Professional Degree | 1.0% | 2.0% | 2.0% |
| Doctorate Degree | 1.0% | 1.0% | 2.0% |
Household Income For Overland, Missouri
See the full breakdown
4.7% of households in Overland earn Less than $10,000.
3.1% of households in Overland earn $10,000 to $14,999.
4.7% of households in Overland earn $15,000 to $24,999.
10.1% of households in Overland earn $25,000 to $34,999.
16.5% of households in Overland earn $35,000 to $49,999.
21.1% of households in Overland earn $50,000 to $74,999.
15.8% of households in Overland earn $75,000 to $99,999.
14.2% of households in Overland earn $100,000 to $149,999.
5.6% of households in Overland earn $150,000 to $199,999.
4.2% of households in Overland earn $200,000 or more.
| Income | Overland | MO | USA |
|---|---|---|---|
| Less than $10,000 | 4.7% | 4.9% | 5.0% |
| $10,000 to $14,999 | 3.1% | 3.8% | 3.4% |
| $15,000 to $24,999 | 4.7% | 7.1% | 6.3% |
| $25,000 to $34,999 | 10.1% | 7.8% | 6.6% |
| $35,000 to $49,999 | 16.5% | 11.9% | 10.1% |
| $50,000 to $74,999 | 21.1% | 17.4% | 15.5% |
| $75,000 to $99,999 | 15.8% | 13.2% | 12.6% |
| $100,000 to $149,999 | 14.2% | 17.1% | 17.5% |
| $150,000 to $199,999 | 5.6% | 8.2% | 9.6% |
| $200,000 or more | 4.2% | 8.7% | 13.4% |
Source: U.S. Census ACS 5-year estimates (2024)


