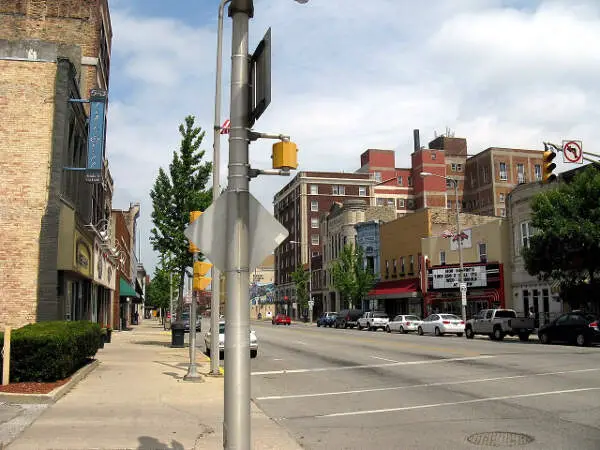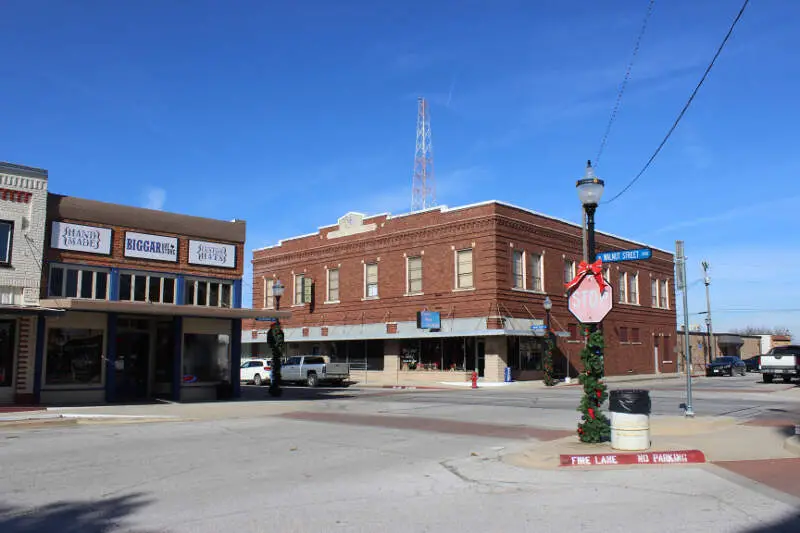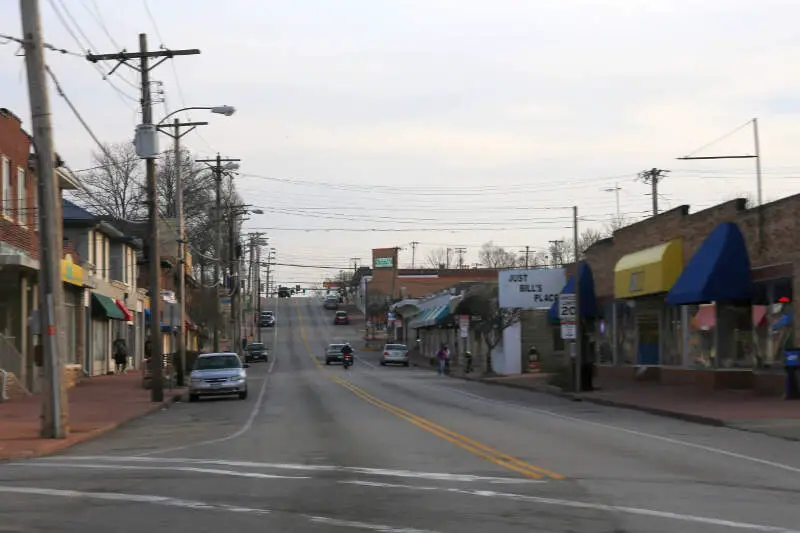
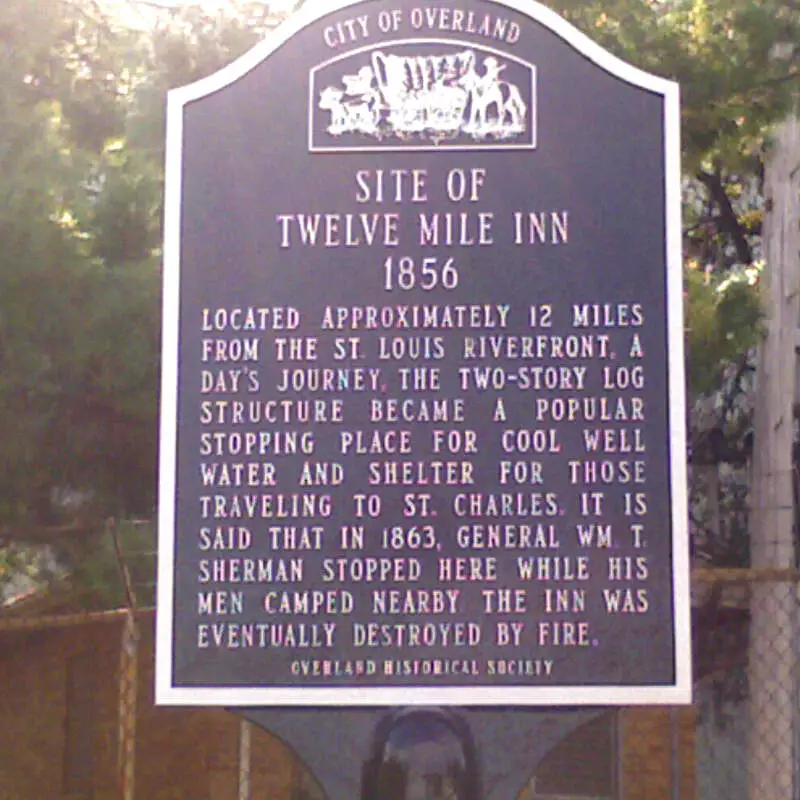
Laredo vs. Overland in photos
A side-by-side look at each city.




Cost of living
Overland is the cheaper city overall — 6% higher in Laredo than its rival. Index baseline: 100 = national average.
| Living expense | Laredo | Overland | US average |
|---|---|---|---|
| Overall | 94 | 89 | 100 |
| Services | 101 | 100 | 100 |
| Groceries | 99 | 99 | 100 |
| Health | 78 | 69 | 100 |
| Housing | 99 | 96 | 100 |
| Transportation | 100 | 94 | 100 |
| Utilities | 96 | 100 | 100 |
Lower index = cheaper. 100 = U.S. national average. Bar inside each cell scales relative to the highest value in the table.
Sources: HomeSnacks Cost of Living indices, normalized so 100 = U.S. national average. Drill in: Laredo cost of living, Overland cost of living, or the cheapest cities in America.
Housing breakdown
Home prices are higher in Laredo. Compare absolute price and price-to-income — a $500k home in a $100k-income city is very different from one in a $50k-income city.
| Metric | Laredo | Overland | United States |
|---|---|---|---|
| Median Home Value | $220,330 | $150,450 | $332,700 |
| Median Rent | $1,030 | $1,112 | $1,413 |
| Median Income | $63,915 | $61,773 | $80,734 |
| Home Value To Income | 3.4x | 2.4x | 4.1x |
| Rent To Monthly Income | 0.19x | 0.22x | 0.21x |
Source: U.S. Census Bureau ACS 2020-2024. See also states with the highest rent in America.
Crime
Laredo is the safer city — total crime rate of 1,831 per 100k people vs 2,709 for Overland. US average: 2,119.
| Crime (per 100k) | Laredo | Overland | US average |
|---|---|---|---|
| Total crime | 1,831 | 2,709 | 2,119 |
| Murder | 2 | 20 | 5 |
| Robbery | 49 | 78 | 61 |
| Aggravated Assault | 267 | 423 | 256 |
| Violent Crime | 366 | 527 | 359 |
| Burglary | 199 | 130 | 229 |
| Larceny | 1,101 | 1,556 | 1,272 |
| Car Theft | 165 | 495 | 259 |
| Property Crime | 1,465 | 2,181 | 1,760 |
Lower = safer. Bar inside each cell scales relative to the highest crime rate in the table.
Source: FBI Uniform Crime Reporting (2024). All rates are per 100,000 people. City pages: Laredo crime, Overland crime. See also: safest cities in America.
Diversity
Overland is more racially diverse — lower HHI (closer to 0) means a more even mix across groups.
| Group | Laredo | Overland | United States |
|---|---|---|---|
| White | 3.4% | 49.0% | 57.4% |
| African American | 0.5% | 27.0% | 11.9% |
| American Indian | 0.0% | 0.1% | 0.5% |
| Asian | 0.5% | 1.9% | 5.9% |
| Hawaiian | 0.0% | 0.0% | 0.2% |
| Other | 0.2% | 1.7% | 0.6% |
| Two Or More | 0.2% | 4.9% | 4.3% |
| Hispanic | 95.1% | 15.3% | 19.3% |
Source: U.S. Census ACS 2020-2024. Lower HHI = more even racial mix. See also: most diverse cities in America.
SnackAbility — overall quality of life
Laredo and Overland tied at 5/10.
Scores are 0–10; both bars share the same scale.
SnackAbility is a HomeSnacks proprietary 1–10 score blending jobs, housing, education, commute, amenities, affordability, crime, and diversity. Median U.S. city ≈ 7. Data: Census, BLS, FBI. See also: best places to live in America.
Bottom line: which city is right for you?
Based on the head-to-head data above, here's the short version — pick the city that lines up with what you actually care about.
Choose Laredo if you prioritize…
- lower crime — a safer place to live, work, and raise a family.
- more affordable housing relative to Overland.
Choose Overland if you prioritize…
- a lower cost of living (cheaper groceries, services, and day-to-day expenses).
- a more racially diverse community (lower HHI on Census data).
Methodology: winners are picked from public data — U.S. Census Bureau ACS (income, home value, rent, race/HHI), FBI Uniform Crime Reporting (crime rates per 100k), and HomeSnacks' proprietary SnackAbility quality-of-life score, which blends Bureau of Labor Statistics data with the above.