Most Asian cities in Hawaii research summary. We analyzed Hawaii’s most recent Census data to determine the most Asian cities in Hawaii based on the percentage of Asian residents.
69.6% Asian · #1 most Asian in Hawaii
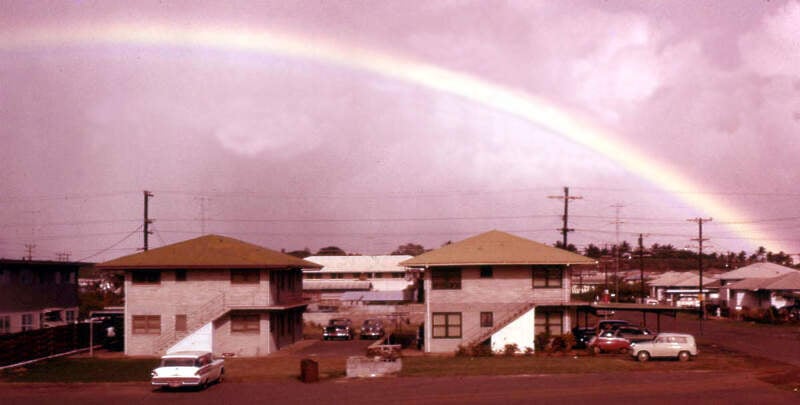
Waipahu is a former sugarcane plantation town and now census-designated place located in the Ewa District on the island of Oahu in the City & County of Honolulu, Hawaii, United States. As of the 2010 Census, the CDP population was 38,216. The U.S. postal code for Waipahu is 96797.
Data | Crime | Cost of living | Movers

63.8% Asian · #2 most Asian in Hawaii
Data | Crime | Cost of living | Movers
60.6% Asian · #3 most Asian in Hawaii
Data | Crime | Cost of living | Movers
57.0% Asian · #4 most Asian in Hawaii
Waipio is a census-designated place located in the Ewa District of the island of Oahu in the City & County of Honolulu, Hawaii, United States. In Hawaiian, wai pio means “curved water”. As of the 2010 census, the CDP had a population of 11,674.
Data | Crime | Cost of living | Movers
55.9% Asian · #5 most Asian in Hawaii
Data | Crime | Cost of living | Movers
55.4% Asian · #6 most Asian in Hawaii
Data | Crime | Cost of living | Movers
54.8% Asian · #7 most Asian in Hawaii
Data | Crime | Cost of living | Movers
54.7% Asian · #8 most Asian in Hawaii
Aiea is a census-designated place located in the City and County of Honolulu, Hawaii, United States. As of the 2010 Census, the CDP had a total population of 9,338.
Data | Crime | Cost of living | Movers
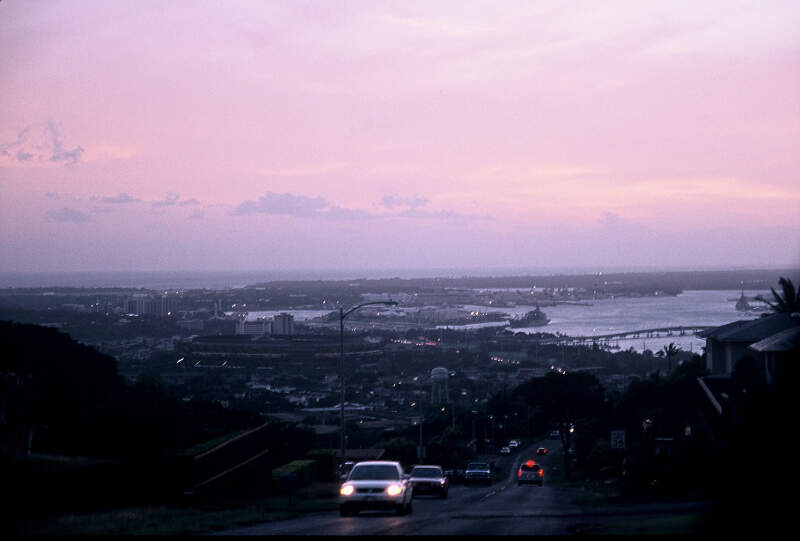
54.5% Asian · #9 most Asian in Hawaii
Pearl City is an unincorporated community and census-designated place located in the Ewa District and City & County of Honolulu on the Island of Oahu. As of the 2010 Census, the CDP had a total population of 47,698. Pearl City is located along the north shore of Pearl Harbor. Aiea borders Pearl City to the east, while Waipahu borders the west. The U.S. postal code for Pearl City is 96782.
Data | Crime | Cost of living | Movers
51.9% Asian · #10 most Asian in Hawaii
Data | Crime | Cost of living | Movers
The receipts
Compare the top ten
Pick a metric. The bars rescale. The red line is Hawaii’s statewide median.
On the map
Where Hawaii’s Asian communities live
Saturday Night Science
Methodology: How We Determined The Cities In Hawaii With The Largest Asian Population For 2026
We used Saturday Night Science to compare Census data on race across every place in Hawaii.
The Census’s most recently available data comes from the 2020-2024 American Community Survey.
Specifically, we looked at table B03002: Hispanic OR LATINO ORIGIN BY RACE. Here are the category names as defined by the Census:
- Hispanic or Latino
- White alone*
- Black or African American alone*
- American Indian and Alaska Native alone*
- Asian alone*
- Native Hawaiian and Other Pacific Islander alone*
- Some other race alone*
- Two or more races*
Our particular column of interest here was the number of people who identified as Asian alone.
We limited our analysis to cities with a population greater than 5,000 people. That left us with 51 cities.
We then calculated the percentage of residents that are Asian. The percentages ranked from 69.6% to 4.4%.
Finally, we ranked each city based on the percentage of Asian population, with a higher percentage being more Asian. Waipahu took the distinction of being the most Asian, while Hickam Housing was the least Asian city.
We updated this article for 2026. This report reflects our eleventh time ranking the cities in Hawaii with the largest Asian population.
The full plate
Cities In Hawaii By Asian Population
Click any column to sort. Search by city name.
| Rank | City | Population | Asian Population | % Asian |
|---|---|---|---|---|
| 1 | Waipahu | 40,482 | 28,176 | 69.6% |
| 2 | Ewa Villages | 7,415 | 4,731 | 63.8% |
| 3 | Waikele | 7,528 | 4,559 | 60.6% |
| 4 | Waipio | 10,870 | 6,197 | 57.0% |
| 5 | Royal Kunia | 13,555 | 7,582 | 55.9% |
| 6 | Kahului | 28,288 | 15,671 | 55.4% |
| 7 | Waimalu | 13,061 | 7,161 | 54.8% |
| 8 | Aiea | 9,087 | 4,968 | 54.7% |
| 9 | Pearl City | 44,547 | 24,289 | 54.5% |
| 10 | Ewa Beach | 14,376 | 7,465 | 51.9% |
| 11 | Urban Honolulu | 345,482 | 178,934 | 51.8% |
| 12 | Halawa | 14,385 | 7,403 | 51.5% |
| 13 | Mililani Mauka | 21,278 | 10,040 | 47.2% |
| 14 | East Honolulu | 51,360 | 24,028 | 46.8% |
| 15 | Ewa Gentry | 26,563 | 12,268 | 46.2% |
| 16 | Mililani Town | 27,668 | 12,475 | 45.1% |
| 17 | West Loch Estate | 5,544 | 2,497 | 45.0% |
| 18 | Lihue | 7,901 | 3,214 | 40.7% |
| 19 | Wahiawa | 17,996 | 7,225 | 40.1% |
| 20 | Lahaina | 10,162 | 4,070 | 40.1% |
| 21 | Waipio Acres | 5,332 | 2,101 | 39.4% |
| 22 | Waihee-Waiehu | 10,988 | 4,222 | 38.4% |
| 23 | Kaneohe | 37,355 | 14,039 | 37.6% |
| 24 | Kapaa | 11,094 | 3,794 | 34.2% |
| 25 | Hilo | 50,404 | 17,232 | 34.2% |
| 26 | Wailuku | 16,926 | 5,657 | 33.4% |
| 27 | Ocean Pointe | 17,085 | 5,405 | 31.6% |
| 28 | Ahuimanu | 8,452 | 2,620 | 31.0% |
| 29 | Makakilo | 20,735 | 5,709 | 27.5% |
| 30 | Kapolei | 22,232 | 5,822 | 26.2% |
| 31 | Wailua Homesteads | 5,431 | 1,310 | 24.1% |
| 32 | Napili-Honokowai | 7,308 | 1,570 | 21.5% |
| 33 | Kihei | 21,567 | 4,565 | 21.2% |
| 34 | Kailua CDP (Hawaii County) | 21,818 | 4,150 | 19.0% |
| 35 | Pukalani | 8,679 | 1,626 | 18.7% |
| 36 | Kailua CDP (Honolulu County) | 39,640 | 7,413 | 18.7% |
| 37 | Waimea CDP (Hawaii County) | 9,286 | 1,668 | 18.0% |
| 38 | Makawao | 7,353 | 1,281 | 17.4% |
| 39 | Hawaiian Paradise Park | 13,203 | 1,993 | 15.1% |
| 40 | Laie | 5,699 | 826 | 14.5% |
| 41 | Kula | 6,791 | 948 | 14.0% |
| 42 | Maili | 11,570 | 1,520 | 13.1% |
| 43 | Waimanalo | 6,054 | 792 | 13.1% |
| 44 | Waikoloa Village | 7,543 | 810 | 10.7% |
| 45 | Wailea | 6,352 | 633 | 10.0% |
| 46 | Makaha | 10,066 | 889 | 8.8% |
| 47 | Waianae | 12,918 | 1,112 | 8.6% |
| 48 | Haiku-Pauwela | 9,178 | 504 | 5.5% |
| 49 | Nanakuli | 12,383 | 635 | 5.1% |
| 50 | Schofield Barracks | 16,270 | 807 | 5.0% |
| 51 | Hickam Housing | 9,425 | 415 | 4.4% |
Source: U.S. Census ACS 2020-2024. 51 cities with more than 5,000 residents.
Summary
Summary: Asian Populations Across Hawaii
If you’re looking for a breakdown of Asian populations across Hawaii according to the most recent data, this is an accurate list.
The most Asian cities in Hawaii are Waipahu, Ewa Villages, Waikele, Waipio, Royal Kunia, Kahului, Waimalu, Aiea, Pearl City, and Ewa Beach. Not sold on Hawaii? Take the two-minute Find Your Place quiz and see which state actually fits you.
Questions and answers
Most Asian Cities In Hawaii FAQs
What is the most Asian city in Hawaii?
Waipahu is the most Asian city in Hawaii for 2026, at 69.6% of residents. Ewa Villages and Waikele are next.
What cities in Hawaii have the largest Asian population?
The Hawaii cities with the largest Asian population shares are Waipahu, Ewa Villages, Waikele, Waipio, Royal Kunia, Kahului, Waimalu, Aiea, Pearl City, and Ewa Beach. We ranked all 51 places with more than 5,000 residents.
What percent of Waipahu is Asian?
Asian residents make up 69.6% of Waipahu, the highest share of the 51 Hawaii places we measured. The numbers come from the Census Bureau’s American Community Survey.
What is the least Asian city in Hawaii?
Hickam Housing is the least Asian city in Hawaii, at 4.4%. It sits at the opposite end of the same ranking.
Where does this data come from?
Every share is calculated from the Census Bureau’s American Community Survey (2020-2024), based on residents identifying as Asian alone. We rank each Hawaii place with more than 5,000 residents.


