
Most Asian cities in the United States research summary. We used Saturday Night Science to research the cities with the highest percentage of Asian residents for 2026. The data comes from the American Community Survey 2020-2024 vintage, which breaks down race by origin.
The city with the highest percentage of Asian Americans is Fremont, CA. 63.67% of people in Fremont, CA are Asian.
The city with the lowest percentage of Asian Americans is Miami Gardens, FL. 0.23% of people in Miami Gardens, FL are Asian.
The city with the most Asian Americans is New York, NY. 1,240,270 people in New York, NY are Asian.
The city with the fewest Asian Americans is Miami Gardens, FL. 256 people in Miami Gardens, FL are Asian.
The United States has 19,678,814 Asian Americans and is 5.88% Asian.
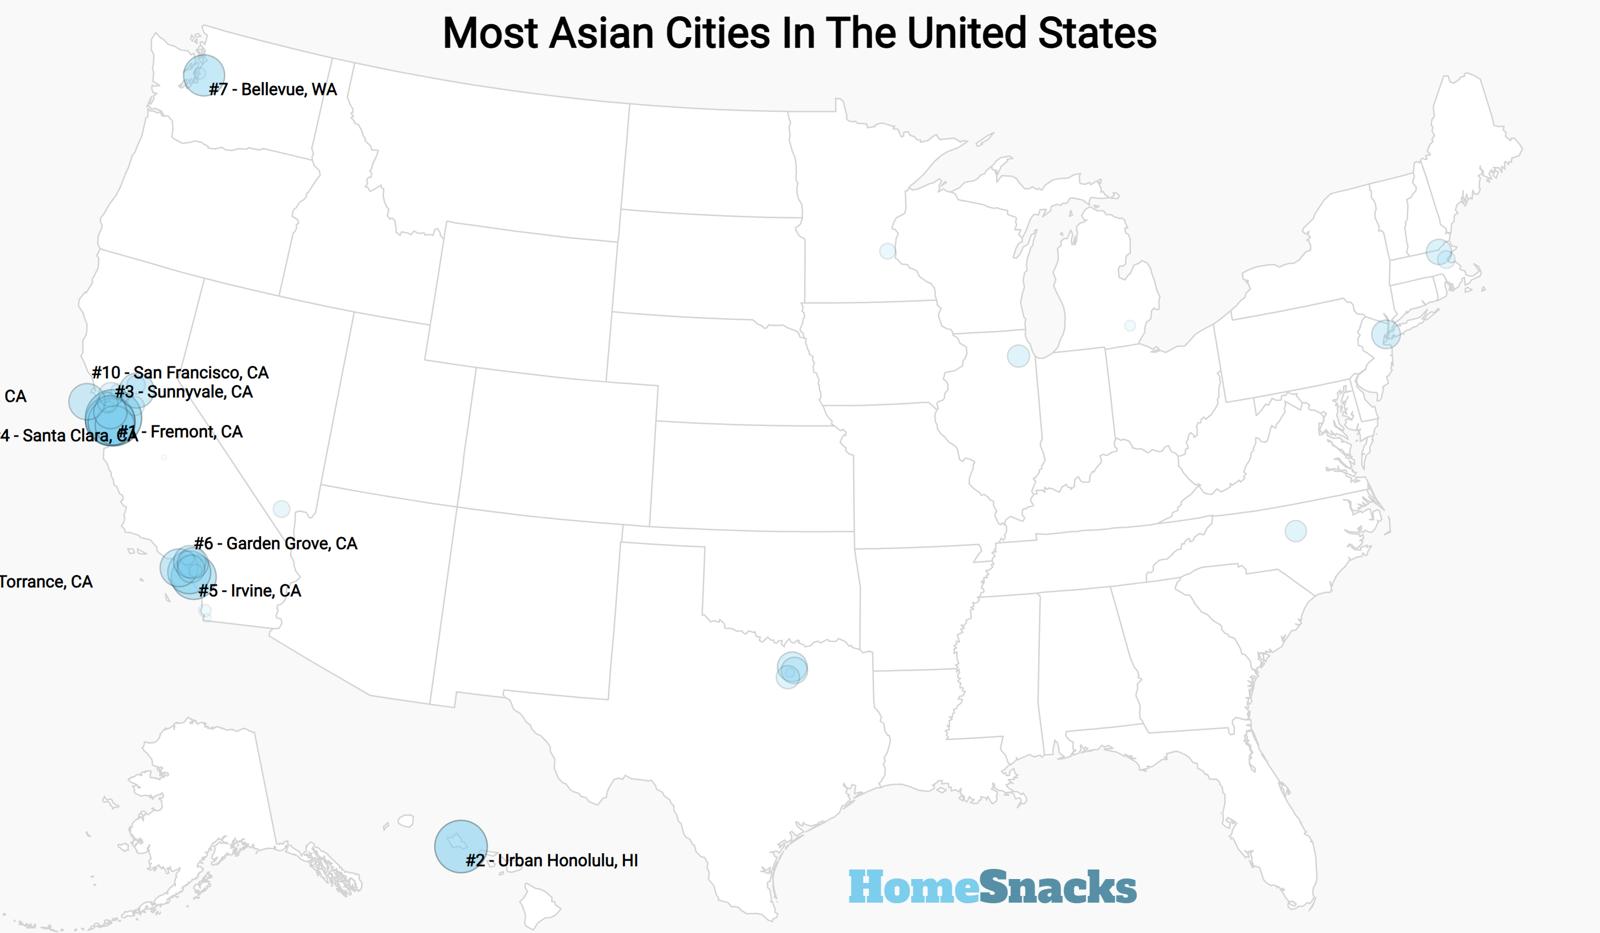
Table Of Contents: Top Ten | Methodology | Summary | Table
These are just two cities I think about when I consider large cities with bustling Asian populations. Not to mention some of the best Thai and Japanese food I’ve had.
But what city in America has the largest percentage of Asian Americans? Well, that’s the question we will answer for you today.
It turns out my intuition was correct, as San Francisco appears in the top ten. And a majority of the top ten are in California, according to the most recent Census data.
But the number one spot was a surprise to us.
The 10 Cities In The United States With The Largest Asian Population
What’s the big city in America with the largest percentage of Asians, according to the data? Per the most recent ACS data, the city in America with the largest Asian population is Fremont, CA, .
There has been a slow and steady increase in the Asian population across America over the past several decades.
Starting on the coasts and moving inland, Asian Americans have found homes in every city and town in America. Now, according to the most recent Census data, % of people living in the US are Asian, which is up from 2010.
Or if you’re ready to move on to another ranking of American cities and states, check out:
The 10 Cities In The US With The Largest Asian Population For 2026

/10
Population: 228,295
Percent Asian American: 63.7%
Percent Asian American 2010: 49.0%
Percent Change: 41.7%
More on Fremont: Data | Crime | Cost Of Living | Real Estate
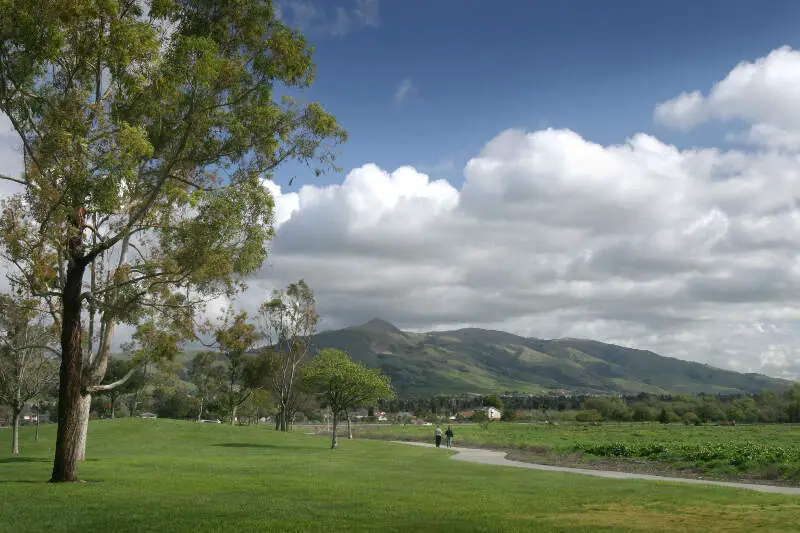
Fremont ranks as the city with the largest percentage of its population that is Asian according to the most recent Census data.
With over 57% of the population being of Asian descent, Fremont was a solid four percentage points ahead of the closest city in Honolulu. Futhermore, it’s become more Asian over the past several years — 24% more in fact.
Fremont is located outside of San Jose and San Francisco, across the Bay.

/10
Population: 345,482
Percent Asian American: 51.8%
Percent Asian American 2010: 56.1%
Percent Change: -3.5%
More on Urban Honolulu: Data | Real Estate
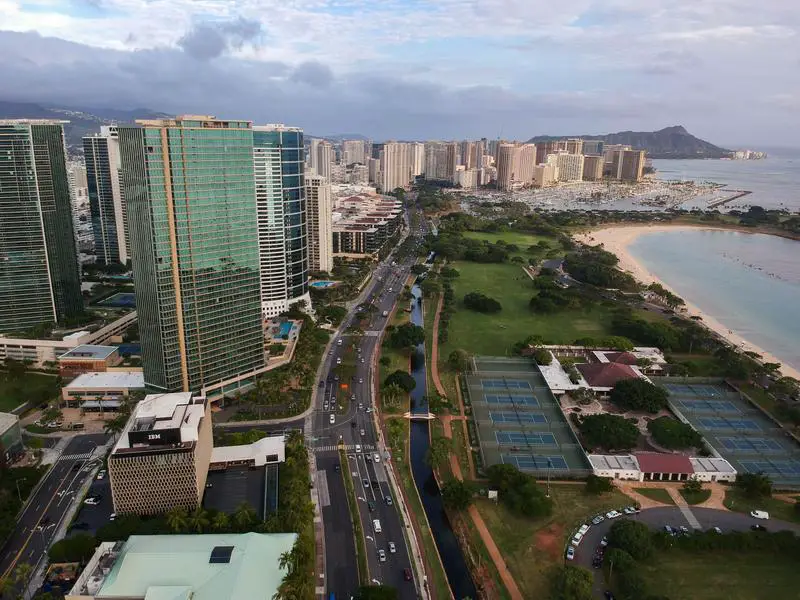
The second most Asian city in America is Honolulu — the only other big city in the US that has greater than 50% Asian population.
Honolulu is incredibly diverse overall as a large percentage of its residents also identify as Hawaiian, which makes sense. It also makes sense that it would have such a large portion of its residents be Asian since it’s so close to Asia.

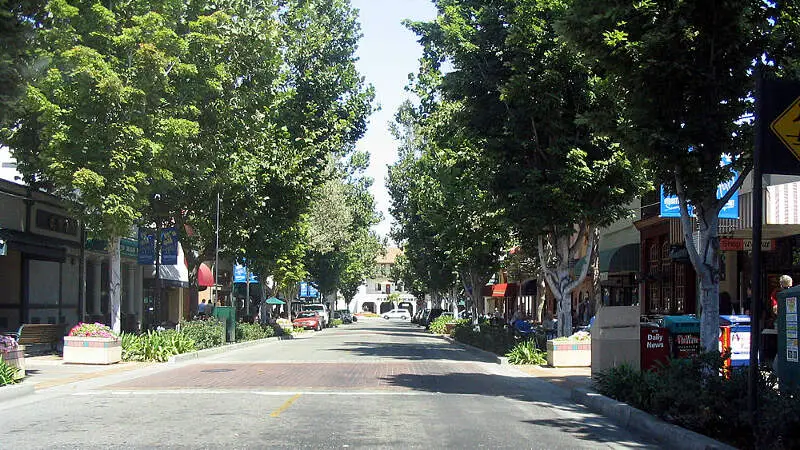
/10
Population: 130,256
Percent Asian American: 50.2%
Percent Asian American 2010: 37.3%
Percent Change: 56.0%
More on Santa Clara: Data | Crime | Cost Of Living | Real Estate
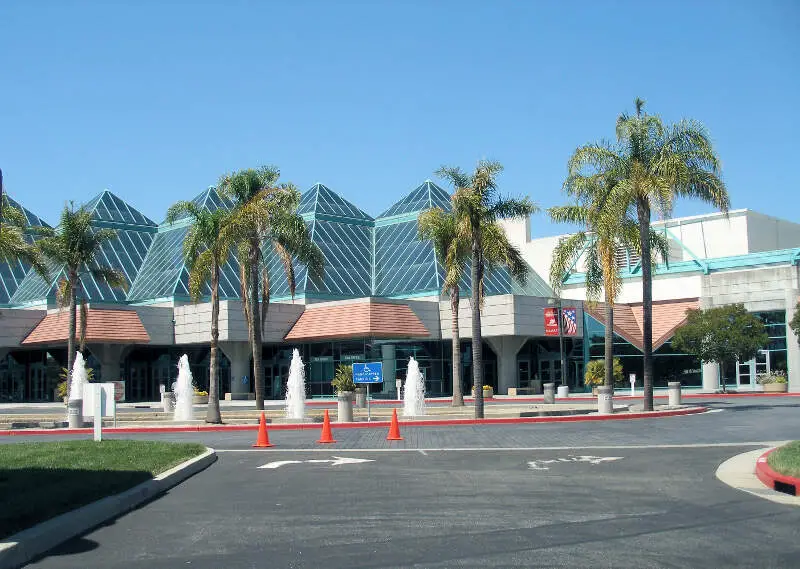
Jumping back up to Nor Cal, we arrive in Santa Clara. In keep with the trend of these cities, it’s about 41% Asian and becoming more so every year.
Santa Clara is located south of San Jose on the California coast.

/10
Population: 154,236
Percent Asian American: 49.4%
Percent Asian American 2010: 39.8%
Percent Change: 40.2%
More on Sunnyvale: Data | Crime | Cost Of Living | Real Estate
Another Nor Cal city in the Silicon Valley area, Sunnyvale ranks as the third most Asian city in America.
The city has become 25% more Asian this decade and now a solid 44% of the residents are Asian.

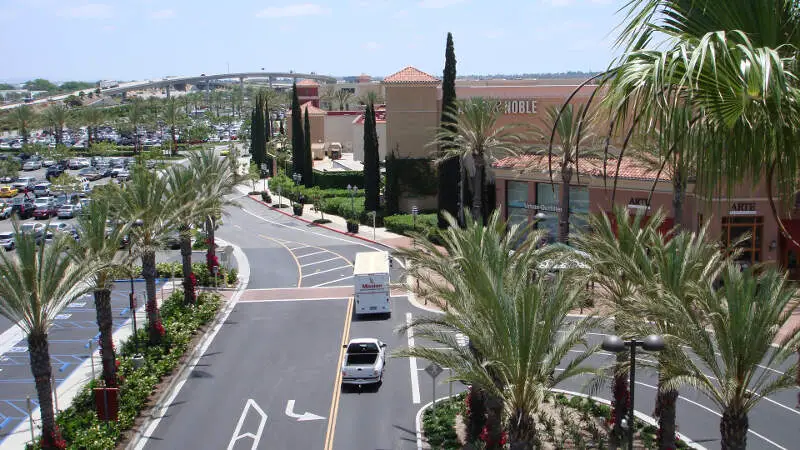
/10
Population: 311,690
Percent Asian American: 44.6%
Percent Asian American 2010: 37.8%
Percent Change: 84.5%
More on Irvine: Data | Crime | Cost Of Living | Real Estate
The first city from So Cal, Irvine ranks as the city with the fourth highest Asian population.
Over 40% of the population is Asian in this Los Angeles suburb. Filipino and Korean communities in particular have been growing in recent years.

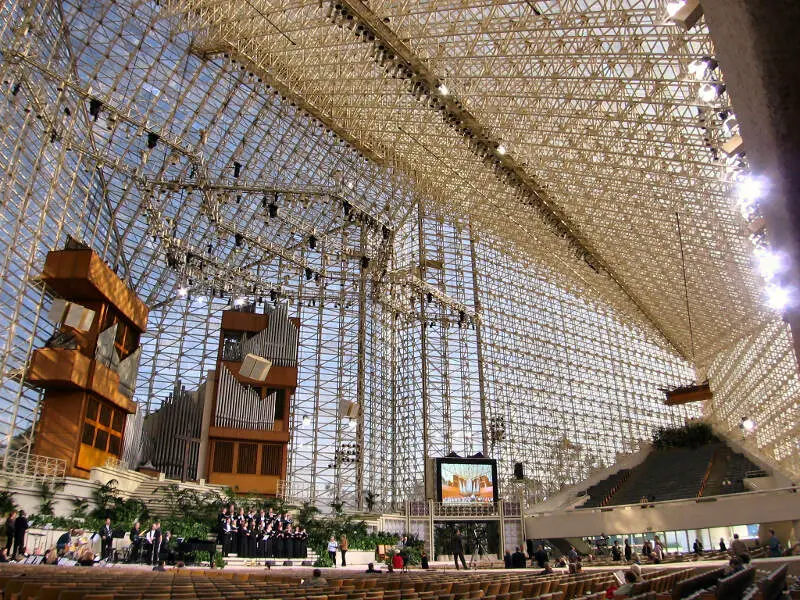
/10
Population: 170,964
Percent Asian American: 42.7%
Percent Asian American 2010: 35.7%
Percent Change: 21.2%
More on Garden Grove: Data | Crime | Cost Of Living | Real Estate
Hopping on the 5 back down to So Cal, we’ll stop at Garden Grove.
The city is the first under 40% Asian on the list. It too has become more Asian this decade, just a bit slower than the cities ahead of it.

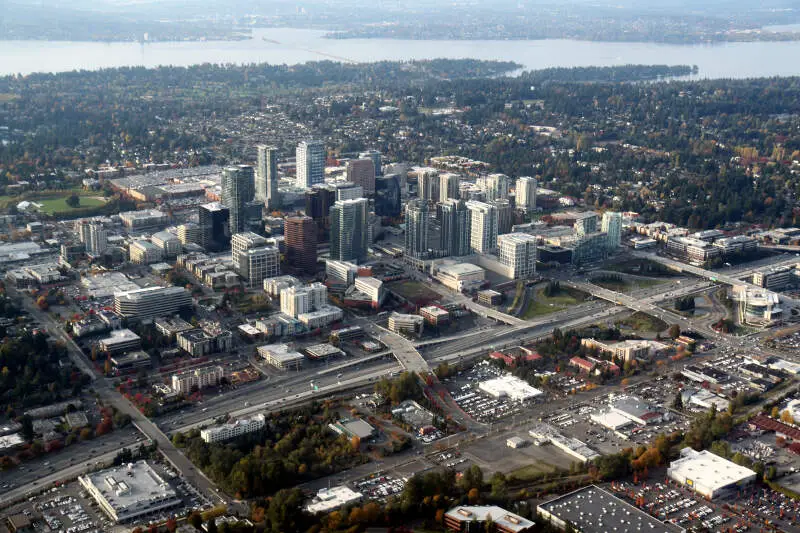
/10
Population: 151,847
Percent Asian American: 42.7%
Percent Asian American 2010: 25.8%
Percent Change: 110.2%
More on Bellevue: Data | Crime | Cost Of Living | Real Estate
Rounding out the top 10 most Asian cities in the US is Bellevue, WA.
Yet another West Coast city, it’s nice not to be in California any more. Further up the coast, this major Washington city has just over 33% Asian residents.

/10
Population: 990,138
Percent Asian American: 39.2%
Percent Asian American 2010: 31.6%
Percent Change: 32.8%
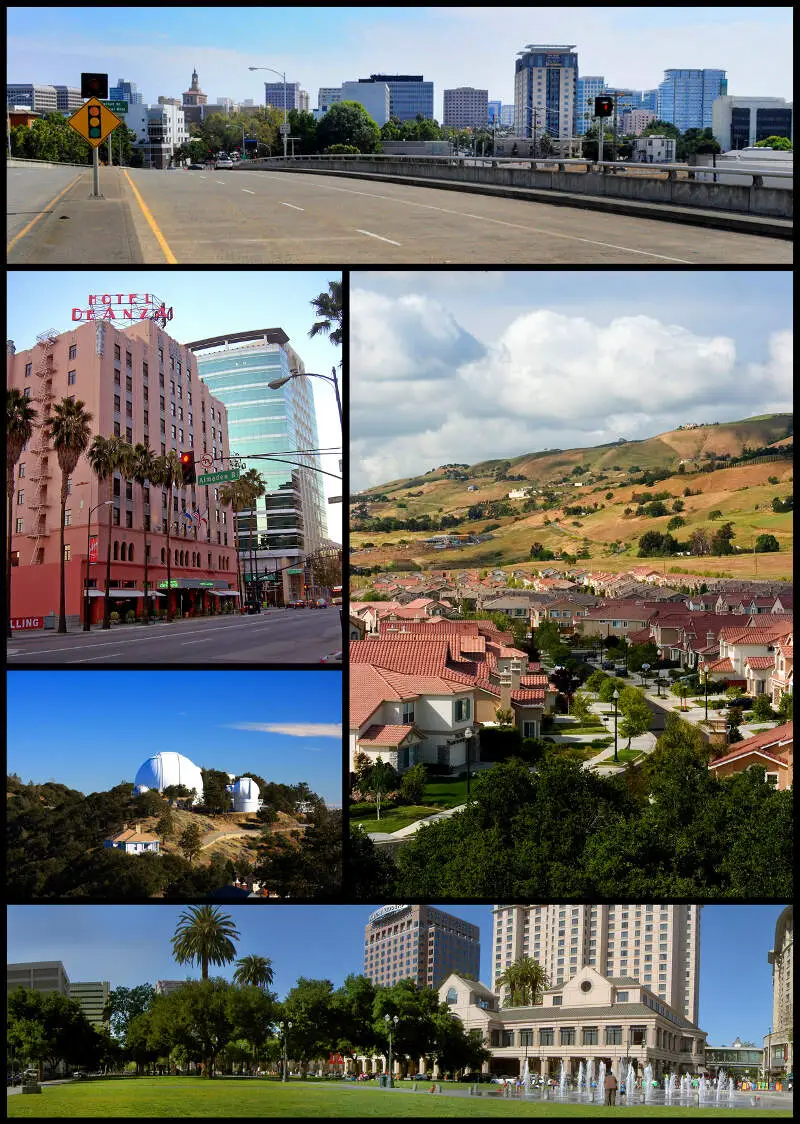
More on San Jose: Data | Crime | Cost Of Living | Real Estate
Next on the list we drive back up to Nor Cal for the next two cities on the list that just so happen to be some of the biggest in California.
First, we’ll stop in San Jose. The city is over 34% Asian and increasing.

/10
Population: 142,130
Percent Asian American: 37.0%
Percent Asian American 2010: 34.6%
Percent Change: 5.5%
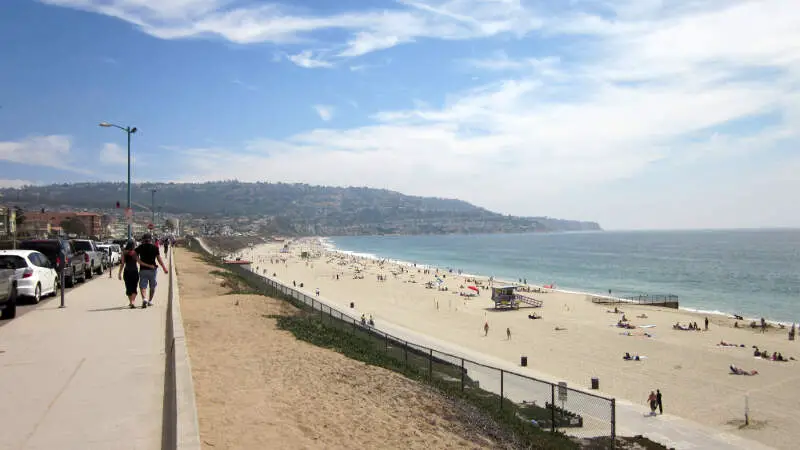
More on Torrance: Data | Crime | Cost Of Living | Real Estate
Right outside of Garden Grove is Torrance, the ninth most Asian city in America.
Much like every other city here, Torrance is a great place to live that has become progressively more Asian over the years.

/10
Population: 830,235
Percent Asian American: 34.9%
Percent Asian American 2010: 33.4%
Percent Change: 10.2%
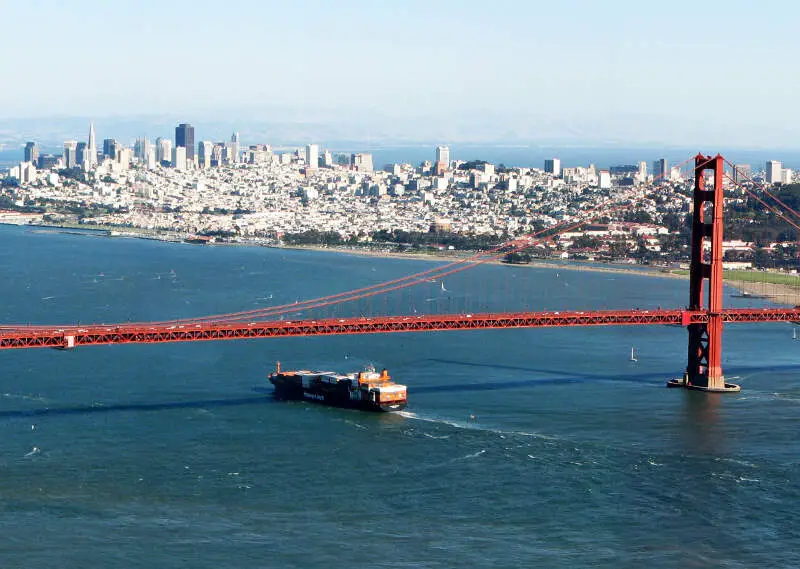
More on San Francisco: Data | Crime | Cost Of Living | Real Estate
Ahh San Francisco, we figured you’d be here.
Turns out San Francisco is pretty Asian, but not the most Asian according to the data. About a third of the city is Asian per the most recent data.
Methodology: How We Determined The Most Asian Large Cities in The US
When we analyze what it’s like to live in a particular city, we look at statistics. In particular, we can use Saturday Night Science to look at the recently released 2020-2024 American Community Survey for a detailed breakdown of race by city.
Specifically, we looked at table B03002, which has the breakdown of people by Hispanic/Latino and race.
Limiting our analysis to only cities greater than 100,000 people, we looked at the percentage of the population of each city that identified as non-Hispanic/Latino, or Asian.
We then ranked each city from 1 to 270 in terms of that percentage, with the city having the highest overall percentage being named the “City In America with the Largest Asian American population” — Fremont, CA, . We updated this article for 2026. This article is our eleventh time ranking the cities in America with the highest Asian population.
The “least Asian American” city according to the data? That would be Miami Gardens, FL, < which is only 0.2% Asian American as of the latest data.
Summary: The Most Asian Cities in America For 2026
There you have it, the cities in America with the largest Asian population for 2026 with Fremont, CA taking the top spot.
The most Asian cities in the United States are Fremont, CA, Urban Honolulu, HI, Santa Clara, CA, Sunnyvale, CA, Irvine, CA, Garden Grove, CA, Bellevue, WA, San Jose, CA, Torrance, CA, and San Francisco, CA.
We expect the Asian population in America to keep increasing in the coming years. So it won’t surprise you or us if these percentages get bigger next year.
And for now, we’re off to get some Chinese food for dinner. Yum.
Here’s a look at the poorest cities in America:
- Miami Gardens, FL
- Jackson, MS
- Hialeah, FL
For more reading, check out:
Asian Population By Major City In The United States For 2026
| Rank | City | Population | Asian Population | % Asian |
|---|---|---|---|---|
| 1 | Fremont, CA | 228,295 | 145,362 | 63.7% |
| 2 | Urban Honolulu, HI | 345,482 | 178,934 | 51.8% |
| 3 | Santa Clara, CA | 130,256 | 65,424 | 50.2% |
| 4 | Sunnyvale, CA | 154,236 | 76,137 | 49.4% |
| 5 | Irvine, CA | 311,690 | 139,049 | 44.6% |
| 6 | Garden Grove, CA | 170,964 | 73,009 | 42.7% |
| 7 | Bellevue, WA | 151,847 | 64,808 | 42.7% |
| 8 | San Jose, CA | 990,138 | 388,267 | 39.2% |
| 9 | Torrance, CA | 142,130 | 52,585 | 37.0% |
| 10 | San Francisco, CA | 830,235 | 290,030 | 34.9% |
| 11 | Elk Grove, CA | 179,155 | 55,538 | 31.0% |
| 12 | West Covina, CA | 107,037 | 32,890 | 30.7% |
| 13 | Hayward, CA | 158,801 | 47,633 | 30.0% |
| 14 | Frisco, TX | 219,304 | 61,526 | 28.1% |
| 15 | El Monte, CA | 106,109 | 29,024 | 27.4% |
| 16 | Jersey City, NJ | 294,078 | 77,831 | 26.5% |
| 17 | Fullerton, CA | 140,968 | 34,646 | 24.6% |
| 18 | Plano, TX | 290,594 | 68,596 | 23.6% |
| 19 | Irving, TX | 256,492 | 59,148 | 23.1% |
| 20 | Vallejo, CA | 124,268 | 28,197 | 22.7% |
| 21 | Naperville, IL | 150,692 | 33,649 | 22.3% |
| 22 | Lowell, MA | 118,368 | 26,021 | 22.0% |
| 23 | Spring Valley, NV | 219,187 | 46,309 | 21.1% |
| 24 | Stockton, CA | 322,326 | 66,946 | 20.8% |
| 25 | Berkeley, CA | 120,257 | 24,473 | 20.4% |
| 26 | Cary, NC | 179,306 | 36,439 | 20.3% |
| 27 | Cambridge, MA | 118,796 | 24,049 | 20.2% |
| 28 | Sacramento, CA | 528,706 | 106,143 | 20.1% |
| 29 | Anaheim, CA | 344,521 | 61,937 | 18.0% |
| 30 | Fairfield, CA | 120,785 | 21,565 | 17.9% |
| 31 | St. Paul, MN | 307,284 | 54,722 | 17.8% |
| 32 | Carrollton, TX | 133,740 | 23,673 | 17.7% |
| 33 | Seattle, WA | 754,195 | 131,815 | 17.5% |
| 34 | San Diego, CA | 1,389,526 | 240,003 | 17.3% |
| 35 | Pasadena, CA | 136,969 | 23,270 | 17.0% |
| 36 | Oakland, CA | 439,418 | 68,848 | 15.7% |
| 37 | Ann Arbor, MI | 122,036 | 18,992 | 15.6% |
| 38 | Rancho Cucamonga, CA | 175,411 | 26,332 | 15.0% |
| 39 | New York, NY | 8,483,844 | 1,240,270 | 14.6% |
| 40 | Mckinney, TX | 210,600 | 30,419 | 14.4% |
| 41 | Chula Vista, CA | 276,375 | 39,180 | 14.2% |
| 42 | Fresno, CA | 545,970 | 77,355 | 14.2% |
| 43 | Orange, CA | 138,266 | 19,090 | 13.8% |
| 44 | Concord, CA | 124,035 | 17,044 | 13.7% |
| 45 | Richmond, CA | 115,505 | 15,717 | 13.6% |
| 46 | Roseville, CA | 155,955 | 20,442 | 13.1% |
| 47 | Huntington Beach, CA | 195,240 | 25,320 | 13.0% |
| 48 | Glendale, CA | 190,748 | 24,369 | 12.8% |
| 49 | Long Beach, CA | 455,548 | 58,012 | 12.7% |
| 50 | Warren, MI | 137,928 | 17,521 | 12.7% |
| 51 | Santa Ana, CA | 312,534 | 38,460 | 12.3% |
| 52 | Aurora, IL | 179,898 | 21,890 | 12.2% |
| 53 | Santa Clarita, CA | 230,221 | 27,662 | 12.0% |
| 54 | Los Angeles, CA | 3,857,263 | 460,422 | 11.9% |
| 55 | Chandler, AZ | 280,136 | 32,774 | 11.7% |
| 56 | Corona, CA | 159,670 | 18,460 | 11.6% |
| 57 | Burbank, CA | 104,546 | 12,021 | 11.5% |
| 58 | Garland, TX | 246,844 | 27,989 | 11.3% |
| 59 | Paradise, NV | 185,913 | 19,843 | 10.7% |
| 60 | Pomona, CA | 147,943 | 15,678 | 10.6% |
| 61 | Arlington, VA | 236,254 | 24,753 | 10.5% |
| 62 | Simi Valley, CA | 125,634 | 12,888 | 10.3% |
| 63 | Boston, MA | 666,442 | 68,354 | 10.3% |
| 64 | Everett, WA | 111,845 | 11,232 | 10.0% |
| 65 | Anchorage, AK | 288,976 | 28,310 | 9.8% |
| 66 | Tempe, AZ | 188,065 | 18,166 | 9.7% |
| 67 | Ontario, CA | 180,547 | 17,309 | 9.6% |
| 68 | Henderson, NV | 332,141 | 31,618 | 9.5% |
| 69 | Tacoma, WA | 222,758 | 20,938 | 9.4% |
| 70 | Sterling Heights, MI | 133,573 | 12,337 | 9.2% |
| 71 | Overland Park, KS | 200,306 | 17,970 | 9.0% |
| 72 | Austin, TX | 979,539 | 87,686 | 9.0% |
| 73 | Buffalo, NY | 276,854 | 24,192 | 8.7% |
| 74 | Thousand Oaks, CA | 125,205 | 10,890 | 8.7% |
| 75 | Oceanside, CA | 172,242 | 14,188 | 8.2% |
| 76 | High Point, NC | 116,245 | 9,534 | 8.2% |
| 77 | Fontana, CA | 214,169 | 17,487 | 8.2% |
| 78 | Costa Mesa, CA | 110,330 | 8,954 | 8.1% |
| 79 | Riverside, CA | 319,069 | 25,564 | 8.0% |
| 80 | Madison, WI | 278,001 | 22,178 | 8.0% |
| 81 | Portland, OR | 641,165 | 51,090 | 8.0% |
| 82 | Escondido, CA | 149,668 | 11,840 | 7.9% |
| 83 | Philadelphia, PA | 1,579,706 | 124,921 | 7.9% |
| 84 | Bakersfield, CA | 411,986 | 32,043 | 7.8% |
| 85 | Rochester, MN | 122,330 | 9,498 | 7.8% |
| 86 | Modesto, CA | 219,215 | 16,079 | 7.3% |
| 87 | Arlington, TX | 397,742 | 29,158 | 7.3% |
| 88 | Stamford, CT | 137,144 | 10,009 | 7.3% |
| 89 | Downey, CA | 110,939 | 8,080 | 7.3% |
| 90 | Chicago, IL | 2,711,226 | 196,435 | 7.2% |
| 91 | Syracuse, NY | 146,384 | 10,582 | 7.2% |
| 92 | Worcester, MA | 207,055 | 14,815 | 7.2% |
| 93 | Virginia Beach, VA | 456,349 | 32,184 | 7.1% |
| 94 | North Las Vegas, NV | 278,595 | 19,588 | 7.0% |
| 95 | Las Vegas, NV | 660,400 | 46,204 | 7.0% |
| 96 | Grand Prairie, TX | 201,883 | 13,961 | 6.9% |
| 97 | Houston, TX | 2,328,253 | 160,136 | 6.9% |
| 98 | Reno, NV | 273,212 | 18,732 | 6.9% |
| 99 | Gilbert, AZ | 280,262 | 18,661 | 6.7% |
| 100 | Peoria, IL | 112,169 | 7,398 | 6.6% |
Asian Places By State
The 10 Alabama Cities With The Largest Asian Population For 2026
The 10 Alaska Cities With The Largest Asian Population For 2026
The 10 Arizona Cities With The Largest Asian Population For 2026
The 10 Arkansas Cities With The Largest Asian Population For 2026
The 10 California Cities With The Largest Asian Population For 2026
The 10 Colorado Cities With The Largest Asian Population For 2026
The 10 Connecticut Cities With The Largest Asian Population For 2026
The 10 Delaware Cities With The Largest Asian Population For 2026
The 10 Florida Cities With The Largest Asian Population For 2026
The 10 Georgia Cities With The Largest Asian Population For 2026
The 10 Hawaii Cities With The Largest Asian Population For 2026
The 10 Idaho Cities With The Largest Asian Population For 2026
The 10 Illinois Cities With The Largest Asian Population For 2026
The 10 Indiana Cities With The Largest Asian Population For 2026
The 10 Iowa Cities With The Largest Asian Population For 2026
The 10 Kansas Cities With The Largest Asian Population For 2026
The 10 Kentucky Cities With The Largest Asian Population For 2026
The 10 Louisiana Cities With The Largest Asian Population For 2026
The 10 Maine Cities With The Largest Asian Population For 2026
The 10 Maryland Cities With The Largest Asian Population For 2026
The 10 Massachusetts Cities With The Largest Asian Population For 2026
The 10 Michigan Cities With The Largest Asian Population For 2026
The 10 Minnesota Cities With The Largest Asian Population For 2026
The 10 Mississippi Cities With The Largest Asian Population For 2026
The 10 Missouri Cities With The Largest Asian Population For 2026
The 10 Montana Cities With The Largest Asian Population For 2026
The 10 Nebraska Cities With The Largest Asian Population For 2026
The 10 Nevada Cities With The Largest Asian Population For 2026
The 10 New Hampshire Cities With The Largest Asian Population For 2026
The 10 New Jersey Cities With The Largest Asian Population For 2026
The 10 New Mexico Cities With The Largest Asian Population For 2026
The 10 New York Cities With The Largest Asian Population For 2026
The 10 North Carolina Cities With The Largest Asian Population For 2026
The 10 North Dakota Cities With The Largest Asian Population For 2026
The 10 Ohio Cities With The Largest Asian Population For 2026
The 10 Oklahoma Cities With The Largest Asian Population For 2026
The 10 Oregon Cities With The Largest Asian Population For 2026
The 10 Pennsylvania Cities With The Largest Asian Population For 2026
The 10 Rhode Island Cities With The Largest Asian Population For 2026
The 10 South Carolina Cities With The Largest Asian Population For 2026
The 10 South Dakota Cities With The Largest Asian Population For 2026
The 10 Tennessee Cities With The Largest Asian Population For 2026
The 10 Texas Cities With The Largest Asian Population For 2026
The 10 Utah Cities With The Largest Asian Population For 2026
The 10 Vermont Cities With The Largest Asian Population For 2026
The 10 Virginia Cities With The Largest Asian Population For 2026
The 10 Washington Cities With The Largest Asian Population For 2026
The 10 West Virginia Cities With The Largest Asian Population For 2026
The 10 Wisconsin Cities With The Largest Asian Population For 2026
The 10 Wyoming Cities With The Largest Asian Population For 2026