Racial diversity in Nebraska is a mixed bag.
There are parts of Nebraska where there’s a high level of diversity. But where will you find the most diverse places in Nebraska?
To answer that question, we went to the US Census data. Using Saturday Night Science, we measured the Gini coefficient for all 32 cities in Nebraska to rank them from most to least diverse.
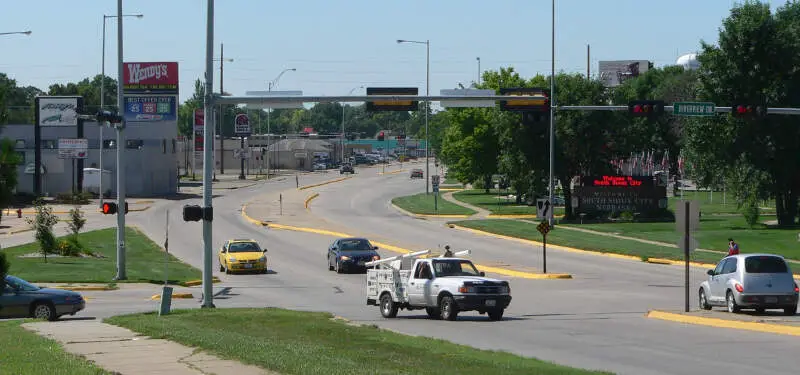
#1 most diverse in Nebraska
South Sioux City is a city in Dakota County, Nebraska, United States. It is located immediately across the Missouri River from Sioux City, Iowa, and is part of the Sioux City, IA-NE-SD Metropolitan Statistical Area. As of the 2010 census, the city population was 13,353, making it the 14th largest city in Nebraska.
Data | Crime | Cost of living | Movers
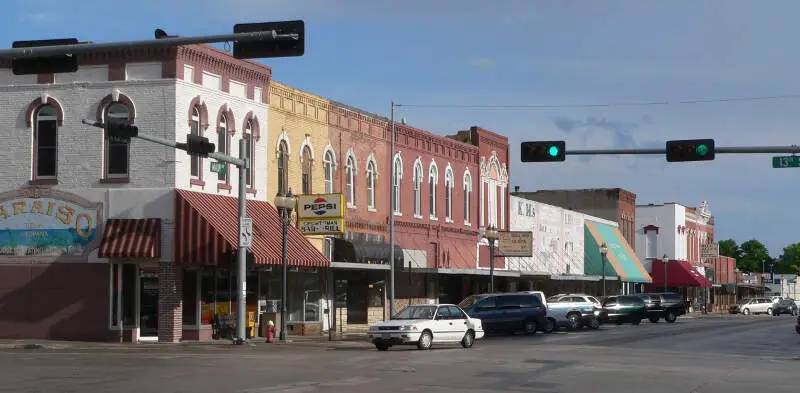
#2 most diverse in Nebraska
Crete is a city in Saline County, Nebraska, United States. The population was 6,960 at the 2010 census.
Data | Crime | Cost of living | Movers
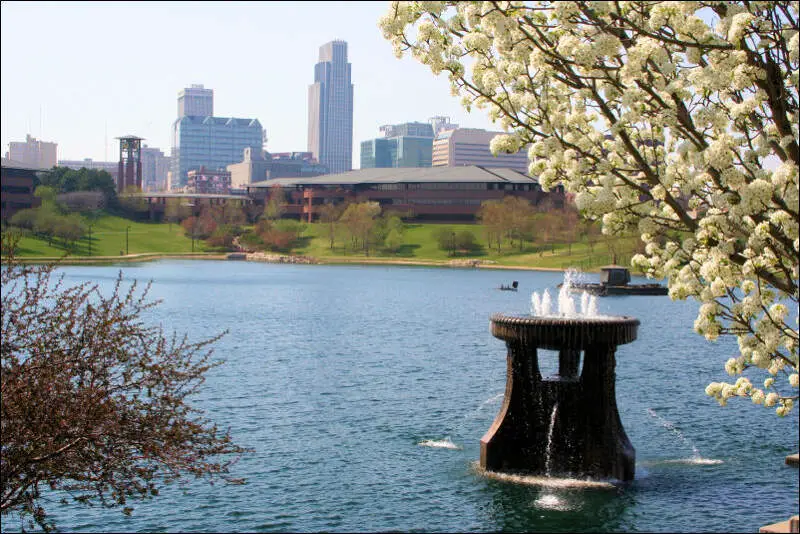
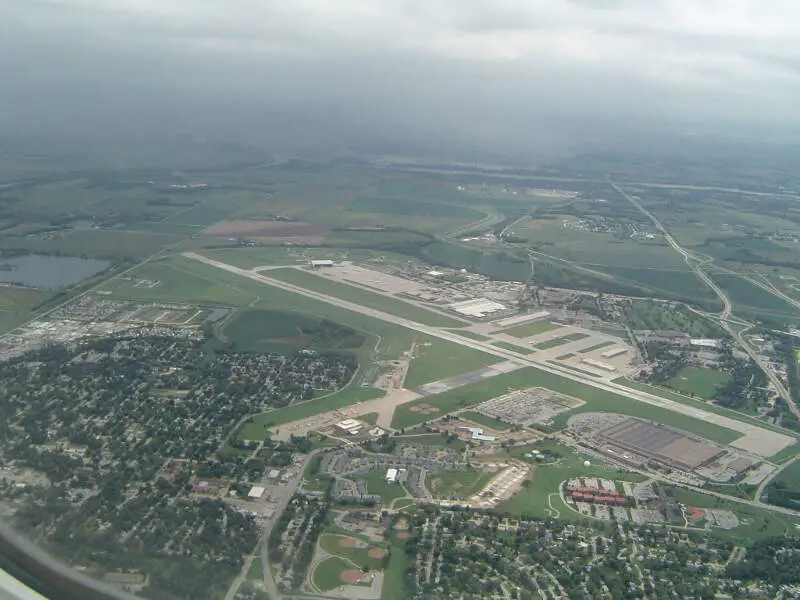
#3 most diverse in Nebraska
Omaha is the largest city in the state of Nebraska and the county seat of Douglas County. Omaha is located in the Midwestern United States on the Missouri River, about 10 miles north of the mouth of the Platte River. Omaha is the anchor of the Omaha-Council Bluffs metropolitan area, which includes Council Bluffs, Iowa, across the Missouri River from Omaha. According to the 2010 census, Omaha’s population was 408,958, making it the nation’s 44th-largest city; this had increased to 446,970 as of a 2016 estimate. Including its suburbs, Omaha formed the 60th-largest metropolitan area in the United States in 2013, with an estimated population of 895,151 residing in eight counties. The Omaha-Council Bluffs-Fremont, Nebraska-IA Combined Statistical Area is 931,667, according to the U.S. Census Bureau’s 2013 estimate. Nearly 1.3 million people reside within the Greater Omaha area, comprising a 50-mile radius of Downtown Omaha, the city’s center.
Data | Crime | Cost of living | Movers | Compare
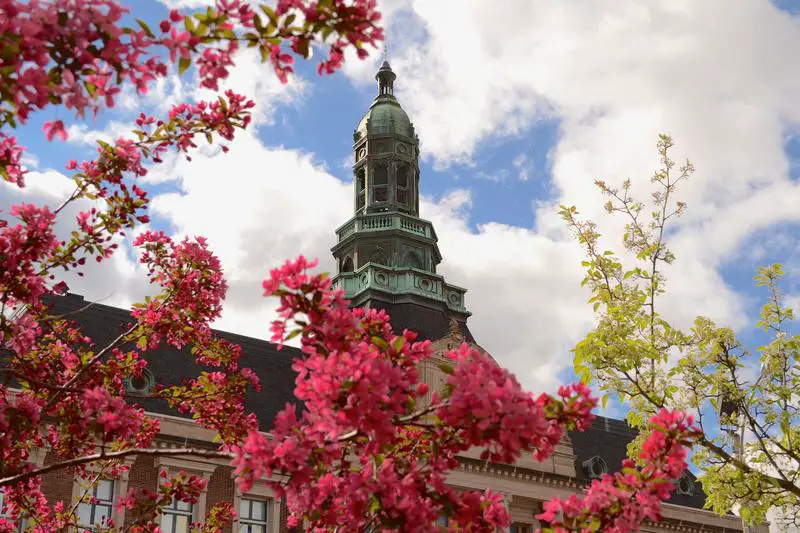
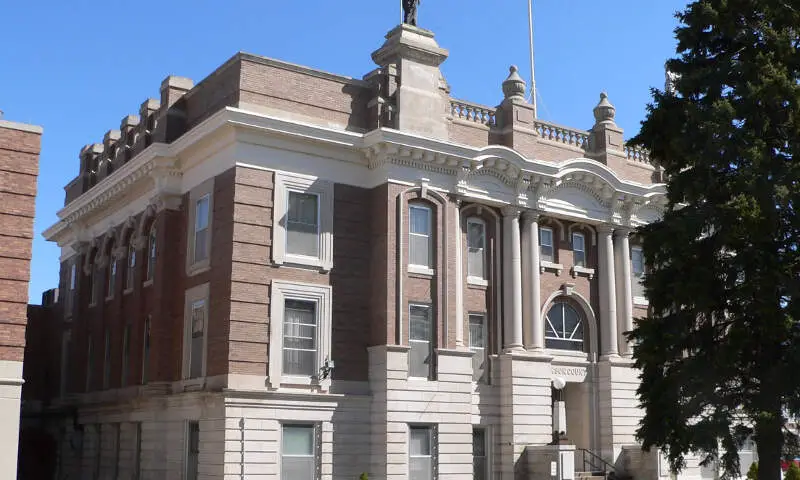
#4 most diverse in Nebraska
Grand Island is a city in and the county seat of Hall County, Nebraska, United States. The population was 48,520 at the 2010 census.
Data | Crime | Cost of living | Movers
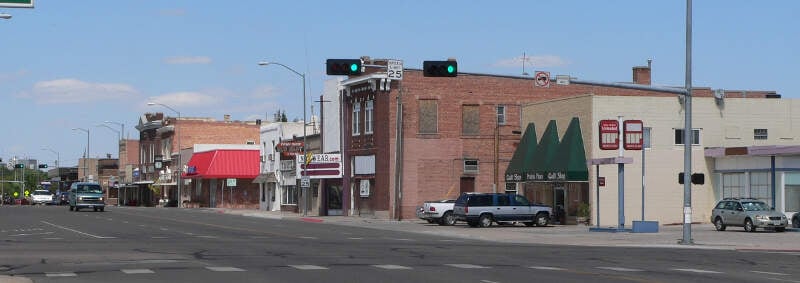
#5 most diverse in Nebraska
Lexington is a city in Dawson County, Nebraska, United States. The population was 10,230 at the 2010 census. It is the county seat of Dawson County. Lexington is located in southern Nebraska, on the Platte River, southeast of North Platte. It sits along the route of U.S. Route 30 and the Union Pacific Railroad. In the 1860s it was the location of a stop along the Pony Express.
Data | Crime | Cost of living | Movers
#6 most diverse in Nebraska
Data | Crime | Cost of living | Movers
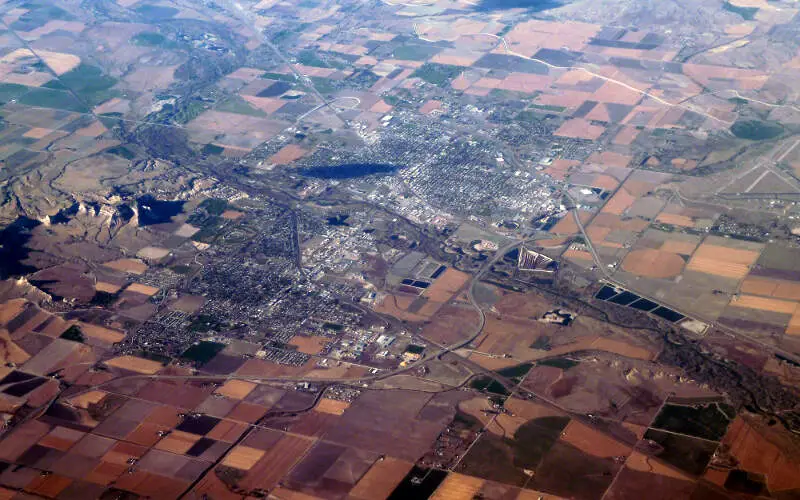
#7 most diverse in Nebraska
Scottsbluff is a city in Scotts Bluff County, in the western part of the state of Nebraska, in the Great Plains region of the United States. The population was 15,039 at the 2010 census. Scottsbluff is the largest city in the Nebraska Panhandle, and the 13th largest city in Nebraska.
Data | Crime | Cost of living | Movers
#8 most diverse in Nebraska
Gering is a city in Scotts Bluff County, Nebraska, United States. The population was 8,500 at the 2010 census. It is the county seat of Scotts Bluff County.
Data | Crime | Cost of living | Movers

#9 most diverse in Nebraska
Columbus is a city in and the county seat of Platte County, in the state of Nebraska in the Midwestern United States. The population was 22,111 at the 2010 census.
Data | Crime | Cost of living | Movers
#10 most diverse in Nebraska
Ralston is a city in Douglas County, Nebraska, United States. The population was 5,943 at the 2010 census. Ralston is surrounded on three sides by the city of Omaha, and by Sarpy County on the south side.
Data | Crime | Cost of living | Movers
The receipts
Compare the top ten
Pick a metric. The bars rescale. The red line is Nebraska’s statewide median.
On the map
Where diversity lives in Nebraska
Saturday Night Science
Methodology: How we determined the most diverse cities in Nebraska for 2026
We still believe in the accuracy of data — especially from the Census — and Saturday Night Science. So that’s where we went to get the race breakdown across Nebraska.
That leads us to the Census’s most recently available data, the 2020-2024 American Community Survey data from the US Census.
Specifically, we looked at table B03002: HISPANIC OR LATINO ORIGIN BY RACE. Here are the category names as defined by the Census:
- White alone*
- Black or African American alone*
- American Indian and Alaska Native alone*
- Asian alone*
- Native Hawaiian and Other Pacific Islander alone*
- Some other race alone*
- Two or more races*
- Hispanic or Latino
We limited our analysis to non-CDPs with a population greater than 5,000 people. That left us with 32 cities.
We then calculated the HHI for each city by finding the racial breakdown of a city in percent terms, squaring them, and then adding the squares together. This left us with scores ranging from 3,693 (South Sioux City) to 8,931 (Blair).
Finally, we ranked each city based on the HHI, with a lower score being more diverse than a high score. South Sioux City took the distinction of being the most diverse, while Blair was the least diverse city.
We updated this article for 2026. This report is our eleventh time ranking the most diverse places in Nebraska.
The full plate
Race By City In Nebraska For 2026
Click any column to sort. Search by city name.
| Rank | City | Population | HHI | % White | % Black | % Hispanic | % Asian |
|---|---|---|---|---|---|---|---|
| 1 | South Sioux City | 13,907 | 3,693 | 26.6% | 13.3% | 52.8% | 3.4% |
| 2 | Crete | 7,527 | 4,276 | 45.9% | 0.7% | 46.3% | 4.3% |
| 3 | Omaha | 488,837 | 4,444 | 63.4% | 11.4% | 16.2% | 4.0% |
| 4 | Grand Island | 52,884 | 4,461 | 55.8% | 3.8% | 36.4% | 1.1% |
| 5 | Lexington | 10,862 | 4,646 | 18.7% | 13.8% | 64.0% | 1.2% |
| 6 | Bellevue | 64,510 | 4,991 | 68.1% | 5.6% | 17.0% | 3.1% |
| 7 | Scottsbluff | 14,376 | 5,163 | 64.9% | 0.3% | 30.7% | 0.5% |
| 8 | Gering | 8,550 | 5,325 | 68.7% | 1.5% | 24.4% | 0.9% |
| 9 | Columbus | 24,488 | 5,380 | 67.6% | 0.8% | 28.2% | 0.1% |
| 10 | Ralston | 6,472 | 5,601 | 70.7% | 0.9% | 24.3% | 0.3% |
| 11 | La Vista | 16,563 | 5,713 | 73.6% | 4.3% | 16.3% | 1.7% |
| 12 | Schuyler | 6,578 | 5,937 | 16.0% | 5.2% | 75.2% | 0.3% |
| 13 | Lincoln | 294,856 | 5,976 | 76.3% | 4.1% | 9.0% | 4.4% |
| 14 | Fremont | 27,567 | 6,032 | 74.9% | 0.6% | 20.3% | 0.4% |
| 15 | Alliance | 8,075 | 6,254 | 77.8% | 0.2% | 12.4% | 0.4% |
| 16 | Norfolk | 26,054 | 6,325 | 77.9% | 1.0% | 15.5% | 1.0% |
| 17 | Hastings | 25,008 | 6,462 | 78.9% | 1.6% | 15.0% | 1.1% |
| 18 | Nebraska City | 7,369 | 6,500 | 79.2% | 1.8% | 14.5% | 0.4% |
| 19 | Kearney | 34,246 | 6,780 | 81.5% | 1.1% | 11.4% | 2.4% |
| 20 | Wayne | 6,121 | 6,794 | 81.2% | 1.6% | 13.6% | 0.4% |
| 21 | Papillion | 25,244 | 6,906 | 82.5% | 3.9% | 8.6% | 1.1% |
| 22 | Sidney | 6,419 | 7,176 | 84.0% | 1.1% | 10.4% | 1.9% |
| 23 | North Platte | 22,831 | 7,210 | 84.3% | 1.0% | 10.1% | 0.8% |
| 24 | Plattsmouth | 6,731 | 7,359 | 85.3% | 0.2% | 7.9% | 0.4% |
| 25 | Chadron | 5,160 | 7,521 | 86.4% | 0.7% | 2.0% | 1.7% |
| 26 | Holdrege | 5,546 | 7,649 | 87.0% | 1.4% | 8.4% | 0.1% |
| 27 | McCook | 7,314 | 7,666 | 87.2% | 1.0% | 6.9% | 0.2% |
| 28 | Gretna | 9,193 | 7,766 | 87.7% | 0.1% | 4.9% | 0.2% |
| 29 | York | 8,141 | 7,905 | 88.6% | 0.7% | 6.2% | 0.9% |
| 30 | Beatrice | 12,225 | 8,315 | 91.0% | 0.8% | 4.2% | 1.2% |
| 31 | Seward | 7,678 | 8,702 | 93.2% | 0.6% | 4.3% | 0.7% |
| 32 | Blair | 7,914 | 8,931 | 94.4% | 0.7% | 0.9% | 0.2% |
Source: U.S. Census ACS 2020-2024. 32 cities with more than 5,000 residents.
Summary
Summary: Diversity Across Nebraska
If you’re looking for a scientific breakdown of diversity across Nebraska, this is an accurate list.
The most diverse cities in Nebraska are South Sioux City, Crete, Omaha, Grand Island, Lexington, Bellevue, Scottsbluff, Gering, Columbus, and Ralston. Not sold on Nebraska? Take the two-minute Find Your Place quiz and see which state actually fits you.
Questions and answers
Most Diverse Cities In Nebraska FAQs
What is the most diverse city in Nebraska?
South Sioux City is the most diverse city in Nebraska for 2026, posting the lowest diversity index (3,693) of the 32 places we measured. Crete and Omaha are next.
What are the 10 most diverse cities in Nebraska?
The ten most diverse cities in Nebraska are South Sioux City, Crete, Omaha, Grand Island, Lexington, Bellevue, Scottsbluff, Gering, Columbus, and Ralston. We ranked all 32 places with more than 5,000 residents by their racial-diversity HHI.
How do you measure diversity?
We use a Herfindahl-Hirschman Index (HHI) across each city’s White, Black, Hispanic, and Asian population shares from the Census American Community Survey. A lower score means the mix is more even, so the lowest HHI wins.
What is the least diverse city in Nebraska?
Blair is the least diverse city in Nebraska, with a diversity index of 8,931. That means one group makes up most of its population.
Where does this data come from?
All population shares come from the Census Bureau’s American Community Survey (2020-2024). Diversity scores in Nebraska range from 3,693 in South Sioux City to 8,931 in Blair.


