Racial diversity in Nevada is a mixed bag.
There are parts of Nevada where there’s a high level of diversity. But where will you find the most diverse places in Nevada?
To answer that question, we went to the US Census data. Using Saturday Night Science, we measured the Gini coefficient for all 33 cities in Nevada to rank them from most to least diverse.
#1 most diverse in Nevada
Data | Crime | Cost of living | Movers
#2 most diverse in Nevada
Data | Crime | Cost of living | Movers
#3 most diverse in Nevada
Data | Crime | Cost of living | Movers
#4 most diverse in Nevada
Coordinates: 36455N 115729W 36.08194; -115.12472
Data | Crime | Cost of living | Movers
#5 most diverse in Nevada
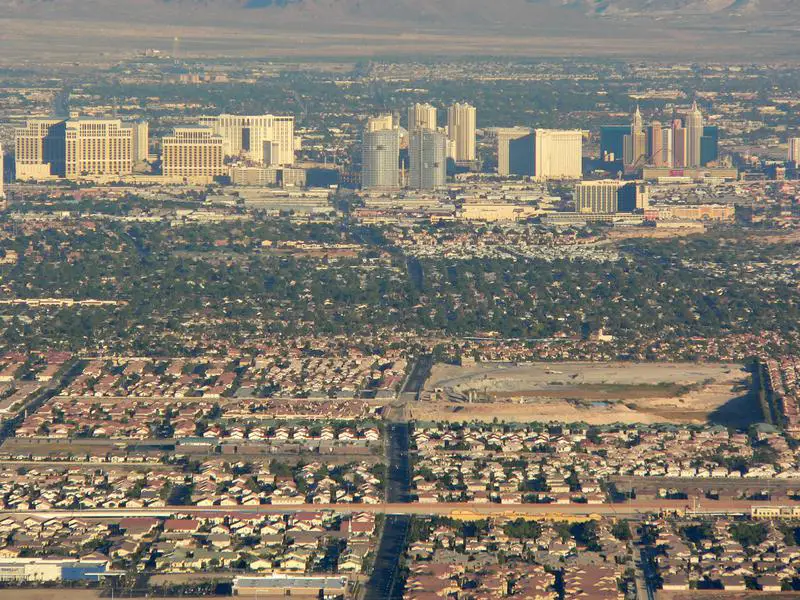
North Las Vegas is a city in Clark County, Nevada, United States, in the Las Vegas Valley. As of the 2010 census it had a population of 216,961, with an estimated population of 249,180 in 2017. The city was incorporated on May 16, 1946. It is in the Las Vegas-Paradise, NV MSA and is the fourth largest city in the state of Nevada.
Data | Crime | Cost of living | Movers | Compare
#6 most diverse in Nevada
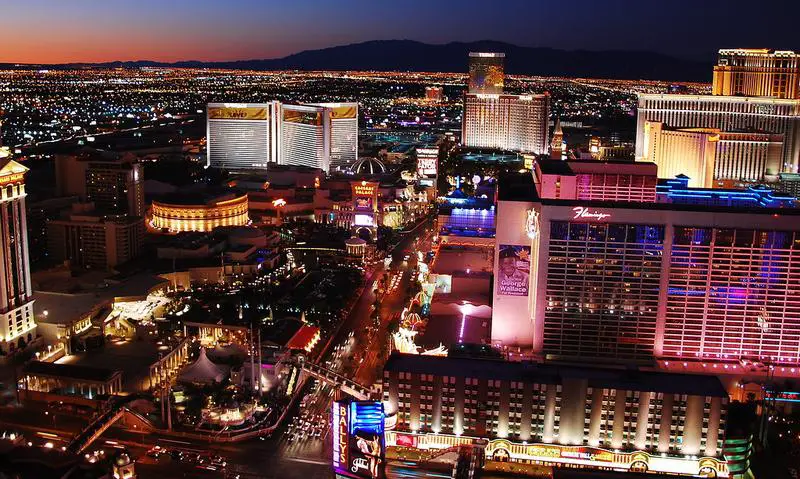
Las Vegas, officially the City of Las Vegas and often known simply as Vegas, is the 28th-most populated city in the United States, the most populated city in the state of Nevada, and the county seat of Clark County. The city anchors the Las Vegas Valley metropolitan area and is the largest city within the greater Mojave Desert. Las Vegas is an internationally renowned major resort city, known primarily for its gambling, shopping, fine dining, entertainment, and nightlife. The Las Vegas Valley as a whole serves as the leading financial, commercial, and cultural center for Nevada.
Data | Crime | Cost of living | Movers
#7 most diverse in Nevada
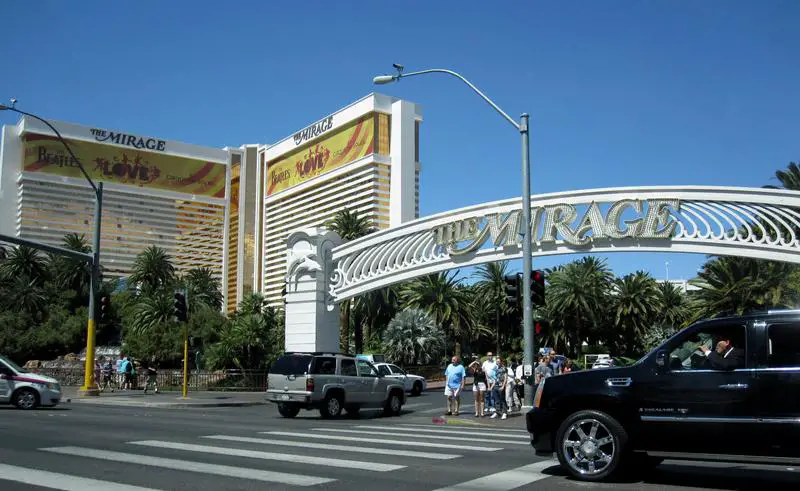
Winchester is an unincorporated town and census-designated place and part of Las Vegas Township in Clark County, Nevada, United States that contains part of the Las Vegas Strip. It is one of a number of CDPs in the unincorporated urbanized area directly south of Las Vegas. The population was 27,978 at the 2010 census. It is governed by the Clark County Commission with advice from the Winchester Town Advisory Board. “Winchester, NV” does not appear in postal addresses; the United States Postal Service has assigned “Las Vegas, NV” as the place name for the ZIP codes containing Winchester.
Data | Crime | Cost of living | Movers
#8 most diverse in Nevada
Data | Crime | Cost of living | Movers
#9 most diverse in Nevada
Data | Crime | Cost of living | Movers
#10 most diverse in Nevada
Henderson, officially the City of Henderson, is a city in Clark County, Nevada, United States, about 16 miles southeast of Las Vegas. It is the second-largest city in Nevada, after Las Vegas, with an estimated population of 292,969 in 2016. The city is part of the Las Vegas metropolitan area, which spans the entire Las Vegas Valley. Henderson occupies the southeastern end of the valley, at an elevation of approximately 1,330 feet.
Data | Crime | Cost of living | Movers | Compare
The receipts
Compare the top ten
Pick a metric. The bars rescale. The red line is Nevada’s statewide median.
On the map
Where diversity lives in Nevada
Saturday Night Science
Methodology: How we determined the most diverse cities in Nevada for 2026
We still believe in the accuracy of data — especially from the Census — and Saturday Night Science. So that’s where we went to get the race breakdown across Nevada.
That leads us to the Census’s most recently available data, the 2020-2024 American Community Survey data from the US Census.
Specifically, we looked at table B03002: HISPANIC OR LATINO ORIGIN BY RACE. Here are the category names as defined by the Census:
- White alone*
- Black or African American alone*
- American Indian and Alaska Native alone*
- Asian alone*
- Native Hawaiian and Other Pacific Islander alone*
- Some other race alone*
- Two or more races*
- Hispanic or Latino
We limited our analysis to non-CDPs with a population greater than 5,000 people. That left us with 33 cities.
We then calculated the HHI for each city by finding the racial breakdown of a city in percent terms, squaring them, and then adding the squares together. This left us with scores ranging from 2,395 (Enterprise) to 7,879 (Johnson Lane).
Finally, we ranked each city based on the HHI, with a lower score being more diverse than a high score. Enterprise took the distinction of being the most diverse, while Johnson Lane was the least diverse city.
We updated this article for 2026. This report is our eleventh time ranking the most diverse places in Nevada.
The full plate
Race By City In Nevada For 2026
Click any column to sort. Search by city name.
| Rank | City | Population | HHI | % White | % Black | % Hispanic | % Asian |
|---|---|---|---|---|---|---|---|
| 1 | Enterprise | 240,464 | 2,395 | 36.2% | 10.9% | 18.9% | 23.0% |
| 2 | Spring Valley | 219,187 | 2,441 | 35.9% | 12.3% | 22.7% | 21.1% |
| 3 | Whitney | 47,221 | 2,744 | 24.0% | 14.6% | 42.4% | 10.7% |
| 4 | Paradise | 185,913 | 2,780 | 34.2% | 10.3% | 36.8% | 10.7% |
| 5 | North Las Vegas | 278,595 | 2,794 | 23.4% | 20.6% | 41.7% | 7.0% |
| 6 | Las Vegas | 660,400 | 2,985 | 39.7% | 11.2% | 34.7% | 7.0% |
| 7 | Winchester | 37,081 | 3,443 | 22.0% | 11.9% | 52.3% | 7.1% |
| 8 | Nellis AFB | 5,087 | 3,724 | 53.3% | 12.1% | 26.6% | 3.5% |
| 9 | Sunrise Manor | 200,218 | 3,733 | 19.9% | 13.4% | 55.8% | 5.1% |
| 10 | Henderson | 332,141 | 3,812 | 57.5% | 6.5% | 18.1% | 9.5% |
| 11 | Summerlin South | 31,354 | 3,885 | 58.0% | 3.4% | 12.6% | 17.1% |
| 12 | Sparks | 110,024 | 3,902 | 52.8% | 2.3% | 32.4% | 6.2% |
| 13 | Reno | 273,212 | 3,962 | 56.6% | 3.0% | 25.8% | 6.9% |
| 14 | Sun Valley | 22,228 | 4,325 | 43.1% | 1.3% | 49.5% | 1.6% |
| 15 | Elko | 20,696 | 4,467 | 60.0% | 1.1% | 28.9% | 2.8% |
| 16 | Winnemucca | 8,361 | 4,707 | 62.0% | 0.6% | 28.9% | 2.6% |
| 17 | Cold Springs | 11,321 | 4,944 | 65.6% | 1.0% | 24.5% | 1.4% |
| 18 | Fernley | 24,225 | 5,001 | 66.9% | 0.8% | 21.6% | 2.0% |
| 19 | Pahrump | 47,347 | 5,114 | 68.9% | 2.7% | 16.9% | 2.0% |
| 20 | Fallon | 9,463 | 5,165 | 69.5% | 2.7% | 16.6% | 3.2% |
| 21 | Incline Village | 9,272 | 5,251 | 69.0% | 0.4% | 20.3% | 1.4% |
| 22 | Laughlin | 8,789 | 5,361 | 70.7% | 2.7% | 17.4% | 0.7% |
| 23 | Indian Hills | 5,527 | 5,593 | 72.6% | 0.0% | 16.7% | 4.6% |
| 24 | Gardnerville | 5,486 | 5,603 | 73.2% | 0.0% | 14.0% | 4.6% |
| 25 | Mesquite | 22,059 | 5,617 | 70.7% | 0.5% | 24.7% | 1.6% |
| 26 | Dayton | 15,781 | 5,736 | 72.8% | 1.2% | 20.6% | 1.3% |
| 27 | Gardnerville Ranchos | 12,114 | 5,927 | 75.1% | 0.0% | 16.1% | 0.9% |
| 28 | Spanish Springs | 17,980 | 6,236 | 77.6% | 0.2% | 13.5% | 1.0% |
| 29 | Spring Creek | 14,739 | 6,754 | 81.3% | 0.1% | 10.6% | 0.6% |
| 30 | Moapa Valley | 6,684 | 6,887 | 82.0% | 0.1% | 11.3% | 0.4% |
| 31 | Silver Springs | 5,060 | 7,114 | 83.8% | 1.2% | 5.6% | 1.1% |
| 32 | Boulder City | 14,919 | 7,247 | 84.6% | 0.8% | 7.1% | 0.7% |
| 33 | Johnson Lane | 6,467 | 7,879 | 88.5% | 0.8% | 6.1% | 0.4% |
Source: U.S. Census ACS 2020-2024. 33 cities with more than 5,000 residents.
Summary
Summary: Diversity Across Nevada
If you’re looking for a scientific breakdown of diversity across Nevada, this is an accurate list.
The most diverse cities in Nevada are Enterprise, Spring Valley, Whitney, Paradise, North Las Vegas, Las Vegas, Winchester, Nellis AFB, Sunrise Manor, and Henderson. Not sold on Nevada? Take the two-minute Find Your Place quiz and see which state actually fits you.
Questions and answers
Most Diverse Cities In Nevada FAQs
What is the most diverse city in Nevada?
Enterprise is the most diverse city in Nevada for 2026, posting the lowest diversity index (2,395) of the 33 places we measured. Spring Valley and Whitney are next.
What are the 10 most diverse cities in Nevada?
The ten most diverse cities in Nevada are Enterprise, Spring Valley, Whitney, Paradise, North Las Vegas, Las Vegas, Winchester, Nellis AFB, Sunrise Manor, and Henderson. We ranked all 33 places with more than 5,000 residents by their racial-diversity HHI.
How do you measure diversity?
We use a Herfindahl-Hirschman Index (HHI) across each city’s White, Black, Hispanic, and Asian population shares from the Census American Community Survey. A lower score means the mix is more even, so the lowest HHI wins.
What is the least diverse city in Nevada?
Johnson Lane is the least diverse city in Nevada, with a diversity index of 7,879. That means one group makes up most of its population.
Where does this data come from?
All population shares come from the Census Bureau’s American Community Survey (2020-2024). Diversity scores in Nevada range from 2,395 in Enterprise to 7,879 in Johnson Lane.


