Before you decide to relocate to Massachusetts, it’s important to research the exact cost of living around the state. And that’s what we’re going to help you do.
These are the places in Massachusetts that cost a pretty penny — the most expensive cities in the state.
We used Saturday Night Science to compare the 2020-2024 American Community Survey on cost of living for the 48 places in Massachusetts with more than 12,000 people.
After we saved up for months and could finally afford it, we landed on this list of the ten most expensive cities in Massachusetts for 2026.
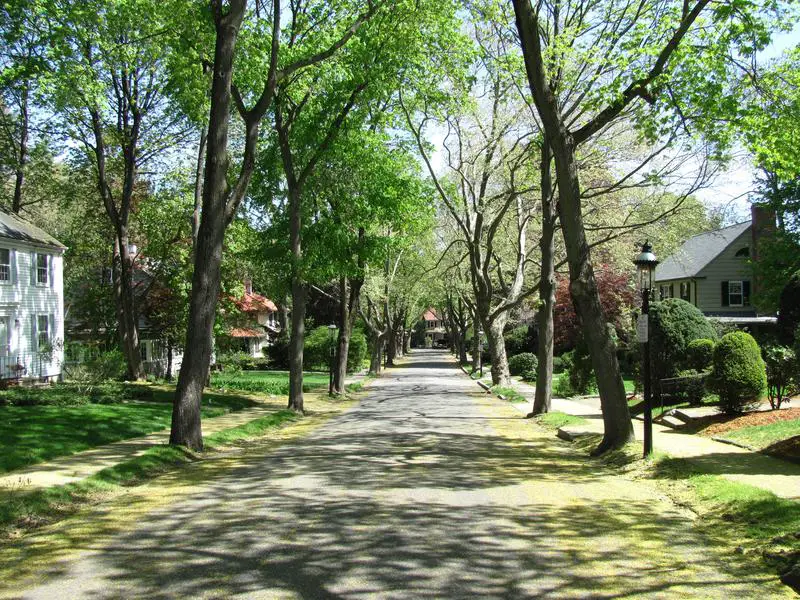
$190,304 median income · $1,528,894 median home · #1 home prices in Massachusetts
Newton is a suburban city in Middlesex County, Massachusetts, United States. It is approximately 7 miles west of downtown Boston and is bordered by Boston’s Brighton and West Roxbury neighborhoods to the east and south, respectively, and by the suburb of Brookline to the east, the suburbs of Watertown and Waltham to the north, and Wellesley and Needham to the west. Rather than having a single city center, Newton resembles a patchwork of thirteen villages. According to the 2010 U.S. Census, the population of Newton was 85,146, making it the eleventh largest city in the state.
Data | Crime | Cost of living | Movers
$130,748 median income · $1,041,569 median home · #2 home prices in Massachusetts
Cambridge is a city in Middlesex County, Massachusetts, and part of the Boston metropolitan area.
Data | Crime | Cost of living | Movers
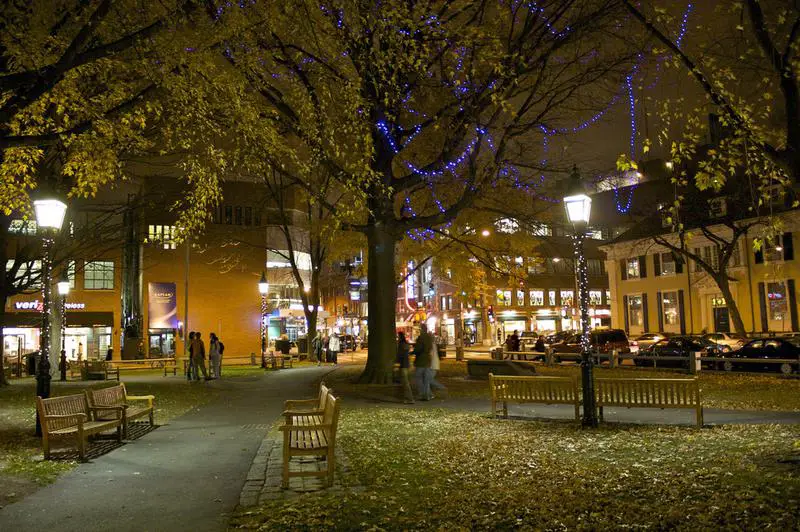
$132,572 median income · $940,239 median home · #3 home prices in Massachusetts
Somerville is a city located directly to the northwest of Boston, in Middlesex County, Massachusetts, United States. As of 2010, the United States Census lists the city with a total population of 75,754 people, making it the most densely populated municipality in New England. As of 2010, it was the 16th most densely populated incorporated municipality in the country. Somerville was established as a town in 1842, when it was separated from Charlestown. In 2006, the town was named the best-run city in Massachusetts by the Boston Globe. In 1972, in 2009, and again in 2015, the city received the All-America City Award.
Data | Crime | Cost of living | Movers
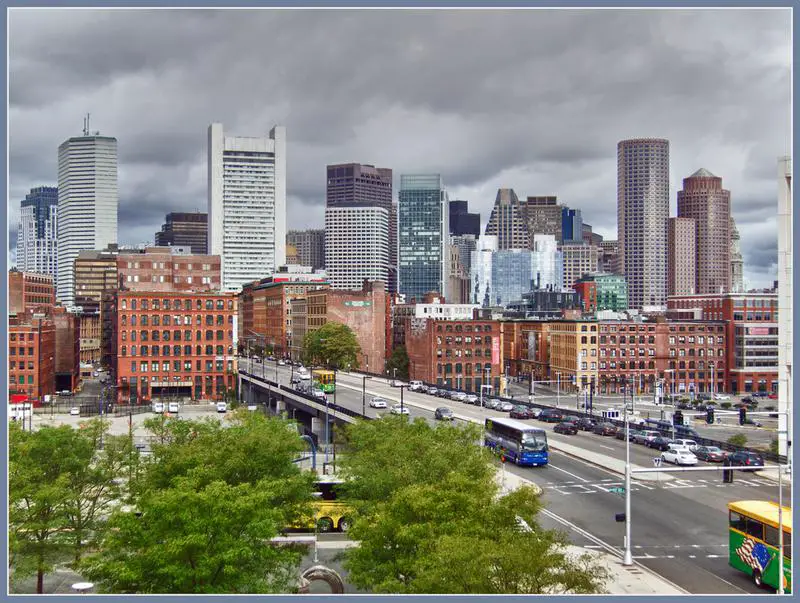
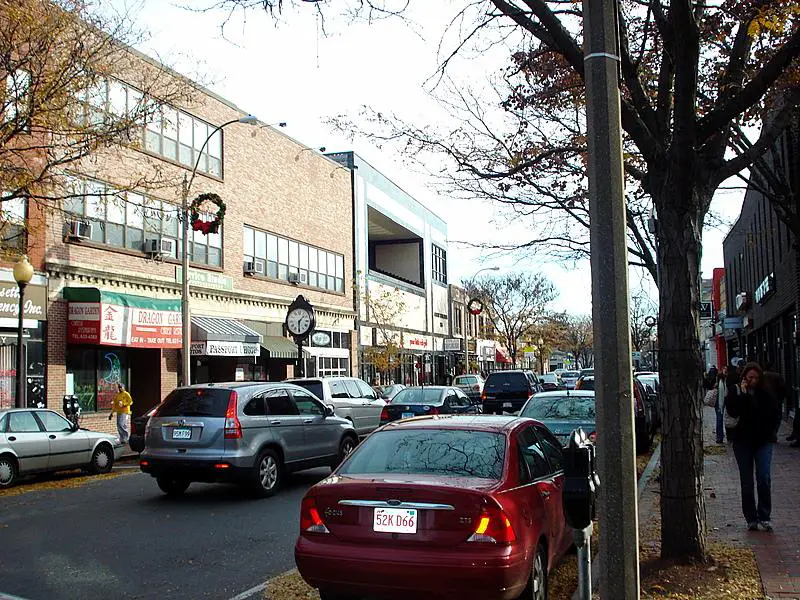
$97,344 median income · $798,217 median home · #8 home prices in Massachusetts
Boston BOSS-tn) is the capital city and most populous municipality of the Commonwealth of Massachusetts in the United States. It is also the seat of Suffolk County, although the county government was disbanded on July 1, 1999. The city proper covers 48 square miles with an estimated population of 673,184 in 2016, making it the largest city in the New England region of the northeastern United States. The city is the economic and cultural anchor of a substantially larger metropolitan area known as Greater Boston, a metropolitan statistical area home to a census-estimated 4.8million people in 2016 and ranking as the tenth-largest such area in the country. As a combined statistical area, this wider commuting region is home to some 8.2million people, making it the sixth-largest in the United States.
Data | Crime | Cost of living | Movers
$133,953 median income · $908,131 median home · #5 home prices in Massachusetts
Melrose is a city located in the Greater Boston metropolitan area in Middlesex County, Massachusetts. Its population as per the 2010 United States Census is 26,983. It is a suburb located approximately seven miles north of Boston and is situated in the center of the triangle created by Interstates 93, 95 and US Route 1.
Data | Crime | Cost of living | Movers
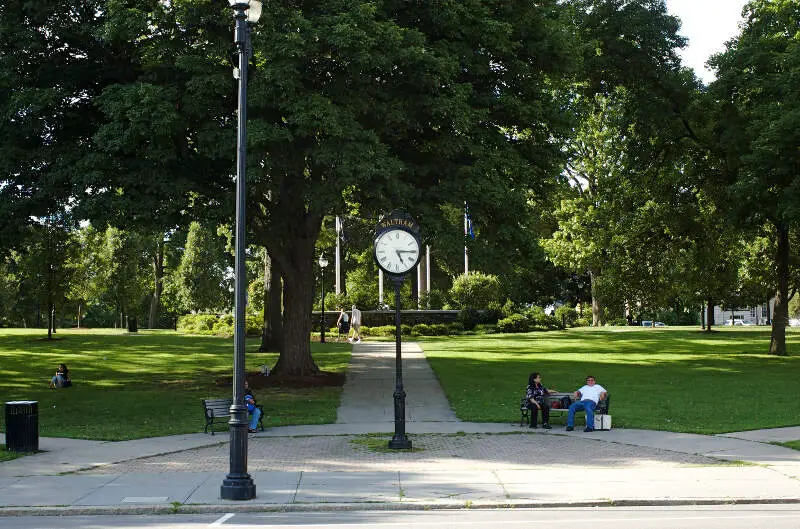
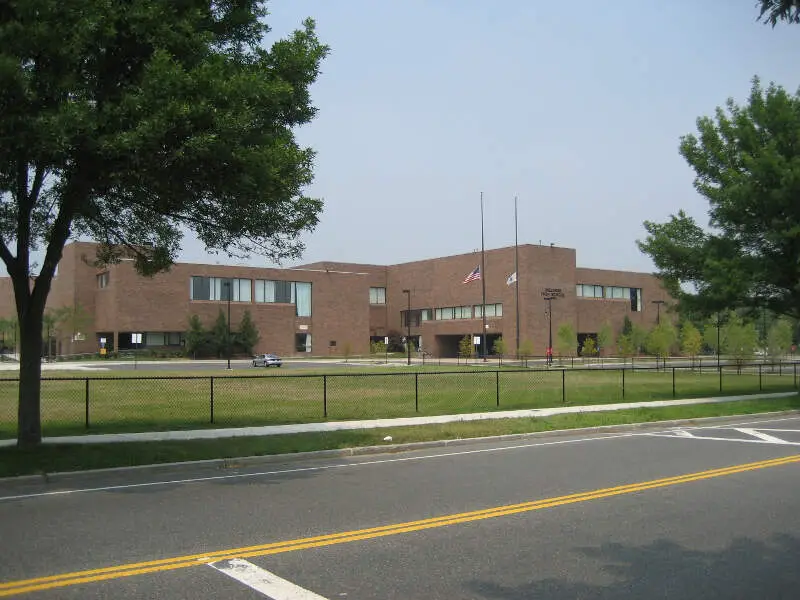
$120,216 median income · $826,437 median home · #7 home prices in Massachusetts
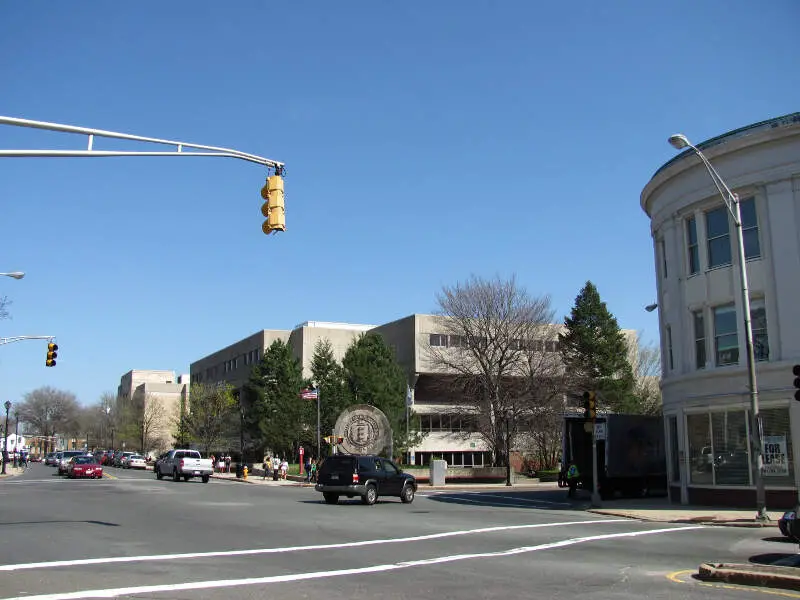
Waltham is a city in Middlesex County, Massachusetts, United States, and was an early center for the labor movement as well as a major contributor to the American Industrial Revolution. The original home of the Boston Manufacturing Company, the city was a prototype for 19th century industrial city planning, spawning what became known as the Waltham-Lowell system of labor and production. The city is now a center for research and higher education, home to Brandeis University and Bentley University. The population was 60,636 at the census in 2010.
Data | Crime | Cost of living | Movers
$129,540 median income · $842,298 median home · #6 home prices in Massachusetts
Medford is a city 3.2 miles northwest of downtown Boston on the Mystic River in Middlesex County, Massachusetts, United States. In the 2010 U.S. Census, Medford’s population was 56,173. It is home to Tufts University.
Data | Crime | Cost of living | Movers
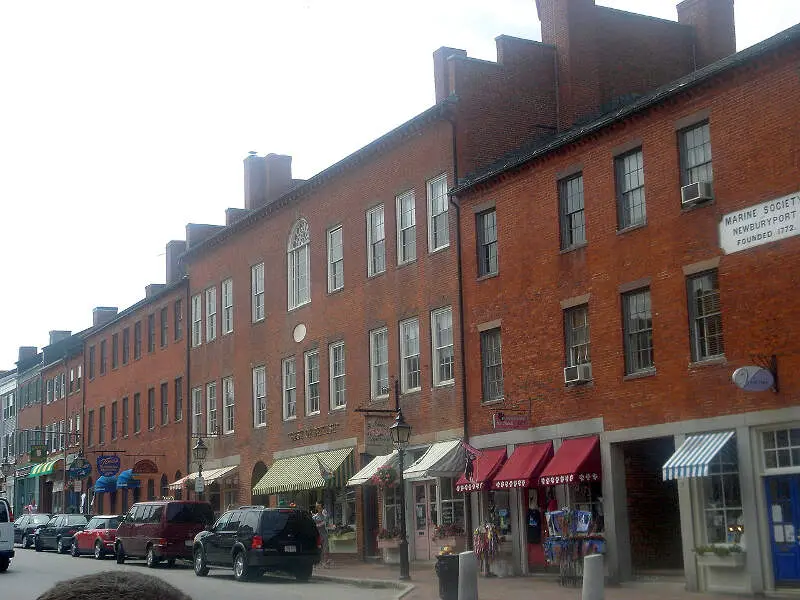
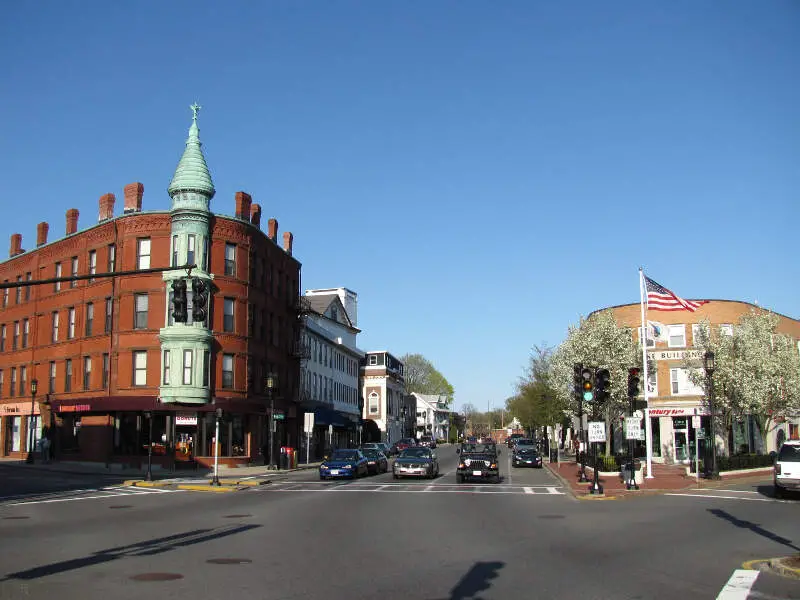
$139,625 median income · $923,543 median home · #4 home prices in Massachusetts
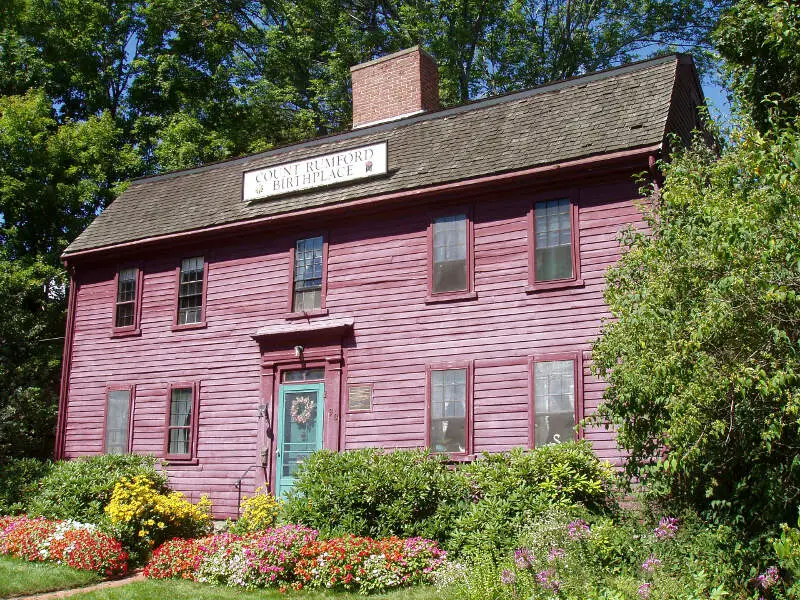
Newburyport is a small coastal, scenic, and historic city in Essex County, Massachusetts, United States, 35 miles northeast of Boston. The population was 17,416 at the 2010 census. A historic seaport with a vibrant tourism industry, Newburyport includes part of Plum Island. The mooring, winter storage and maintenance of recreational boats, motor and sail, still contribute a large part of the city’s income. A Coast Guard station oversees boating activity, especially in the swift tidal currents of the Merrimack River.
Data | Crime | Cost of living | Movers
$111,185 median income · $758,603 median home · #12 home prices in Massachusetts
Woburn is a city in Middlesex County, Massachusetts, United States. The population was 38,120 at the 2010 census. Woburn is located 9 miles north of Boston, Massachusetts.
Data | Crime | Cost of living | Movers
$100,606 median income · $684,055 median home · #17 home prices in Massachusetts
Malden is a city in Middlesex County, Massachusetts, United States. At the time of the 2010 United States Census, the population was at 59,450 people. In 2009, Malden was named the “Best Place to Raise Your Kids” in Massachusetts by Bloomberg Businessweek.
Data | Crime | Cost of living | Movers
The receipts
Compare the top ten
Pick a metric. The bars rescale. The red line is Massachusetts’s statewide median.
Massachusetts statewide median: $656,690
Massachusetts statewide median: $103,960
On the map
Mapping the most expensive places in Massachusetts
Saturday Night Science
Methodology: How We Determined The Most Expensive Places To Live In The Bay State For 2026
The two most important things to think about when it comes to being able to afford a city in Massachusetts are how much money you make and how much you have to spend to live there.
You need to understand your costs in the context of how much money you make.
For example, if the median household earns $100,000 and spends $40,000 on housing, it’s actually cheaper to live there than a place with a median income of $50,000 and housing costs of $21,000. You might spend more on housing, but you have more money overall to play with.
With that example in mind, we derived several statistics from the latest Census American Community Survey 2020-2024 around incomes and costs. They are:
- Overall Cost Of Living Index
- Median Home Price / Median Income (lower is better)
- Median Income / Median Rent (Higher is better)
- Median Home Price
You can then compare these metrics in each of the places in Massachusetts to figure out which is the most expensive.
You are left with a “Cost of Living Index” by taking the average rank of each of these metrics for each city.
So we used that cost of living index to rank all of the 48 places in Massachusetts that have more than 12,000 people.
The place with the highest cost of living in Massachusetts according to the data is Newton. We updated this article for 2026. This article is our eleventh time ranking the most expensive places to live in Massachusetts.
The full plate
Most Expensive Cities In Massachusetts
Click any column to sort. Search by city name.
| Rank | City | Cost Of Living | Population | Median Income | Average Home Price | Home/Income Ratio |
|---|---|---|---|---|---|---|
| 1 | Newton | 205 | 89,044 | $190,304 | $1,528,894 | 8.0x |
| 2 | Cambridge | 204 | 118,796 | $130,748 | $1,041,569 | 8.0x |
| 3 | Somerville | 186 | 81,036 | $132,572 | $940,239 | 7.1x |
| 4 | Boston | 171 | 666,442 | $97,344 | $798,217 | 8.2x |
| 5 | Melrose | 167 | 29,650 | $133,953 | $908,131 | 6.8x |
| 6 | Waltham | 163 | 64,902 | $120,216 | $826,437 | 6.9x |
| 7 | Medford | 162 | 59,354 | $129,540 | $842,298 | 6.5x |
| 8 | Newburyport | 162 | 18,652 | $139,625 | $923,543 | 6.6x |
| 9 | Woburn | 153 | 41,939 | $111,185 | $758,603 | 6.8x |
| 10 | Malden | 150 | 65,906 | $100,606 | $684,055 | 6.8x |
| 11 | Braintree Town | 150 | 38,899 | $122,214 | $767,327 | 6.3x |
| 12 | Winthrop Town | 150 | 18,759 | $116,167 | $758,915 | 6.5x |
| 13 | Quincy | 149 | 102,114 | $98,882 | $675,959 | 6.8x |
| 14 | Beverly | 148 | 42,665 | $106,044 | $755,767 | 7.1x |
| 15 | Everett | 146 | 50,045 | $85,218 | $639,070 | 7.5x |
| 16 | Franklin Town | 145 | 33,154 | $145,773 | $714,637 | 4.9x |
| 17 | Peabody | 142 | 54,695 | $96,657 | $694,094 | 7.2x |
| 18 | Barnstable Town | 141 | 49,568 | $91,982 | $703,889 | 7.7x |
| 19 | Gloucester | 140 | 30,075 | $83,883 | $760,558 | 9.1x |
| 20 | Revere | 138 | 60,012 | $86,969 | $612,971 | 7.0x |
| 21 | Marlborough | 138 | 41,647 | $91,968 | $578,934 | 6.3x |
| 22 | Weymouth Town | 137 | 58,505 | $102,714 | $645,008 | 6.3x |
| 23 | Lynn | 136 | 101,709 | $75,043 | $580,316 | 7.7x |
| 24 | Salem | 135 | 44,795 | $85,153 | $606,559 | 7.1x |
| 25 | Chelsea | 134 | 39,908 | $72,179 | $526,190 | 7.3x |
| 26 | Northampton | 130 | 30,962 | $80,288 | $486,075 | 6.1x |
| 27 | Lowell | 127 | 118,368 | $78,658 | $480,319 | 6.1x |
| 28 | Brockton | 127 | 105,386 | $80,115 | $503,833 | 6.3x |
| 29 | Lawrence | 127 | 88,736 | $60,433 | $504,150 | 8.3x |
| 30 | Haverhill | 127 | 67,698 | $88,326 | $543,992 | 6.2x |
| 31 | Attleboro | 127 | 46,762 | $98,954 | $532,570 | 5.4x |
| 32 | Taunton | 124 | 60,433 | $79,283 | $513,322 | 6.5x |
| 33 | Fall River | 121 | 94,082 | $56,673 | $445,781 | 7.9x |
| 34 | Agawam Town | 120 | 28,539 | $85,421 | $364,036 | 4.3x |
| 35 | Worcester | 119 | 207,055 | $70,102 | $430,112 | 6.1x |
| 36 | Southbridge Town | 118 | 17,928 | $66,287 | $344,409 | 5.2x |
| 37 | New Bedford | 117 | 100,998 | $56,981 | $434,262 | 7.6x |
| 38 | Leominster | 117 | 43,909 | $83,816 | $463,494 | 5.5x |
| 39 | West Springfield Town | 116 | 28,772 | $69,371 | $375,602 | 5.4x |
| 40 | Westfield | 115 | 40,378 | $87,753 | $378,738 | 4.3x |
| 41 | Palmer Town | 115 | 12,381 | $78,480 | $317,071 | 4.0x |
| 42 | Fitchburg | 113 | 41,798 | $73,040 | $396,820 | 5.4x |
| 43 | Holyoke | 112 | 37,813 | $53,605 | $322,895 | 6.0x |
| 44 | Springfield | 111 | 154,749 | $52,656 | $294,613 | 5.6x |
| 45 | Chicopee | 109 | 55,295 | $62,615 | $311,123 | 5.0x |
| 46 | Gardner | 109 | 21,148 | $67,518 | $369,177 | 5.5x |
| 47 | Pittsfield | 108 | 43,457 | $70,582 | $302,831 | 4.3x |
| 48 | North Adams | 104 | 12,606 | $47,500 | $252,589 | 5.3x |
Source: U.S. Census ACS 2020-2024, Zillow research. 48 places with more than 12,000 residents.
Summary
Summary: Taking A Chunk Out Of Your Paycheck In Massachusetts For 2026
Well, there you have it, the places in Massachusetts that have the highest cost of living, with Newton ranking as the most expensive city in the Bay State.
The most expensive cities in Massachusetts are Newton, Cambridge, Somerville, Boston, Melrose, Waltham, Medford, Newburyport, Woburn, and Malden.


