You’ll need more than some pocket change and luck to afford to live in one of the Tar Heel state’s most expensive places. For many, you’ll need a miracle and a job that pays at least $85,743/year.
Places that made our top ten list like Wilmington and Asheville might be some of the most expensive places to buy a home, but the least expensive to rent.
To determine the most expensive places inNorth Carolina, we used Saturday Night Science to analyze the cost of living and data from the American Community Survey. We calculated the home price to income ratio and the rent to income ratio for the 140 North Carolina places places with at least 5,000 residents.
This analysis gave us a list of places you will need to win a hefty Powerball to live comfortably.
$250,001 median income · $1,251,047 median home · #1 home prices in North Carolina
Data | Crime | Cost of living | Movers
$190,766 median income · $1,074,644 median home · #2 home prices in North Carolina
Data | Crime | Cost of living | Movers
$116,383 median income · $694,377 median home · #3 home prices in North Carolina
Data | Crime | Cost of living | Movers
$155,385 median income · $599,278 median home · #10 home prices in North Carolina
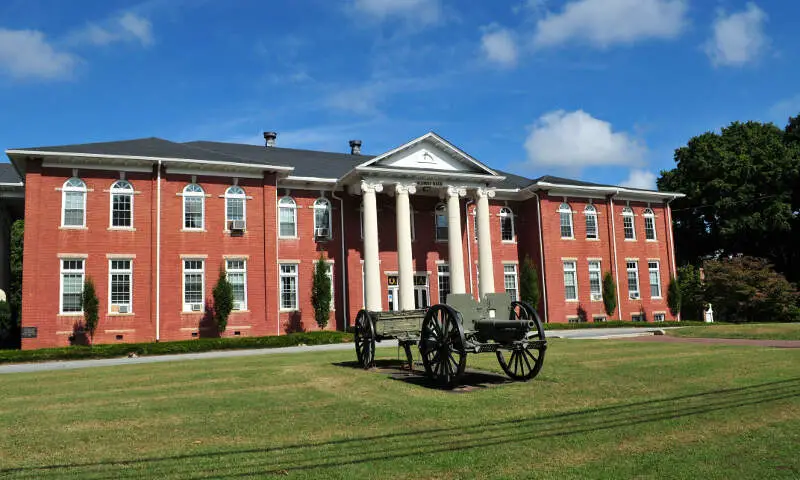
Oak Ridge is a town in northwestern Guilford County, North Carolina, United States. The population was 6,185 at the 2010 census, up from 3,988 at the 2000 census. As of 2015 the population had risen to an estimated 6,671. Oak Ridge is 15 miles northwest of the center of Greensboro, North Carolina’s third-largest city, and it is a part of the Piedmont Triad urban area.
Data | Crime | Cost of living | Movers
$85,989 median income · $631,167 median home · #6 home prices in North Carolina
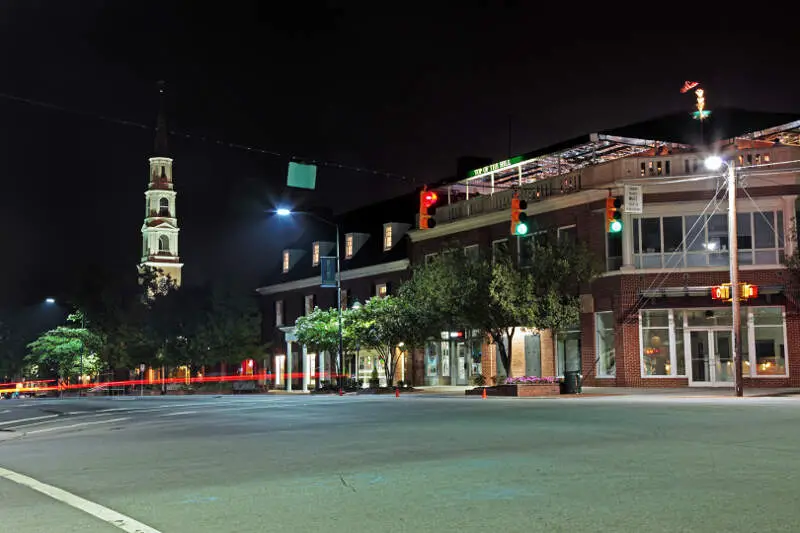
Chapel Hill is a town in Orange and Durham counties in the U.S. state of North Carolina. Its population was 57,233 in the 2010 census, making Chapel Hill the 15th-largest city in the state. Chapel Hill, Durham, and the state capital, Raleigh, make up the corners of the Research Triangle, with a total population of 1,998,808.
Data | Crime | Cost of living | Movers
$166,556 median income · $655,968 median home · #5 home prices in North Carolina
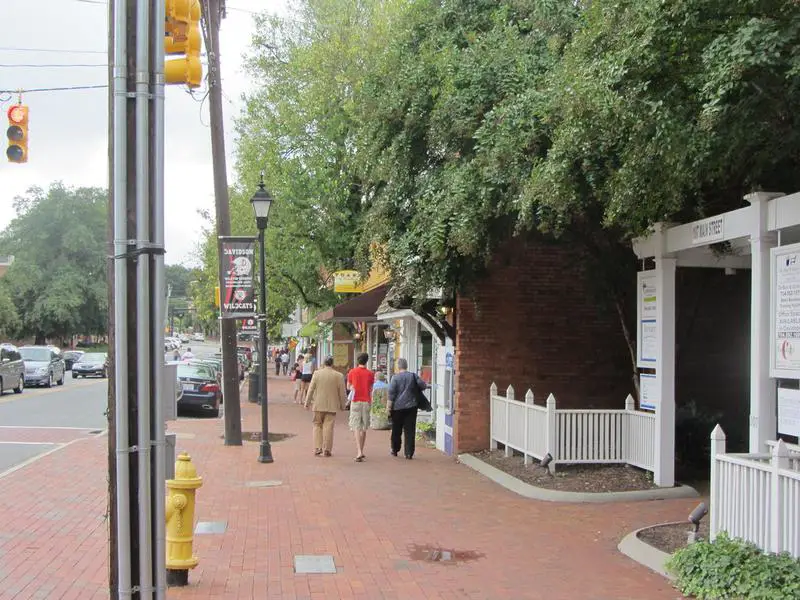
Davidson is a lakeside town on Lake Norman in northern Mecklenburg County in the U.S. state of North Carolina. The population was 10,944 at the 2010 census. It is home to Davidson College. The town is centered on the college from which it takes its name.
Data | Crime | Cost of living | Movers
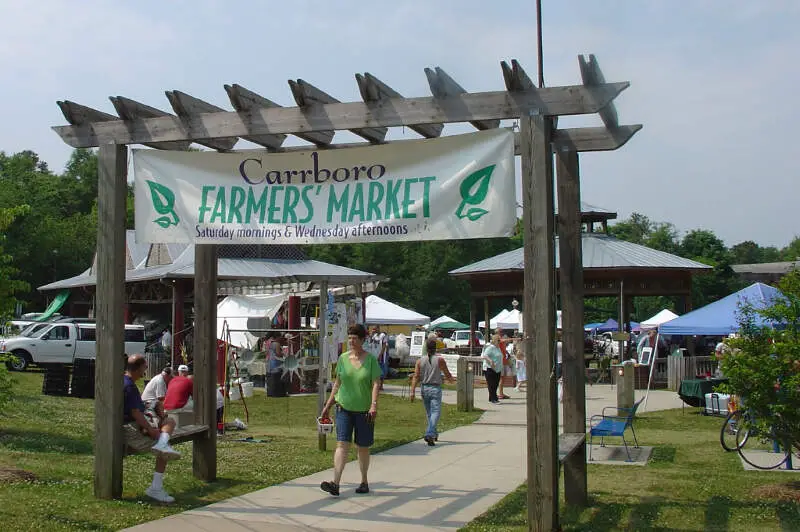
$85,743 median income · $429,675 median home · #39 home prices in North Carolina
Carrboro is a town in Orange County in the U.S. state of North Carolina. The population was 19,582 at the 2010 census. The town, which is part of the Raleigh-Durham-Chapel Hill combined statistical area, was named after North Carolina industrialist Julian Shakespeare Carr.
Data | Crime | Cost of living | Movers
$132,188 median income · $659,096 median home · #4 home prices in North Carolina
Data | Crime | Cost of living | Movers
$135,578 median income · $579,090 median home · #12 home prices in North Carolina
Holly Springs is a town in Wake County, North Carolina, United States. As of the 2010 census, the town population was 24,661, over 2 times its population in 2000.
Data | Crime | Cost of living | Movers
$131,894 median income · $628,812 median home · #7 home prices in North Carolina
Waxhaw is a town located in Union County, North Carolina. The population was 9,859 according to the 2010 Census.
Data | Crime | Cost of living | Movers
The receipts
Compare the top ten
Pick a metric. The bars rescale. The red line is North Carolina’s statewide median.
North Carolina statewide median: $336,408
North Carolina statewide median: $72,388
On the map
Mapping the most expensive places in North Carolina
Saturday Night Science
Methodology: How We Determined The Most Expensive Places To Live In The Tar Heel State For 2026
The two most important things to think about when it comes to being able to afford a city in North Carolina are how much money you make and how much you have to spend to live there.
You need to understand your costs in the context of how much money you make.
For example, if the median household earns $100,000 and spends $40,000 on housing, it’s actually cheaper to live there than a place with a median income of $50,000 and housing costs of $21,000. You might spend more on housing, but you have more money overall to play with.
With that example in mind, we derived several statistics from the latest Census American Community Survey 2020-2024 around incomes and costs. They are:
- Overall Cost Of Living Index
- Median Home Price / Median Income (lower is better)
- Median Income / Median Rent (Higher is better)
- Median Home Price
You can then compare these metrics in each of the places in North Carolina to figure out which is the most expensive.
You are left with a “Cost of Living Index” by taking the average rank of each of these metrics for each city.
So we used that cost of living index to rank all of the 140 places in North Carolina that have more than 5,000 people.
The place with the highest cost of living in North Carolina according to the data is Marvin. We updated this article for 2026. This article is our eleventh time ranking the most expensive places to live in North Carolina.
The full plate
Most Expensive Cities In North Carolina
Click any column to sort. Search by city name.
| Rank | City | Cost Of Living | Population | Median Income | Average Home Price | Home/Income Ratio |
|---|---|---|---|---|---|---|
| 1 | Marvin | 183 | 6,692 | $250,001 | $1,251,047 | 5.0x |
| 2 | Weddington | 146 | 13,805 | $190,766 | $1,074,644 | 5.6x |
| 3 | St. James | 142 | 7,072 | $116,383 | $694,377 | 6.0x |
| 4 | Oak Ridge | 136 | 7,744 | $155,385 | $599,278 | 3.9x |
| 5 | Chapel Hill | 133 | 61,607 | $85,989 | $631,167 | 7.3x |
| 6 | Davidson | 131 | 15,660 | $166,556 | $655,968 | 3.9x |
| 7 | Carrboro | 128 | 21,204 | $85,743 | $429,675 | 5.0x |
| 8 | Wesley Chapel | 127 | 9,090 | $132,188 | $659,096 | 5.0x |
| 9 | Holly Springs | 126 | 45,248 | $135,578 | $579,090 | 4.3x |
| 10 | Waxhaw | 125 | 22,275 | $131,894 | $628,812 | 4.8x |
| 11 | Whispering Pines | 125 | 5,211 | $126,450 | $529,288 | 4.2x |
| 12 | Cornelius | 124 | 32,783 | $113,767 | $527,117 | 4.6x |
| 13 | Cary | 123 | 179,306 | $134,905 | $626,396 | 4.6x |
| 14 | Carolina Beach | 122 | 6,745 | $94,398 | $606,035 | 6.4x |
| 15 | Apex | 121 | 70,630 | $144,135 | $599,085 | 4.2x |
| 16 | Morrisville | 121 | 31,422 | $125,396 | $480,926 | 3.8x |
| 17 | Summerfield | 121 | 11,116 | $160,275 | $519,610 | 3.2x |
| 18 | Pinehurst | 118 | 18,256 | $109,802 | $535,650 | 4.9x |
| 19 | Wake Forest | 117 | 52,844 | $123,802 | $512,161 | 4.1x |
| 20 | Matthews | 117 | 30,577 | $108,611 | $501,848 | 4.6x |
| 21 | Harrisburg | 117 | 19,633 | $148,254 | $494,884 | 3.3x |
| 22 | Raleigh | 116 | 481,031 | $85,395 | $433,996 | 5.1x |
| 23 | Huntersville | 116 | 63,969 | $120,516 | $550,755 | 4.6x |
| 24 | Rolesville | 116 | 10,766 | $149,565 | $497,996 | 3.3x |
| 25 | Asheville | 115 | 94,535 | $71,102 | $460,994 | 6.5x |
| 26 | Stallings | 114 | 16,886 | $115,974 | $461,633 | 4.0x |
| 27 | Elon | 114 | 11,032 | $84,773 | $350,880 | 4.1x |
| 28 | Hillsborough | 114 | 9,724 | $98,163 | $472,962 | 4.8x |
| 29 | Kill Devil Hills | 113 | 7,761 | $89,773 | $521,722 | 5.8x |
| 30 | Mills River | 113 | 7,281 | $105,398 | $530,766 | 5.0x |
| 31 | Fuquay-Varina | 112 | 40,485 | $115,497 | $525,746 | 4.6x |
| 32 | Southern Pines | 112 | 16,420 | $88,535 | $456,116 | 5.2x |
| 33 | Woodfin | 112 | 8,048 | $71,384 | $427,001 | 6.0x |
| 34 | Durham | 111 | 291,467 | $81,619 | $396,395 | 4.9x |
| 35 | Indian Trail | 111 | 42,036 | $108,483 | $419,103 | 3.9x |
| 36 | Mint Hill | 111 | 27,556 | $100,860 | $513,193 | 5.1x |
| 37 | Fletcher | 111 | 8,098 | $75,272 | $446,279 | 5.9x |
| 38 | Leland | 110 | 29,607 | $91,977 | $376,599 | 4.1x |
| 39 | Pineville | 110 | 11,055 | $69,354 | $403,663 | 5.8x |
| 40 | Oak Island | 110 | 9,030 | $85,872 | $568,672 | 6.6x |
| 41 | Mooresville | 109 | 52,381 | $89,647 | $482,315 | 5.4x |
| 42 | Carolina Shores | 109 | 5,017 | $76,087 | $319,366 | 4.2x |
| 43 | Charlotte | 108 | 903,844 | $82,068 | $397,125 | 4.8x |
| 44 | Wilmington | 108 | 120,805 | $66,738 | $416,159 | 6.2x |
| 45 | Clemmons | 108 | 21,871 | $87,655 | $387,814 | 4.4x |
| 46 | Black Mountain | 108 | 8,513 | $77,042 | $463,739 | 6.0x |
| 47 | Stokesdale | 108 | 6,004 | $121,071 | $386,451 | 3.2x |
| 48 | Knightdale | 107 | 20,214 | $103,220 | $370,204 | 3.6x |
| 49 | Boone | 107 | 20,032 | $30,065 | $483,789 | 16.1x |
| 50 | Belmont | 107 | 15,546 | $94,883 | $432,565 | 4.6x |
| 51 | Morehead City | 105 | 9,806 | $56,233 | $410,236 | 7.3x |
| 52 | Concord | 104 | 108,719 | $86,921 | $382,592 | 4.4x |
| 53 | Garner | 104 | 34,473 | $78,756 | $384,100 | 4.9x |
| 54 | Lewisville | 104 | 13,828 | $100,917 | $404,564 | 4.0x |
| 55 | Unionville | 104 | 6,954 | $96,028 | $419,701 | 4.4x |
| 56 | Archer Lodge | 104 | 5,186 | $91,188 | $377,862 | 4.1x |
| 57 | Mebane | 103 | 19,538 | $83,174 | $353,221 | 4.2x |
| 58 | Cramerton | 103 | 5,450 | $82,160 | $305,443 | 3.7x |
| 59 | Clayton | 102 | 29,320 | $78,822 | $364,742 | 4.6x |
| 60 | Kernersville | 102 | 27,830 | $71,918 | $322,447 | 4.5x |
| 61 | Hendersonville | 102 | 15,408 | $53,449 | $405,676 | 7.6x |
| 62 | Wendell | 102 | 13,064 | $95,787 | $369,603 | 3.9x |
| 63 | Brevard | 102 | 7,897 | $54,103 | $464,518 | 8.6x |
| 64 | Hickory | 100 | 44,258 | $64,576 | $293,999 | 4.6x |
| 65 | Monroe | 100 | 36,759 | $72,540 | $356,520 | 4.9x |
| 66 | Greensboro | 99 | 301,198 | $61,515 | $264,428 | 4.3x |
| 67 | Jacksonville | 99 | 71,279 | $57,697 | $261,056 | 4.5x |
| 68 | Elizabeth City | 99 | 18,871 | $52,141 | $264,970 | 5.1x |
| 69 | Butner | 99 | 8,065 | $74,739 | $273,631 | 3.7x |
| 70 | Boiling Spring Lakes | 99 | 6,347 | $62,676 | $315,223 | 5.0x |
| 71 | Pleasant Garden | 99 | 5,060 | $88,204 | $315,482 | 3.6x |
| 72 | Fayetteville | 98 | 210,815 | $58,407 | $225,534 | 3.9x |
| 73 | Gastonia | 98 | 82,884 | $64,059 | $277,331 | 4.3x |
| 74 | Waynesville | 98 | 10,502 | $54,923 | $355,352 | 6.5x |
| 75 | Gibsonville | 98 | 9,467 | $95,861 | $307,075 | 3.2x |
| 76 | Aberdeen | 98 | 9,228 | $75,078 | $352,796 | 4.7x |
| 77 | King | 98 | 7,408 | $57,817 | $276,086 | 4.8x |
| 78 | Mount Holly | 97 | 18,208 | $79,385 | $360,773 | 4.5x |
| 79 | High Point | 96 | 116,245 | $64,561 | $249,821 | 3.9x |
| 80 | Kannapolis | 96 | 57,890 | $73,836 | $279,708 | 3.8x |
| 81 | Hope Mills | 96 | 17,939 | $65,774 | $263,454 | 4.0x |
| 82 | Havelock | 96 | 17,691 | $58,408 | $233,896 | 4.0x |
| 83 | Lincolnton | 96 | 11,783 | $46,320 | $296,022 | 6.4x |
| 84 | Winterville | 96 | 10,725 | $83,193 | $278,291 | 3.3x |
| 85 | Angier | 96 | 6,241 | $52,214 | $333,903 | 6.4x |
| 86 | Locust | 96 | 5,840 | $76,504 | $384,686 | 5.0x |
| 87 | Greenville | 95 | 92,857 | $49,748 | $235,821 | 4.7x |
| 88 | Wilson | 95 | 48,370 | $52,485 | $218,942 | 4.2x |
| 89 | Salisbury | 95 | 35,825 | $53,716 | $280,646 | 5.2x |
| 90 | New Bern | 95 | 32,734 | $61,031 | $281,328 | 4.6x |
| 91 | Statesville | 95 | 29,894 | $52,880 | $297,070 | 5.6x |
| 92 | Conover | 95 | 8,580 | $65,972 | $277,412 | 4.2x |
| 93 | Nashville | 95 | 5,729 | $61,000 | $257,559 | 4.2x |
| 94 | Burlington | 94 | 59,610 | $56,880 | $256,022 | 4.5x |
| 95 | Sanford | 94 | 31,478 | $57,586 | $291,206 | 5.1x |
| 96 | Smithfield | 94 | 12,116 | $43,270 | $293,391 | 6.8x |
| 97 | Washington | 94 | 9,726 | $40,186 | $242,528 | 6.0x |
| 98 | Oxford | 94 | 8,914 | $43,054 | $255,873 | 5.9x |
| 99 | Zebulon | 94 | 8,711 | $79,112 | $341,721 | 4.3x |
| 100 | Winston-Salem | 93 | 252,037 | $59,268 | $264,333 | 4.5x |
Source: U.S. Census ACS 2020-2024, Zillow research. 140 places with more than 5,000 residents.
Summary
Summary: Taking A Chunk Out Of Your Paycheck In North Carolina For 2026
Well, there you have it, the places in North Carolina that have the highest cost of living, with Marvin ranking as the most expensive city in the Tar Heel State.
The most expensive cities in North Carolina are Marvin, Weddington, St. James, Oak Ridge, Chapel Hill, Davidson, Carrboro, Wesley Chapel, Holly Springs, and Waxhaw.


