Most Hispanic/Latino cities in New Hampshire research summary. We used Saturday Night Science to analyze New Hampshire’s most recent Census data to determine the most Hispanic/Latino cities based on the percentage of Hispanic/Latino residents.
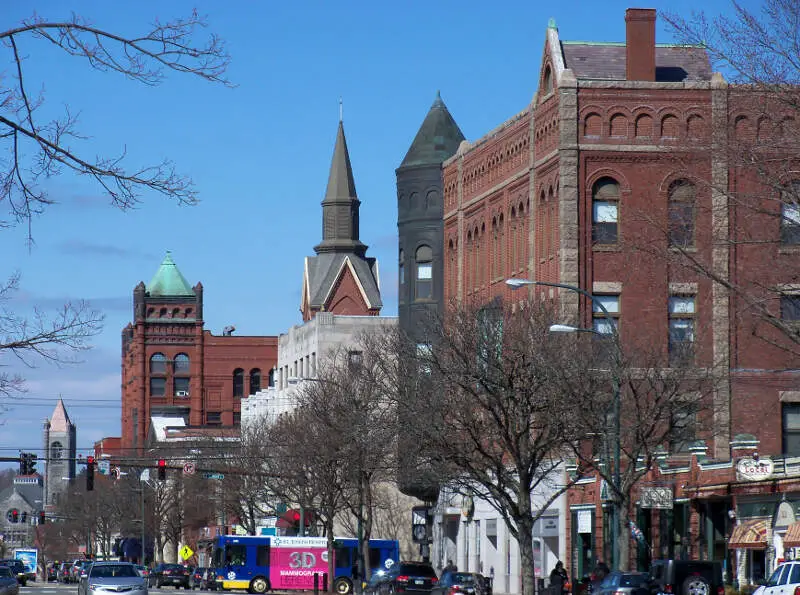
14.7% Hispanic · #1 most Hispanic in New Hampshire
Nashua is a city in Hillsborough County, New Hampshire, United States. As of the 2010 census, Nashua had a total population of 86,494, making it the second-largest city in the state after Manchester. As of 2016 the population had risen to an estimated 87,882.
Data | Crime | Cost of living | Movers
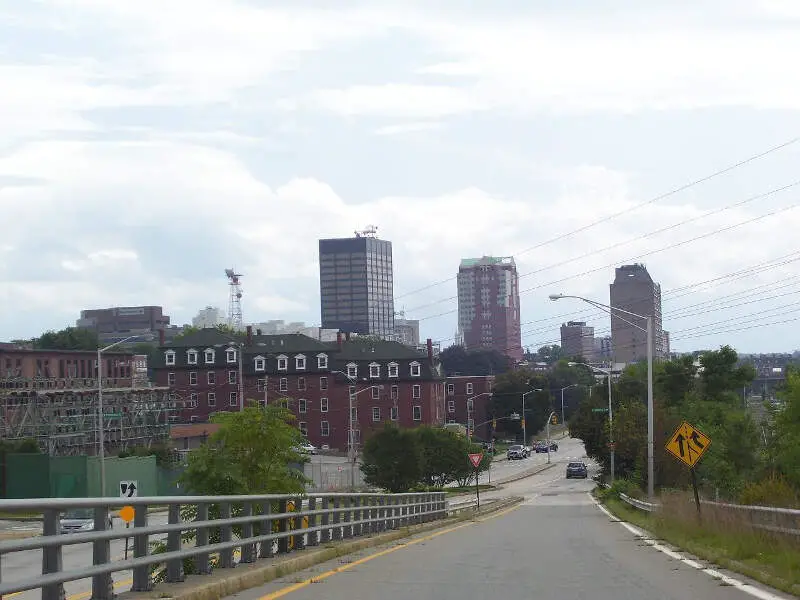
13.8% Hispanic · #2 most Hispanic in New Hampshire
Manchester is the most populous city in the U.S. state of New Hampshire and the largest city in northern New England, an area comprising the states of Maine, New Hampshire, and Vermont. As of the 2010 census, the city had a population of 109,565, and its estimated 2016 population was 110,506. It is one of two seats of Hillsborough County, the state of New Hampshire’s most populous county. Manchester is located near the northern end of the Northeast megalopolis, along the banks of the Merrimack River-which divides the city into eastern and western sections. It was first named by the merchant and inventor Samuel Blodgett. Blodget’s vision was to create a great industrial center similar to that of the original Manchester in England, which was the world’s first industrialized city.
Data | Crime | Cost of living | Movers
7.2% Hispanic · #3 most Hispanic in New Hampshire
Data | Movers
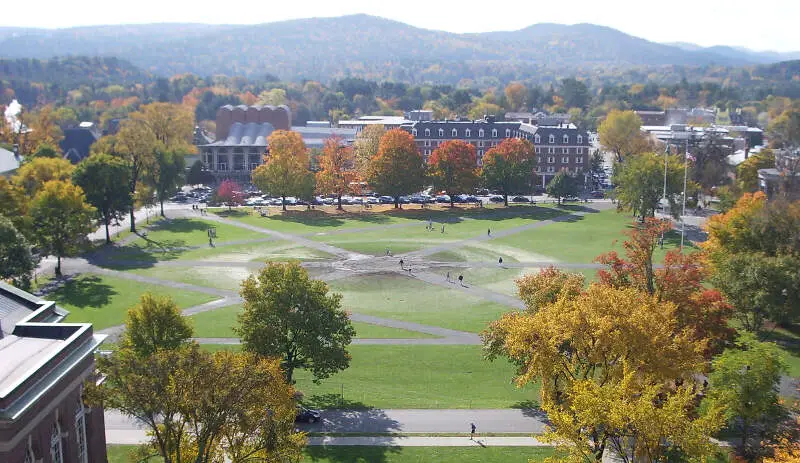
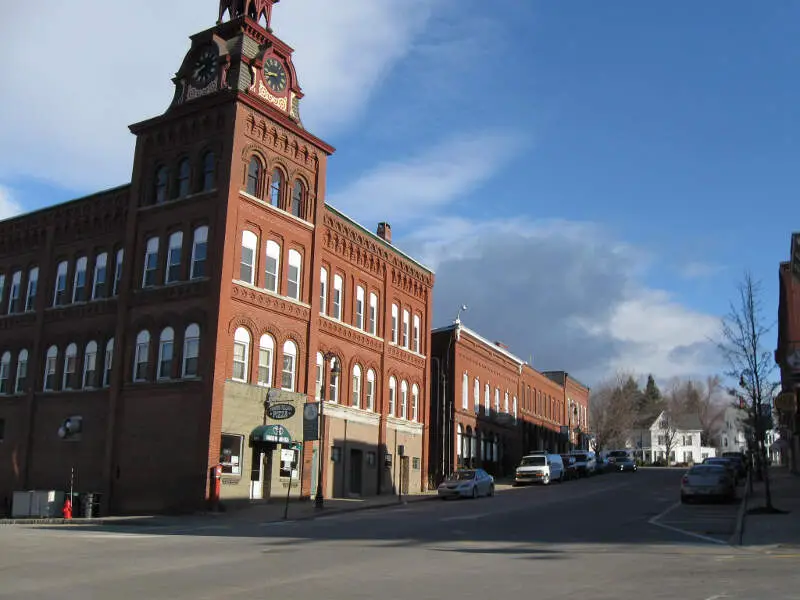
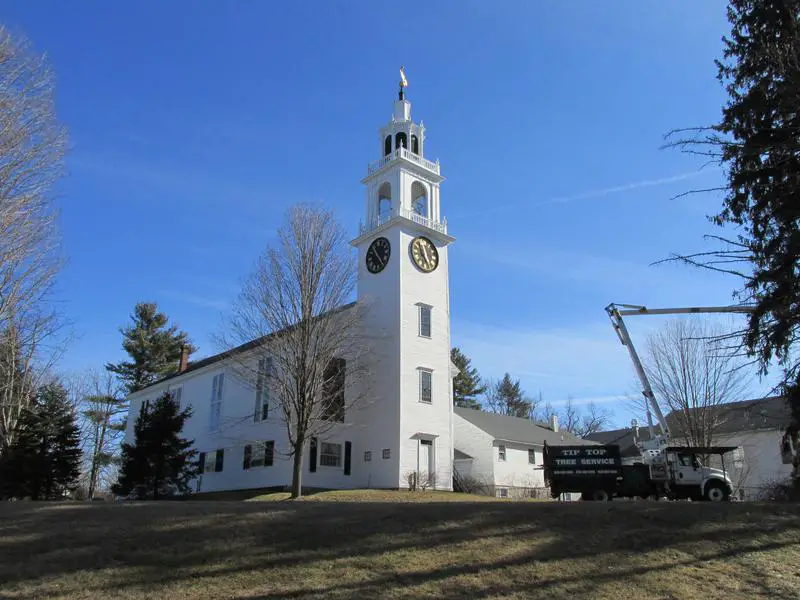
6.7% Hispanic · #4 most Hispanic in New Hampshire
Hanover is a town along the Connecticut River in Grafton County, New Hampshire, United States. The population was 11,260 at the 2010 census. CNN and Money magazine rated Hanover the sixth best place to live in America in 2011, and the second best in 2007. “This just might be the best college town,” read the headline of a story in the January-February 2017 issue of Yankee.
Data | Crime | Cost of living | Movers
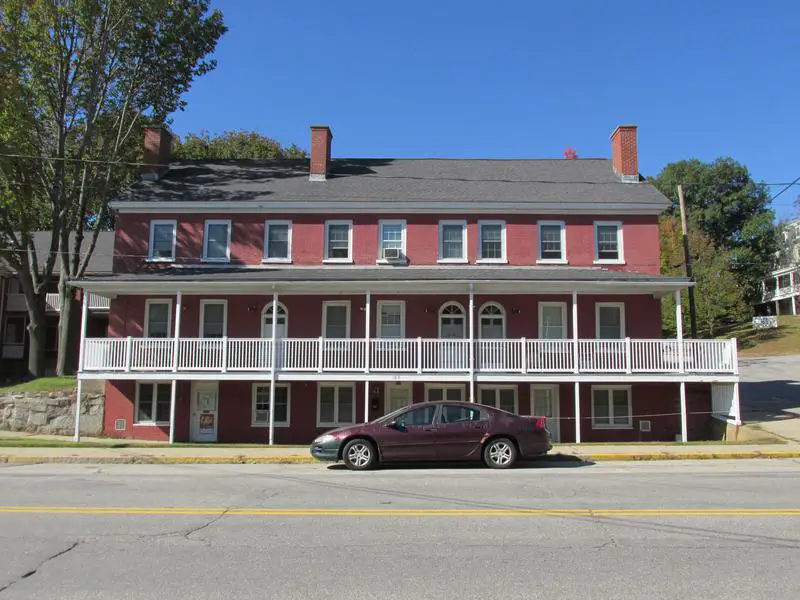
6.0% Hispanic · #5 most Hispanic in New Hampshire
Somersworth is a city in Strafford County, New Hampshire, United States. The population was 11,766 at the 2010 census. Somersworth has the smallest area and third-lowest population of New Hampshire’s 13 cities.
Data | Crime | Cost of living | Movers
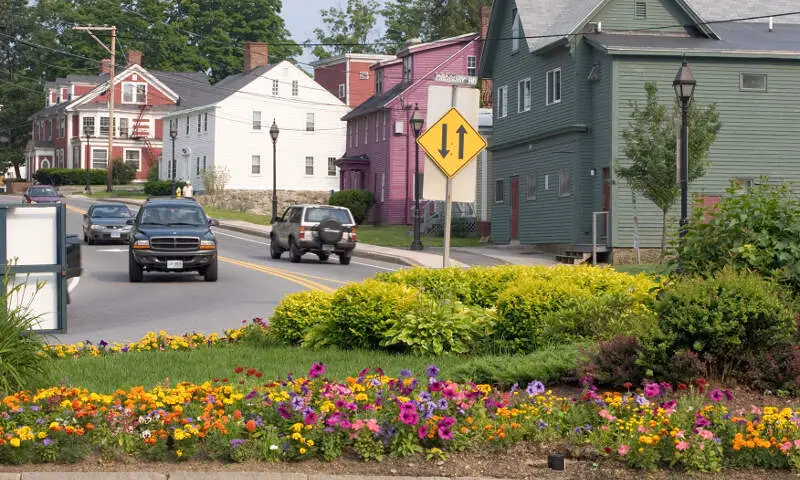
5.4% Hispanic · #6 most Hispanic in New Hampshire
Durham is a town in Strafford County, New Hampshire, United States. The population was 14,638 at the 2010 census. Durham is home to the University of New Hampshire.
Data | Crime | Cost of living | Movers
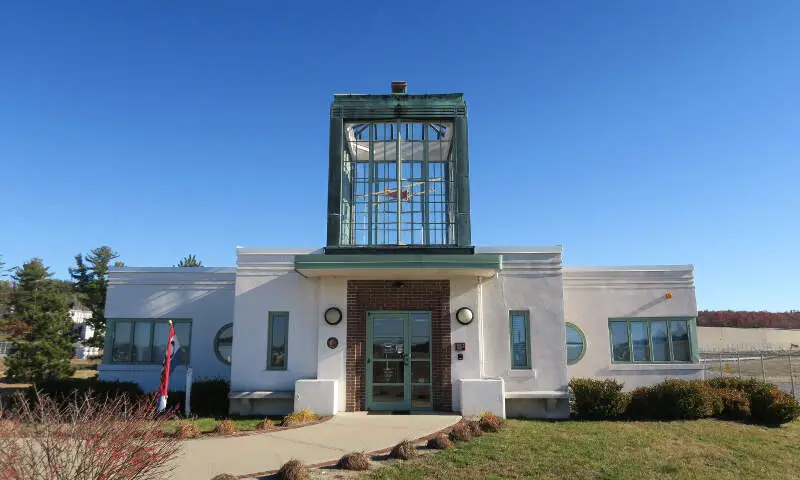
5.3% Hispanic · #7 most Hispanic in New Hampshire
Londonderry is a town in western Rockingham County, New Hampshire, United States. The town is bordered on the north by the city of Manchester and on the east by the town of Derry. The population was 24,129 at the 2010 census. Londonderry is known for its apple orchards and is home to the headquarters of Stonyfield Farm and partial home to Manchester-Boston Regional Airport.
Data | Crime | Cost of living | Movers

4.7% Hispanic · #8 most Hispanic in New Hampshire
Berlin is a city along the Androscoggin River in Cos County in northern New Hampshire, United States. The population was 10,051 at the 2010 census. It includes the village of Cascade. Located on the edge of the White Mountains, the city’s boundaries extend into the White Mountain National Forest. Berlin is home to the Berlin and Cos County Historical Society’s Moffett House Museum & Genealogy Center, Service Credit Union Heritage Park, the Berlin Fish Hatchery, and the White Mountains Community College, member of the Community College System of New Hampshire.
Data | Crime | Cost of living | Movers
4.5% Hispanic · #9 most Hispanic in New Hampshire
Derry is a town in Rockingham County, New Hampshire, United States. The population was 33,109 at the 2010 census. Although it is a town and not a city, Derry is the fourth most-populous community in the state. The town’s nickname, “Spacetown”, derives from the fact that Derry is the birthplace of Alan Shepard, the first astronaut from the United States in space. Derry was also for a time the home of the poet Robert Frost and his family.
Data | Crime | Cost of living | Movers
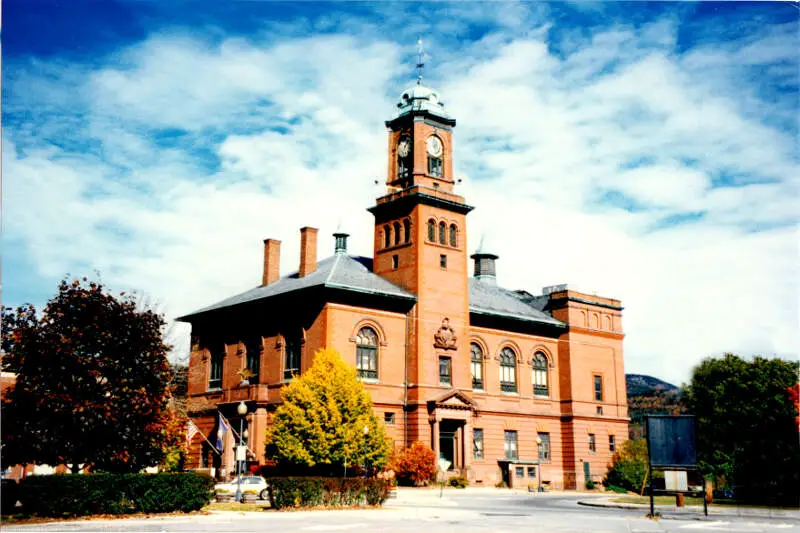
4.1% Hispanic · #10 most Hispanic in New Hampshire
Claremont is the only city in Sullivan County, New Hampshire, United States. The population was 13,355 at the 2010 census.
Data | Crime | Cost of living | Movers
The receipts
Compare the top ten
Pick a metric. The bars rescale. The red line is New Hampshire’s statewide median.
On the map
Where New Hampshire’s Hispanic and Latino communities live
Saturday Night Science
Methodology: How We Determined The Cities In New Hampshire With The Largest Hispanic Population For 2026
We used Saturday Night Science to compare data on race from the US Census for every city in New Hampshire.
New Hampshire’s most recently available data comes from the 2020-2024 American Community Survey.
Specifically, we looked at table B03002: Hispanic OR LATINO ORIGIN BY RACE. Here are the category names as defined by the Census:
- Hispanic or Latino
- White alone*
- Black or African American alone*
- American Indian and Alaska Native alone*
- Asian alone*
- Native Hawaiian and Other Pacific Islander alone*
- Some other race alone*
- Two or more races*
Our particular column of interest here was the number of people who identified as Hispanic or Latino.
We limited our analysis to places in New Hampshire with a population greater than 5,000 people. That left us with 24 cities.
We then calculated the percentage of Hispanic or Latino residents in each New Hampshire city. The percentages ranked from 14.7% to 0.2%.
Finally, we ranked each city based on the percentage of the Hispanic or Latino population, with a higher percentage being more Hispanic or Latino. Nashua was the most Hispanic or Latino, while Franklin was the least Hispanic or Latino city.
We updated this article for 2026. This article represents our eleventh time ranking the cities in New Hampshire with the largest Hispanic/Latino population.
The full plate
Cities In New Hampshire By Hispanic Population
Click any column to sort. Search by city name.
| Rank | City | Population | Hispanic Population | % Hispanic |
|---|---|---|---|---|
| 1 | Nashua | 91,294 | 13,465 | 14.7% |
| 2 | Manchester | 115,643 | 15,938 | 13.8% |
| 3 | Suncook | 5,432 | 389 | 7.2% |
| 4 | Hanover | 8,479 | 566 | 6.7% |
| 5 | Somersworth | 12,111 | 726 | 6.0% |
| 6 | Durham | 10,681 | 579 | 5.4% |
| 7 | Londonderry | 12,225 | 644 | 5.3% |
| 8 | Berlin | 9,383 | 444 | 4.7% |
| 9 | Derry | 21,339 | 964 | 4.5% |
| 10 | Claremont | 13,078 | 531 | 4.1% |
| 11 | Portsmouth | 22,545 | 864 | 3.8% |
| 12 | South Hooksett | 5,902 | 221 | 3.7% |
| 13 | Concord | 44,375 | 1,653 | 3.7% |
| 14 | Laconia | 17,085 | 601 | 3.5% |
| 15 | Dover | 33,364 | 1,168 | 3.5% |
| 16 | Exeter | 9,964 | 343 | 3.4% |
| 17 | Milford | 8,956 | 292 | 3.3% |
| 18 | Lebanon | 14,999 | 462 | 3.1% |
| 19 | Rochester | 33,144 | 730 | 2.2% |
| 20 | Hampton | 10,101 | 206 | 2.0% |
| 21 | Keene | 22,939 | 433 | 1.9% |
| 22 | Newmarket | 5,679 | 88 | 1.5% |
| 23 | Hudson | 7,469 | 87 | 1.2% |
| 24 | Franklin | 8,799 | 14 | 0.2% |
Source: U.S. Census ACS 2020-2024. 24 cities with more than 5,000 residents.
Summary
Summary: Hispanic or Latino Populations Across New Hampshire
According to the most recent data, this is an accurate list if you’re looking for a breakdown of Latino populations for each place across New Hampshire.
The most Hispanic/Latino cities in New Hampshire are Nashua, Manchester, Suncook, Hanover, Somersworth, Durham, Londonderry, Berlin, Derry, and Claremont. Not sold on New Hampshire? Take the two-minute Find Your Place quiz and see which state actually fits you.