Most Hispanic/Latino cities in Oklahoma research summary. We used Saturday Night Science to analyze Oklahoma’s most recent Census data to determine the most Hispanic/Latino cities based on the percentage of Hispanic/Latino residents.
61.3% Hispanic · #1 most Hispanic in Oklahoma
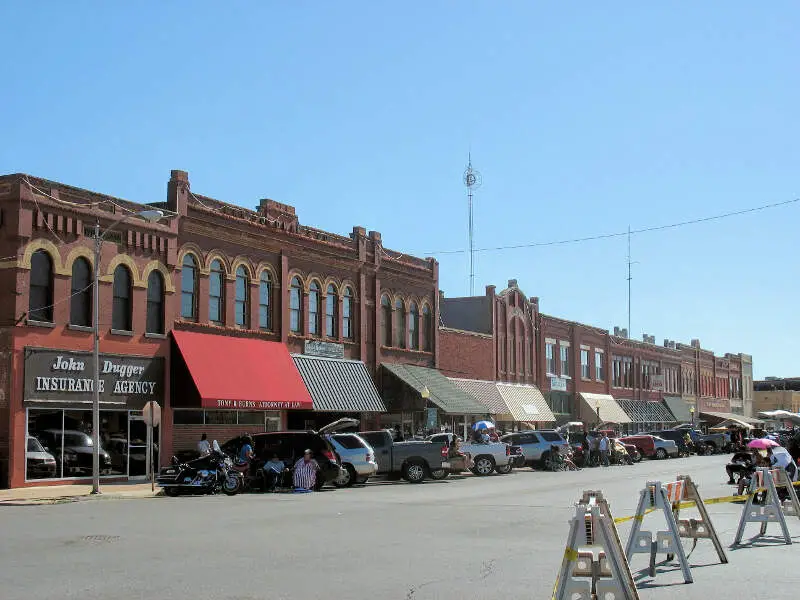
Guymon is a city in and the county seat of Texas County, Oklahoma. As of the 2010 census, the city population was 11,442, an increase of 6.5 percent from 10,472 in 2000. The 2012 census estimate grew to 11,930. Cattle feedlots, corporate pork farms, and natural gas dominate its economy, with wind energy production and transmission recently diversifying landowners’ farms.
Data | Crime | Cost of living | Movers
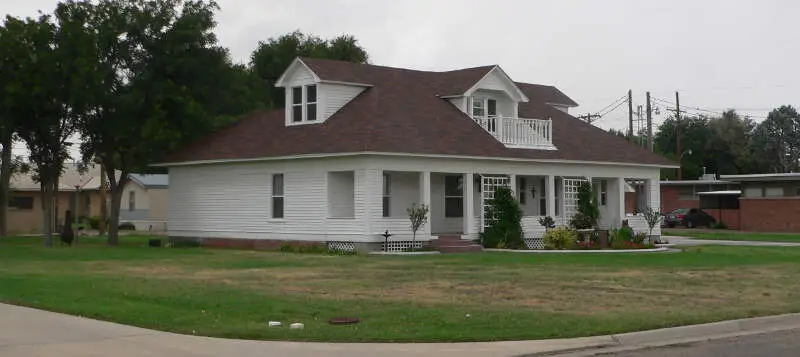
43.1% Hispanic · #2 most Hispanic in Oklahoma
Warr Acres is a city in Oklahoma County, Oklahoma, United States, and a part of the Oklahoma City metropolitan area. It was established after World War II by C.B. Warr, a dynamic businessman, builder, and commercial developer. The population was 10,043 at the 2010 census.
Data | Crime | Cost of living | Movers
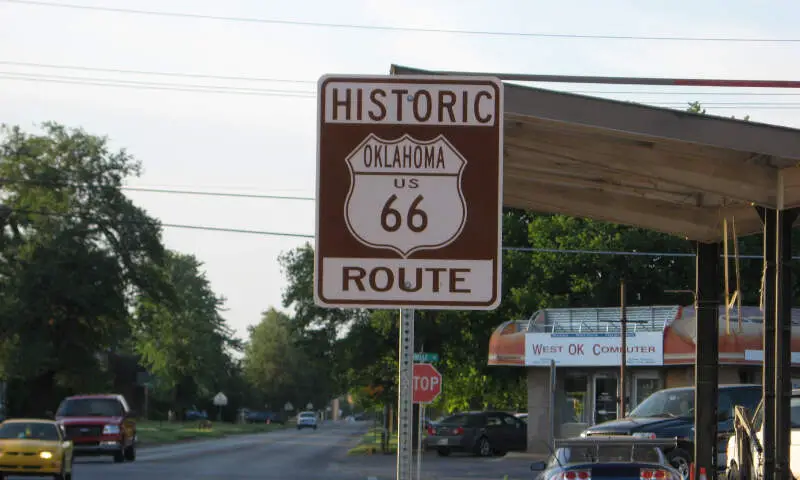
40.6% Hispanic · #3 most Hispanic in Oklahoma
Clinton is a city in Custer and Washita counties in the U.S. state of Oklahoma. The population was 9,556 at the 2015 census.
Data | Crime | Cost of living | Movers
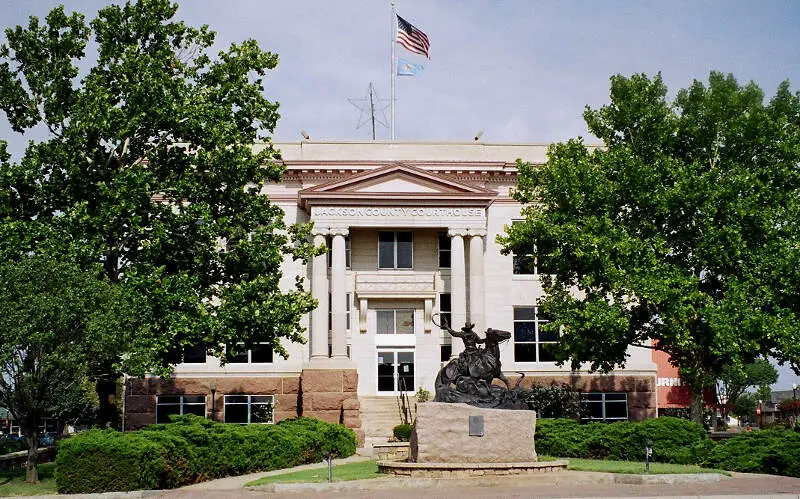
27.8% Hispanic · #4 most Hispanic in Oklahoma
Altus is a city and county seat in Jackson County, Oklahoma, United States. The population was 19,813 at the 2010 census, a loss of 7.7 percent compared to 21,454 at the 2000 census.
Data | Crime | Cost of living | Movers

25.3% Hispanic · #5 most Hispanic in Oklahoma
Bethany is a city in Oklahoma County, Oklahoma, United States, and a part of the Oklahoma City metropolitan area. The community was founded in 1909 by followers of the Church of the Nazarene from Oklahoma City.
Data | Crime | Cost of living | Movers
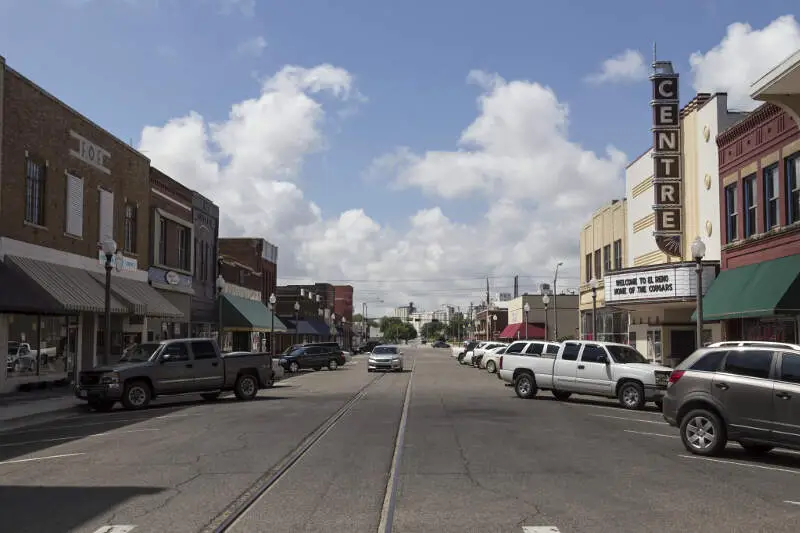
22.2% Hispanic · #6 most Hispanic in Oklahoma
El Reno is a city in and county seat of Canadian County, Oklahoma, United States. As of the 2010 census, the city population was 16,729. The city was begun shortly after the 1889 land rush and named for the nearby Fort Reno. It is located in the central part of the state, approximately 25 miles west of downtown Oklahoma City, and is part of the Oklahoma City Metropolitan Statistical Area.
Data | Crime | Cost of living | Movers
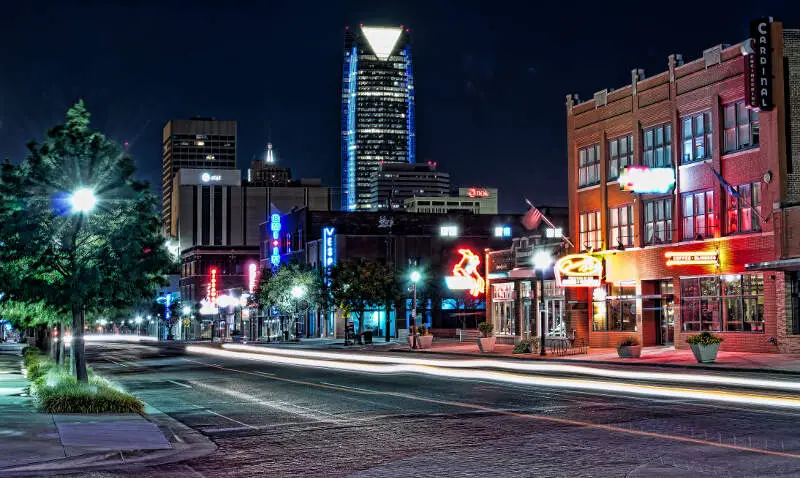
22.1% Hispanic · #7 most Hispanic in Oklahoma
Oklahoma City is the capital and largest city of the U.S. state of Oklahoma. The county seat of Oklahoma County, the city ranks 27th among United States cities in population. The population grew following the 2010 Census, with the population estimated to have increased to 631,346 as of July 2015. As of 2015, the Oklahoma City metropolitan area had a population of 1,358,452, and the Oklahoma City-Shawnee Combined Statistical Area had a population of 1,459,758 residents, making it Oklahoma’s largest metropolitan area.
Data | Crime | Cost of living | Movers
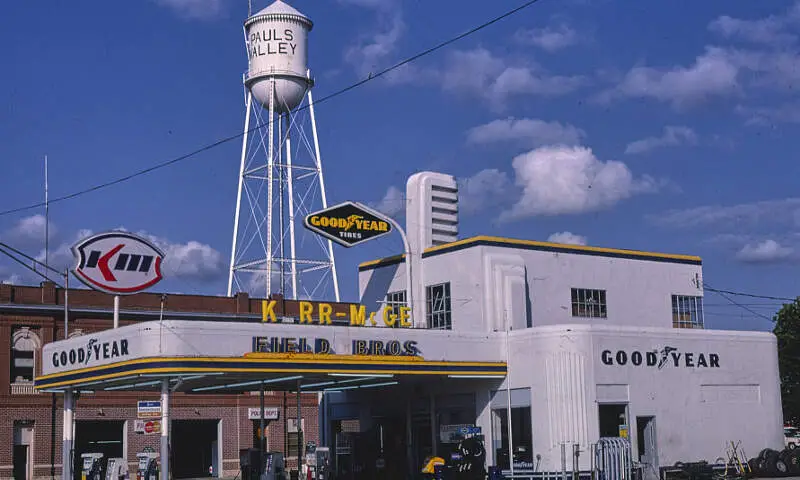
21.8% Hispanic · #8 most Hispanic in Oklahoma
Pauls Valley is a city in and the county seat of Garvin County, Oklahoma, United States. The population was 6,187 at the 2010 census, a decline of 1.1 percent from 6,256 at the 2000 census. It was settled by and named for Smith Paul, a North Carolina native who married a Chickasaw woman and became a citizen of the Chickasaw Nation before the Civil War. The town economy is largely based on agriculture and oil production.
Data | Crime | Cost of living | Movers
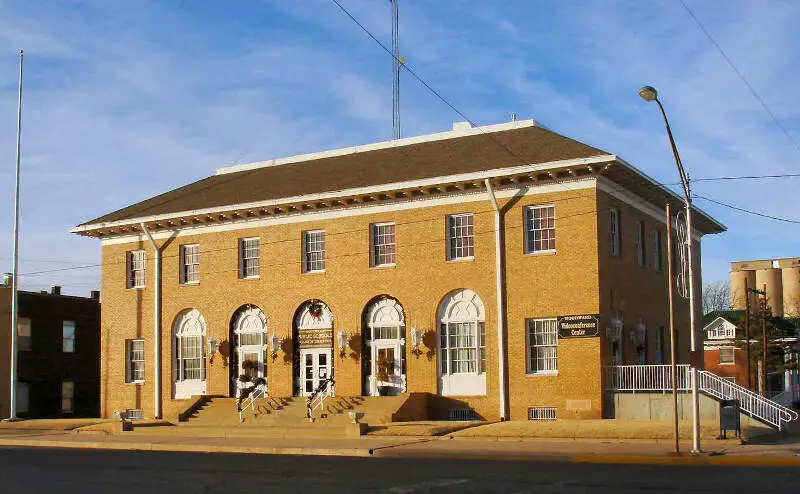
20.5% Hispanic · #9 most Hispanic in Oklahoma
Woodward is a city in and the county seat of Woodward County, Oklahoma, United States. It is the largest city in a nine-county area. The population was 12,051 at the 2010 census.
Data | Crime | Cost of living | Movers
20.4% Hispanic · #10 most Hispanic in Oklahoma
Anadarko is a city in Caddo County, Oklahoma, United States. This city is fifty miles southwest of Oklahoma City. The population was 6,762 at the 2010 census, a 1.8 percent gain from 6,645 at the 2000 census. It is the county seat of Caddo County.
Data | Crime | Cost of living | Movers
The receipts
Compare the top ten
Pick a metric. The bars rescale. The red line is Oklahoma’s statewide median.
On the map
Where Oklahoma’s Hispanic and Latino communities live
Saturday Night Science
Methodology: How We Determined The Cities In Oklahoma With The Largest Hispanic Population For 2026
We used Saturday Night Science to compare data on race from the US Census for every city in Oklahoma.
Oklahoma’s most recently available data comes from the 2020-2024 American Community Survey.
Specifically, we looked at table B03002: Hispanic OR LATINO ORIGIN BY RACE. Here are the category names as defined by the Census:
- Hispanic or Latino
- White alone*
- Black or African American alone*
- American Indian and Alaska Native alone*
- Asian alone*
- Native Hawaiian and Other Pacific Islander alone*
- Some other race alone*
- Two or more races*
Our particular column of interest here was the number of people who identified as Hispanic or Latino.
We limited our analysis to places in Oklahoma with a population greater than 5,000 people. That left us with 71 cities.
We then calculated the percentage of Hispanic or Latino residents in each Oklahoma city. The percentages ranked from 61.3% to 3.5%.
Finally, we ranked each city based on the percentage of the Hispanic or Latino population, with a higher percentage being more Hispanic or Latino. Guymon was the most Hispanic or Latino, while Coweta was the least Hispanic or Latino city.
We updated this article for 2026. This article represents our eleventh time ranking the cities in Oklahoma with the largest Hispanic/Latino population.
The full plate
Cities In Oklahoma By Hispanic Population
Click any column to sort. Search by city name.
| Rank | City | Population | Hispanic Population | % Hispanic |
|---|---|---|---|---|
| 1 | Guymon | 12,539 | 7,685 | 61.3% |
| 2 | Warr Acres | 10,466 | 4,515 | 43.1% |
| 3 | Clinton | 8,388 | 3,402 | 40.6% |
| 4 | Altus | 18,646 | 5,179 | 27.8% |
| 5 | Bethany | 20,560 | 5,194 | 25.3% |
| 6 | El Reno | 18,557 | 4,127 | 22.2% |
| 7 | Oklahoma City | 697,125 | 153,810 | 22.1% |
| 8 | Pauls Valley | 6,062 | 1,319 | 21.8% |
| 9 | Woodward | 11,882 | 2,439 | 20.5% |
| 10 | Anadarko | 5,572 | 1,136 | 20.4% |
| 11 | Tulsa | 413,794 | 81,887 | 19.8% |
| 12 | Elk City | 11,361 | 2,083 | 18.3% |
| 13 | Enid | 50,653 | 8,377 | 16.5% |
| 14 | Purcell | 6,803 | 1,119 | 16.4% |
| 15 | Lawton | 90,595 | 14,841 | 16.4% |
| 16 | Catoosa | 7,496 | 1,200 | 16.0% |
| 17 | Idabel | 6,987 | 1,107 | 15.8% |
| 18 | Poteau | 8,959 | 1,359 | 15.2% |
| 19 | Del City | 21,494 | 3,133 | 14.6% |
| 20 | Piedmont | 8,342 | 1,139 | 13.7% |
| 21 | Moore | 63,420 | 8,306 | 13.1% |
| 22 | Broken Arrow | 118,180 | 14,223 | 12.0% |
| 23 | Duncan | 22,958 | 2,688 | 11.7% |
| 24 | Owasso | 40,151 | 4,679 | 11.7% |
| 25 | Ardmore | 24,877 | 2,834 | 11.4% |
| 26 | Guthrie | 11,243 | 1,244 | 11.1% |
| 27 | Weatherford | 12,004 | 1,328 | 11.1% |
| 28 | Blackwell | 6,042 | 668 | 11.1% |
| 29 | Mustang | 22,192 | 2,451 | 11.0% |
| 30 | Ponca City | 24,326 | 2,525 | 10.4% |
| 31 | Durant | 19,746 | 1,955 | 9.9% |
| 32 | Tahlequah | 16,935 | 1,667 | 9.8% |
| 33 | Glenpool | 14,151 | 1,381 | 9.8% |
| 34 | Muskogee | 36,758 | 3,468 | 9.4% |
| 35 | Hugo | 5,182 | 481 | 9.3% |
| 36 | Norman | 129,672 | 11,879 | 9.2% |
| 37 | Jenks | 27,102 | 2,394 | 8.8% |
| 38 | Chickasha | 16,539 | 1,439 | 8.7% |
| 39 | Newcastle | 13,001 | 1,091 | 8.4% |
| 40 | Bixby | 30,155 | 2,434 | 8.1% |
| 41 | The Village | 9,447 | 761 | 8.1% |
| 42 | Ada | 16,575 | 1,335 | 8.1% |
| 43 | Cushing | 8,367 | 673 | 8.0% |
| 44 | Holdenville | 5,902 | 474 | 8.0% |
| 45 | Harrah | 6,684 | 520 | 7.8% |
| 46 | Midwest City | 58,297 | 4,494 | 7.7% |
| 47 | Claremore | 20,166 | 1,546 | 7.7% |
| 48 | Yukon | 25,529 | 1,957 | 7.7% |
| 49 | Choctaw | 12,303 | 911 | 7.4% |
| 50 | McAlester | 18,111 | 1,336 | 7.4% |
| 51 | Bartlesville | 37,878 | 2,710 | 7.2% |
| 52 | Henryetta | 5,608 | 398 | 7.1% |
| 53 | Sapulpa | 22,570 | 1,554 | 6.9% |
| 54 | Shawnee | 31,671 | 2,153 | 6.8% |
| 55 | Sand Springs | 20,117 | 1,341 | 6.7% |
| 56 | Miami | 12,926 | 861 | 6.7% |
| 57 | Edmond | 96,825 | 6,112 | 6.3% |
| 58 | Collinsville | 8,878 | 542 | 6.1% |
| 59 | Tuttle | 8,040 | 488 | 6.1% |
| 60 | Sallisaw | 8,605 | 515 | 6.0% |
| 61 | Seminole | 7,194 | 430 | 6.0% |
| 62 | Stillwater | 49,269 | 2,917 | 5.9% |
| 63 | Grove | 7,176 | 424 | 5.9% |
| 64 | Vinita | 5,300 | 299 | 5.6% |
| 65 | Pryor Creek | 9,569 | 498 | 5.2% |
| 66 | Noble | 7,493 | 372 | 5.0% |
| 67 | Blanchard | 9,215 | 455 | 4.9% |
| 68 | Wagoner | 8,082 | 367 | 4.5% |
| 69 | Tecumseh | 6,332 | 264 | 4.2% |
| 70 | Okmulgee | 11,348 | 419 | 3.7% |
| 71 | Coweta | 10,433 | 366 | 3.5% |
Source: U.S. Census ACS 2020-2024. 71 cities with more than 5,000 residents.
Summary
Summary: Hispanic or Latino Populations Across Oklahoma
According to the most recent data, this is an accurate list if you’re looking for a breakdown of Latino populations for each place across Oklahoma.
The most Hispanic/Latino cities in Oklahoma are Guymon, Warr Acres, Clinton, Altus, Bethany, El Reno, Oklahoma City, Pauls Valley, Woodward, and Anadarko.


