Most Hispanic/Latino cities in Wisconsin research summary. We used Saturday Night Science to analyze Wisconsin’s most recent Census data to determine the most Hispanic/Latino cities based on the percentage of Hispanic/Latino residents.
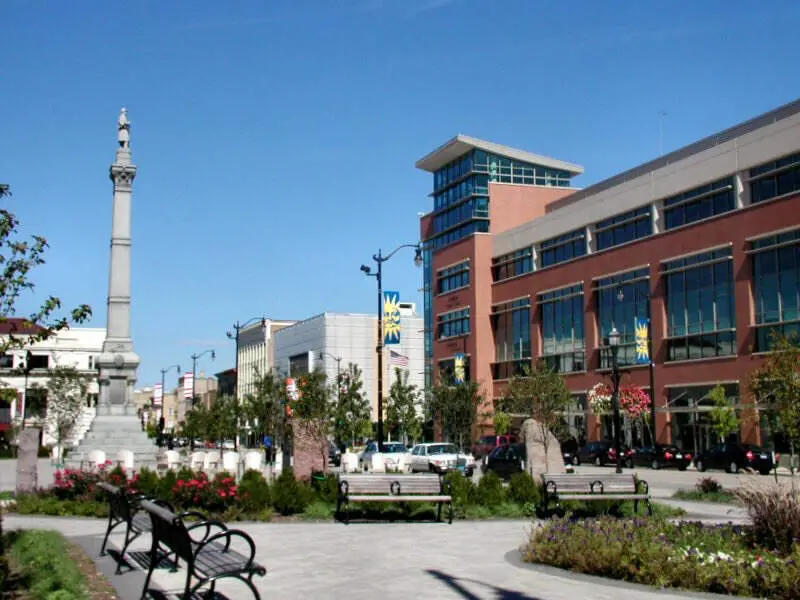
24.4% Hispanic · #1 most Hispanic in Wisconsin
Racine is a city in and the county seat of Racine County, Wisconsin, United States. It is located on the shore of Lake Michigan at the mouth of the Root River. Racine is located 22 miles south of Milwaukee. As of the 2013 U.S. census, the city had a population of 78,199, making it the fifth-largest city in Wisconsin. Its median home price of $103,625 makes it one of the most affordable cities in Wisconsin to buy a home. In January 2017, it was rated “the most affordable place to live in the world” by the Demographia International Housing Affordability survey. Also in 2017, Racine was ranked the fourth worst city in America for black residents.
Data | Crime | Cost of living | Movers
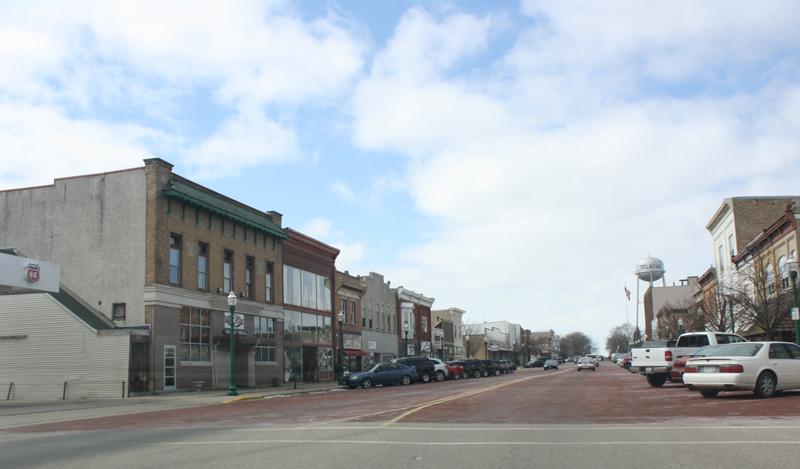
21.8% Hispanic · #2 most Hispanic in Wisconsin
Delavan is a city in Walworth County, Wisconsin, United States. The population was 8,463 at the 2010 census. The city is located partially within the Town of Delavan but the two entities are politically independent. City events include the Delavan Train Show in March, Cinco de Mayo in May, Heritage Fest in August, and Scarecrow Fest in September.
Data | Crime | Cost of living | Movers
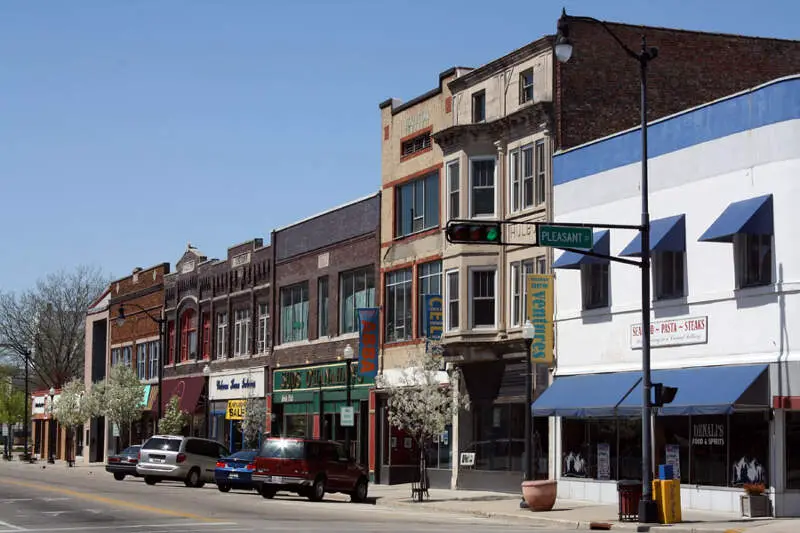
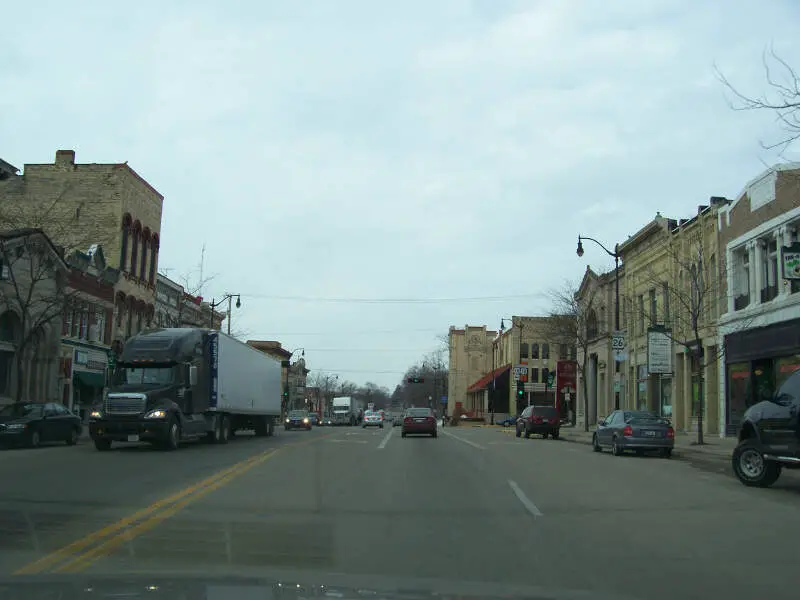
21.0% Hispanic · #3 most Hispanic in Wisconsin
Beloit is a city in Rock County, Wisconsin, United States. As of the 2010 census, the city had a population of 36,966.
Data | Crime | Cost of living | Movers
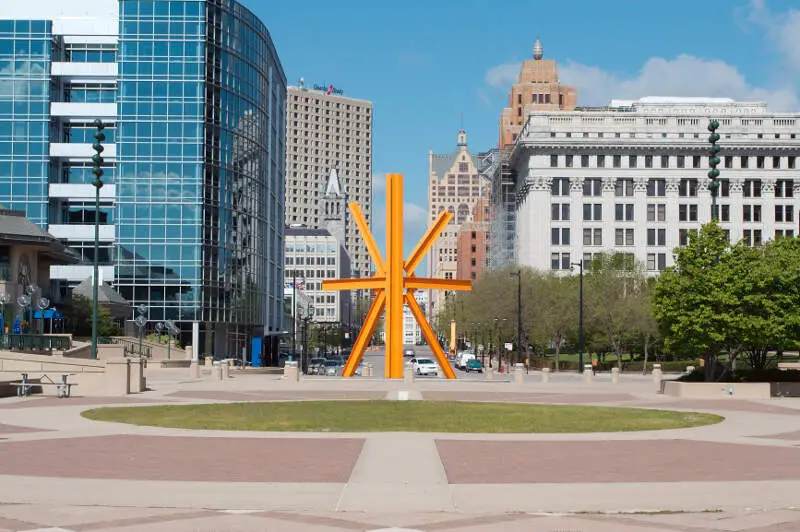
20.9% Hispanic · #4 most Hispanic in Wisconsin
Milwaukee is the largest city in the state of Wisconsin and the fifth-largest city in the Midwestern United States. The county seat of Milwaukee County, it is on Lake Michigan’s western shore. Ranked by estimated 2014 population, Milwaukee was the 31st largest city in the United States. The city’s estimated population in 2015 was 600,155. Milwaukee is the main cultural and economic center of the Milwaukee metropolitan area. It is also part of the larger Milwaukee-Racine-Waukesha combined statistical area, which had an estimated population of 2,026,243 in the 2010 census.
Data | Crime | Cost of living | Movers
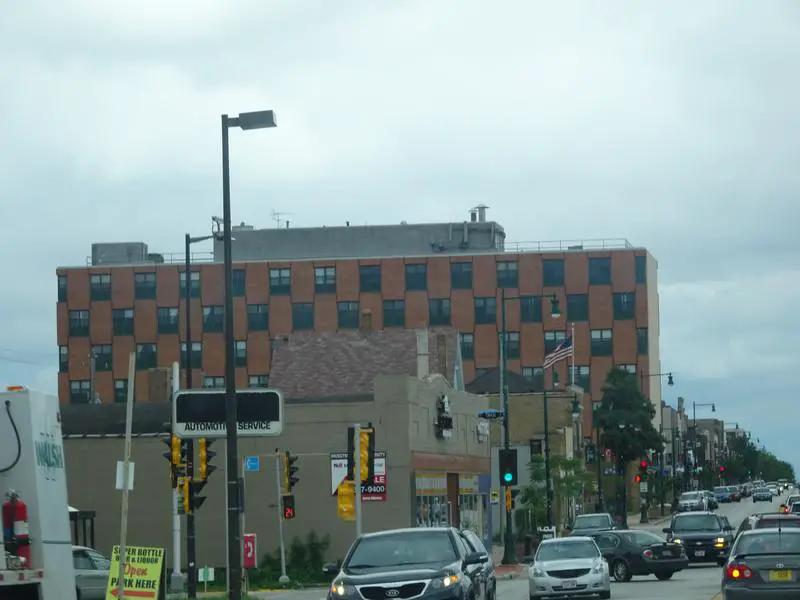
19.2% Hispanic · #5 most Hispanic in Wisconsin
Kenosha is a city in and the county seat of Kenosha County, Wisconsin, United States. Kenosha is on the southwestern shore of Lake Michigan. With an estimated population of 99,889 as of July 1, 2013, it is the fourth-largest city in Wisconsin and the fourth-largest city on Lake Michigan. The city is part of the United States Census Bureau’s Chicago Combined Statistical Area.
Data | Crime | Cost of living | Movers
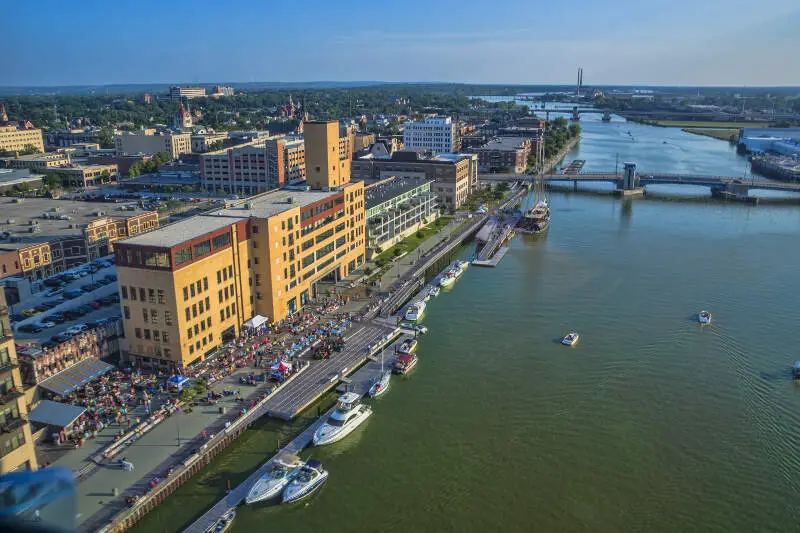
18.8% Hispanic · #6 most Hispanic in Wisconsin
Green Bay is a city in and the county seat of Brown County in the U.S. state of Wisconsin, at the head of Green Bay, a sub-basin of Lake Michigan, at the mouth of the Fox River. It is 581 feet above sea level and 112 miles north of Milwaukee. The population was 104,057 at the 2010 census. Green Bay is the third-largest city in the state of Wisconsin, after Milwaukee and Madison, and the third-largest city on Lake Michigan’s west shore, after Chicago and Milwaukee. Green Bay is home to the National Football League team Green Bay Packers.
Data | Crime | Cost of living | Movers
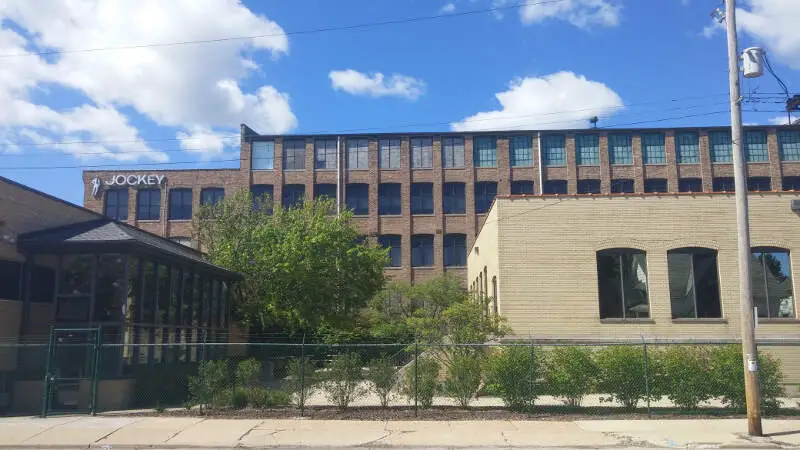
17.1% Hispanic · #7 most Hispanic in Wisconsin
West Allis is a city in Milwaukee County, Wisconsin, United States. A suburb of Milwaukee, it is part of the Milwaukee metropolitan area. The population was 60,411 at the 2010 census.
Data | Crime | Cost of living | Movers
16.6% Hispanic · #8 most Hispanic in Wisconsin
Greenfield is a city in Milwaukee County, Wisconsin, United States. A suburb of Milwaukee, Greenfield is one of many bedroom communities in the Milwaukee metropolitan area. The population was 36,720 at the 2010 census.
Data | Crime | Cost of living | Movers
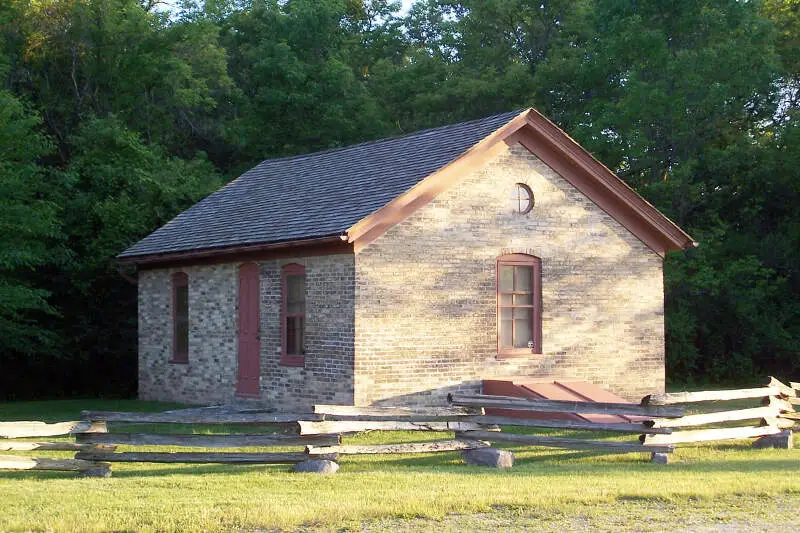
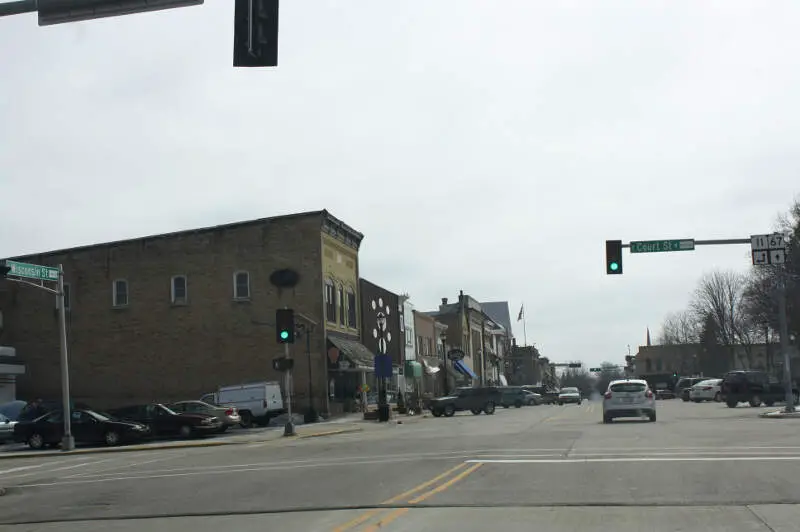
14.6% Hispanic · #9 most Hispanic in Wisconsin
Jefferson is a city in Jefferson County, Wisconsin, United States, and is its county seat. It is at the confluence of the Rock and Crawfish rivers. The population was 7,973 at the 2010 census. The city is partially bordered by the Town of Jefferson.
Data | Crime | Cost of living | Movers
14.5% Hispanic · #10 most Hispanic in Wisconsin
Elkhorn is a city in Walworth County, Wisconsin, United States. It is southwest of Milwaukee and northwest of Chicago. The population was 10,084 at the 2010 census. It is the county seat.
Data | Crime | Cost of living | Movers
The receipts
Compare the top ten
Pick a metric. The bars rescale. The red line is Wisconsin’s statewide median.
On the map
Where Wisconsin’s Hispanic and Latino communities live
Saturday Night Science
Methodology: How We Determined The Cities In Wisconsin With The Largest Hispanic Population For 2026
We used Saturday Night Science to compare data on race from the US Census for every city in Wisconsin.
Wisconsin’s most recently available data comes from the 2020-2024 American Community Survey.
Specifically, we looked at table B03002: Hispanic OR LATINO ORIGIN BY RACE. Here are the category names as defined by the Census:
- Hispanic or Latino
- White alone*
- Black or African American alone*
- American Indian and Alaska Native alone*
- Asian alone*
- Native Hawaiian and Other Pacific Islander alone*
- Some other race alone*
- Two or more races*
Our particular column of interest here was the number of people who identified as Hispanic or Latino.
We limited our analysis to places in Wisconsin with a population greater than 5,000 people. That left us with 137 cities.
We then calculated the percentage of Hispanic or Latino residents in each Wisconsin city. The percentages ranked from 24.4% to 0.7%.
Finally, we ranked each city based on the percentage of the Hispanic or Latino population, with a higher percentage being more Hispanic or Latino. Racine was the most Hispanic or Latino, while Richfield was the least Hispanic or Latino city.
We updated this article for 2026. This article represents our eleventh time ranking the cities in Wisconsin with the largest Hispanic/Latino population.
The full plate
Cities In Wisconsin By Hispanic Population
Click any column to sort. Search by city name.
| Rank | City | Population | Hispanic Population | % Hispanic |
|---|---|---|---|---|
| 1 | Racine | 77,633 | 18,969 | 24.4% |
| 2 | Delavan | 8,689 | 1,893 | 21.8% |
| 3 | Beloit | 36,534 | 7,680 | 21.0% |
| 4 | Milwaukee | 566,973 | 118,591 | 20.9% |
| 5 | Kenosha | 99,372 | 19,032 | 19.2% |
| 6 | Green Bay | 106,253 | 19,965 | 18.8% |
| 7 | West Allis | 59,612 | 10,196 | 17.1% |
| 8 | Greenfield | 37,345 | 6,201 | 16.6% |
| 9 | Jefferson | 7,732 | 1,128 | 14.6% |
| 10 | Elkhorn | 10,221 | 1,482 | 14.5% |
| 11 | Fitchburg | 32,619 | 4,695 | 14.4% |
| 12 | Reedsburg | 10,168 | 1,449 | 14.3% |
| 13 | Fort Atkinson | 12,463 | 1,715 | 13.8% |
| 14 | Middleton | 22,301 | 3,029 | 13.6% |
| 15 | Mount Pleasant | 27,953 | 3,749 | 13.4% |
| 16 | Sheboygan | 49,645 | 6,401 | 12.9% |
| 17 | Pleasant Prairie | 21,669 | 2,698 | 12.5% |
| 18 | Menasha | 18,273 | 2,255 | 12.3% |
| 19 | Waukesha | 71,233 | 8,765 | 12.3% |
| 20 | Caledonia | 25,257 | 3,077 | 12.2% |
| 21 | South Milwaukee | 20,442 | 2,489 | 12.2% |
| 22 | Oak Creek | 37,325 | 4,544 | 12.2% |
| 23 | Bellevue | 16,442 | 1,926 | 11.7% |
| 24 | St. Francis | 9,004 | 1,043 | 11.6% |
| 25 | Cudahy | 17,853 | 2,035 | 11.4% |
| 26 | Greendale | 14,594 | 1,646 | 11.3% |
| 27 | Berlin | 5,562 | 616 | 11.1% |
| 28 | Beaver Dam | 16,565 | 1,759 | 10.6% |
| 29 | Whitewater | 15,807 | 1,623 | 10.3% |
| 30 | Watertown | 22,774 | 2,153 | 9.5% |
| 31 | Madison | 278,001 | 26,165 | 9.4% |
| 32 | Fond du Lac | 44,494 | 4,162 | 9.4% |
| 33 | Waupun | 11,174 | 1,039 | 9.3% |
| 34 | Twin Lakes | 6,309 | 565 | 9.0% |
| 35 | Milton | 5,706 | 510 | 8.9% |
| 36 | Hales Corners | 7,689 | 682 | 8.9% |
| 37 | Lake Mills | 6,470 | 558 | 8.6% |
| 38 | Neenah | 27,336 | 2,330 | 8.5% |
| 39 | Brown Deer | 12,564 | 1,067 | 8.5% |
| 40 | Sturtevant | 6,772 | 556 | 8.2% |
| 41 | Burlington | 10,987 | 899 | 8.2% |
| 42 | DeForest | 11,501 | 912 | 7.9% |
| 43 | Monroe | 10,587 | 830 | 7.8% |
| 44 | Janesville | 66,030 | 5,124 | 7.8% |
| 45 | Mukwonago | 8,415 | 636 | 7.6% |
| 46 | Waunakee | 15,687 | 1,140 | 7.3% |
| 47 | New London | 7,726 | 547 | 7.1% |
| 48 | Two Rivers | 11,231 | 768 | 6.8% |
| 49 | Plover | 13,884 | 937 | 6.7% |
| 50 | Shorewood | 13,627 | 904 | 6.6% |
| 51 | Appleton | 75,023 | 4,935 | 6.6% |
| 52 | Manitowoc | 34,620 | 2,271 | 6.6% |
| 53 | Portage | 10,236 | 659 | 6.4% |
| 54 | Glendale | 13,656 | 865 | 6.3% |
| 55 | Sparta | 9,950 | 617 | 6.2% |
| 56 | Edgerton | 6,014 | 372 | 6.2% |
| 57 | Richland Center | 5,109 | 315 | 6.2% |
| 58 | Franklin | 35,886 | 2,192 | 6.1% |
| 59 | Sturgeon Bay | 9,806 | 597 | 6.1% |
| 60 | Hartford | 15,821 | 963 | 6.1% |
| 61 | Hobart | 10,610 | 645 | 6.1% |
| 62 | Lake Geneva | 8,521 | 511 | 6.0% |
| 63 | Muskego | 25,406 | 1,512 | 6.0% |
| 64 | New Berlin | 40,270 | 2,280 | 5.7% |
| 65 | Ripon | 7,772 | 435 | 5.6% |
| 66 | Wausau | 39,996 | 2,169 | 5.4% |
| 67 | Delafield | 7,202 | 380 | 5.3% |
| 68 | Whitefish Bay | 14,665 | 763 | 5.2% |
| 69 | Rice Lake | 9,030 | 455 | 5.0% |
| 70 | Verona | 15,232 | 764 | 5.0% |
| 71 | Wauwatosa | 48,529 | 2,427 | 5.0% |
| 72 | Cottage Grove | 8,513 | 425 | 5.0% |
| 73 | Altoona | 8,878 | 443 | 5.0% |
| 74 | Hartland | 9,972 | 497 | 5.0% |
| 75 | Little Chute | 11,754 | 574 | 4.9% |
| 76 | Platteville | 11,499 | 554 | 4.8% |
| 77 | Menomonee Falls | 39,539 | 1,902 | 4.8% |
| 78 | Ashwaubenon | 17,314 | 816 | 4.7% |
| 79 | Waupaca | 6,283 | 296 | 4.7% |
| 80 | Sun Prairie | 37,570 | 1,766 | 4.7% |
| 81 | Tomah | 9,532 | 448 | 4.7% |
| 82 | West Bend | 32,030 | 1,484 | 4.6% |
| 83 | Kaukauna | 17,706 | 816 | 4.6% |
| 84 | Hudson | 14,959 | 684 | 4.6% |
| 85 | Shawano | 9,522 | 429 | 4.5% |
| 86 | Stevens Point | 25,785 | 1,160 | 4.5% |
| 87 | Brookfield | 41,273 | 1,815 | 4.4% |
| 88 | Pewaukee | 8,196 | 360 | 4.4% |
| 89 | Kimberly | 7,447 | 326 | 4.4% |
| 90 | Ashland | 7,902 | 344 | 4.4% |
| 91 | Mequon | 25,270 | 1,089 | 4.3% |
| 92 | Cedarburg | 12,605 | 543 | 4.3% |
| 93 | Mount Horeb | 7,736 | 331 | 4.3% |
| 94 | Oshkosh | 66,729 | 2,842 | 4.3% |
| 95 | Antigo | 8,069 | 342 | 4.2% |
| 96 | Allouez | 13,975 | 587 | 4.2% |
| 97 | Pewaukee | 16,211 | 672 | 4.1% |
| 98 | Weston | 15,749 | 646 | 4.1% |
| 99 | Merrill | 9,356 | 377 | 4.0% |
| 100 | De Pere | 25,301 | 979 | 3.9% |
Source: U.S. Census ACS 2020-2024. 137 cities with more than 5,000 residents.
Summary
Summary: Hispanic or Latino Populations Across Wisconsin
According to the most recent data, this is an accurate list if you’re looking for a breakdown of Latino populations for each place across Wisconsin.
The most Hispanic/Latino cities in Wisconsin are Racine, Delavan, Beloit, Milwaukee, Kenosha, Green Bay, West Allis, Greenfield, Jefferson, and Elkhorn.