Most Native American places in South Dakota research summary. We used Saturday Night Science to research the South Dakota cities with the highest percentage of Native American residents for 2026. The data comes from the American Community Survey 2020-2024 vintage, which breaks down race by origin.
-
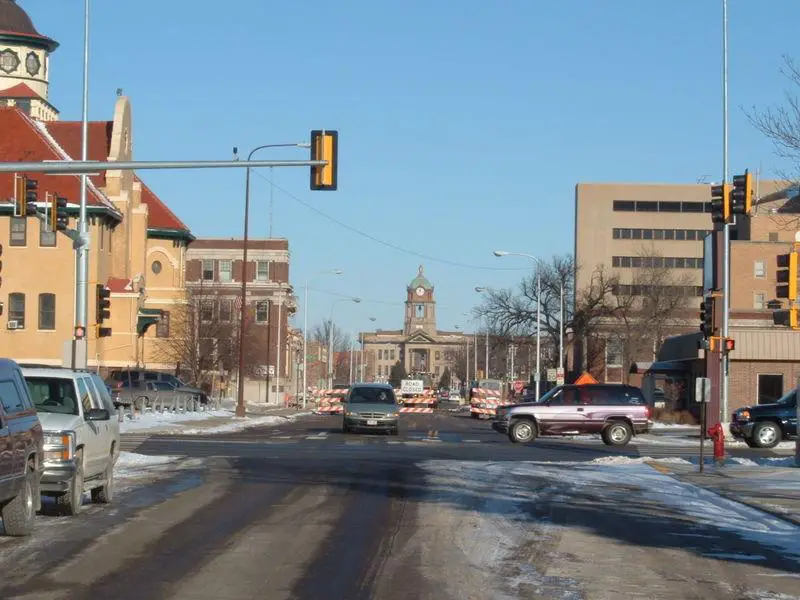
The city with the highest percentage of Native Americans is Pierre. 9.92% of people in Pierre are Native Americans.
-
The city with the lowest percentage of Native Americans is Brandon. 0.00% of people in Brandon are Native American.
-
The city with the most Native Americans is Rapid City. 5,496 people in Rapid City are Native American.
-
The city with the fewest Native Americans is Brandon. 0 people in Brandon are Native American.
-
The United States has 1,698,432 Native Americans and is 0.51% Native American.
Table Of Contents: Top Ten | Methodology | Summary | Table
The 10 Cities In South Dakota With The Largest Native American Population For 2026
Which city in South Dakota had the largest Native American population? The place with the largest Native American population in South Dakota for 2026 is Pierre. 9.92 of Pierre identify as Native American.
To see where South Dakota ranked as a state on diversity, we have a ranking of the most diverse states in America.
And if you already knew these places were Native American, check out the best places to live in South Dakota or the most diverse places in South Dakota.
Read below to see how we crunched the numbers and how your town ranked.
Cities In South Dakota With The Largest Native American Population For 2026

/10
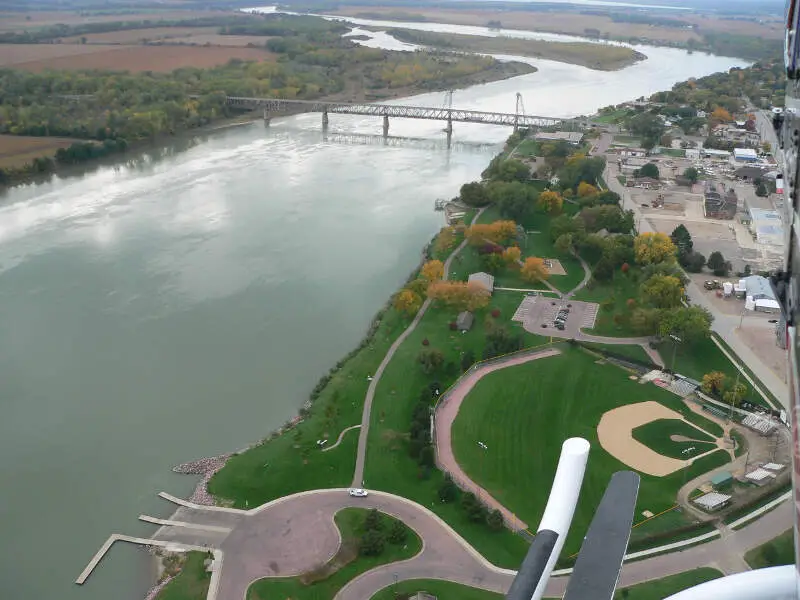
Population: 13,948
# Of Native American Residents: 1,384
% Native American: 9.92%
More on Pierre: Data | Crime | Cost Of Living | Movers

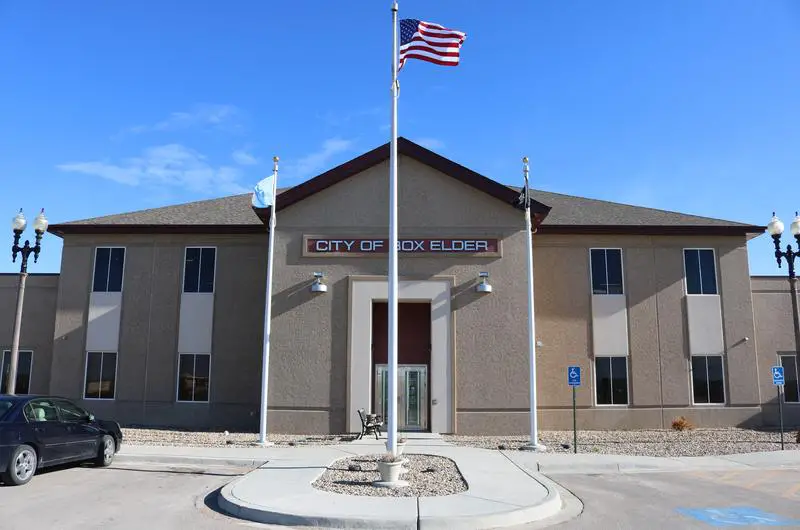
/10
Population: 12,902
# Of Native American Residents: 1,060
% Native American: 8.22%
More on Box Elder: Data | Crime | Cost Of Living | Movers

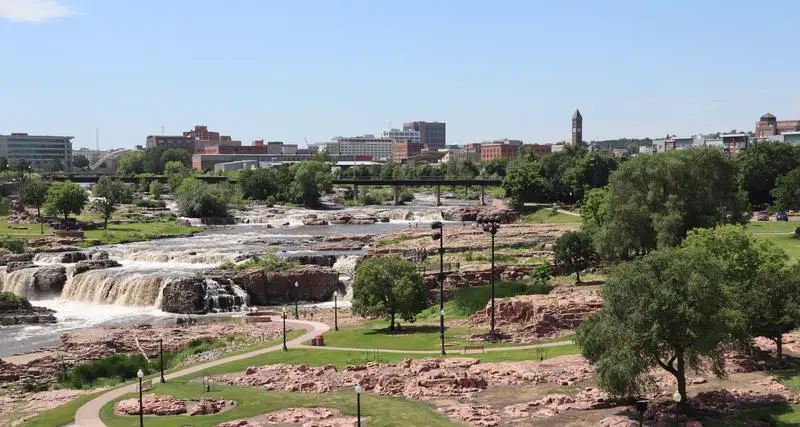
/10
Population: 77,946
# Of Native American Residents: 5,496
% Native American: 7.05%
More on Rapid City: Data | Crime | Cost Of Living | Movers

/10
Population: 15,649
# Of Native American Residents: 601
% Native American: 3.84%
More on Mitchell: Data | Crime | Cost Of Living | Movers

/10
Population: 28,189
# Of Native American Residents: 1,002
% Native American: 3.55%
More on Aberdeen: Data | Crime | Cost Of Living | Movers

/10
Population: 12,930
# Of Native American Residents: 447
% Native American: 3.46%
More on Spearfish: Data | Crime | Cost Of Living | Movers

/10
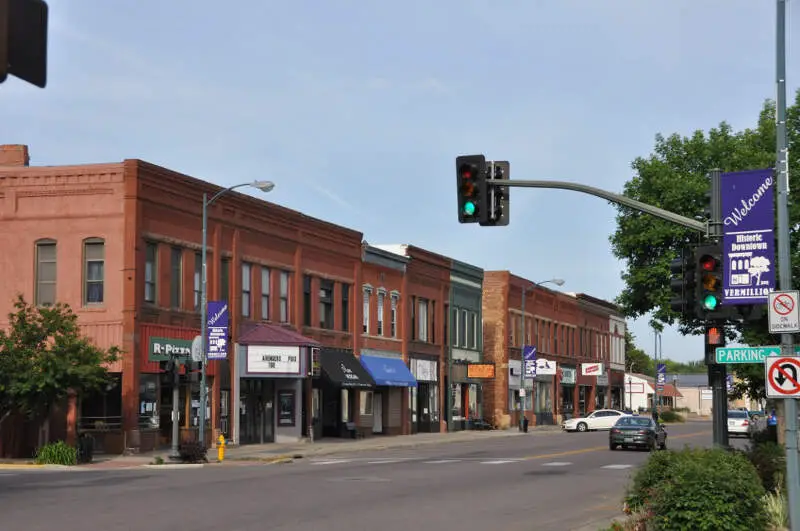
Population: 11,878
# Of Native American Residents: 358
% Native American: 3.01%
More on Vermillion: Data | Crime | Cost Of Living | Movers

/10
Population: 23,044
# Of Native American Residents: 530
% Native American: 2.3%
More on Watertown: Data | Crime | Cost Of Living | Movers

/10
Population: 15,540
# Of Native American Residents: 357
% Native American: 2.3%
More on Yankton: Data | Crime | Cost Of Living | Movers

/10
Population: 201,469
# Of Native American Residents: 3,332
% Native American: 1.65%
More on Sioux Falls: Data | Crime | Cost Of Living | Movers
Methodology: How We Determined The Cities In South Dakota With The Largest Native American Population For 2026
We still believe in the accuracy of data — especially from the Census. So that’s where we went to get the race breakdown across South Dakota.
We used Saturday Night Science to analyze the Census’s most recently available data, the 2020-2024 American Community Survey data.
Specifically, we looked at table B03002: Hispanic OR LATINO ORIGIN BY RACE. Here are the category names as defined by the Census:
- Hispanic or Latino
- White alone*
- Black or African American alone*
- American Indian and Alaska Native alone*
- Asian alone*
- Native Hawaiian and Other Pacific Islander alone*
- Some other race alone*
- Two or more races*
Our particular column of interest here was the number of people identifying as American Indian and Alaska Native alone.
We limited our analysis to places with a population greater than 5,000 people. That left us with 16 cities.
We then calculated the percentage of residents that are American Indian and Alaska Native. The percentages ranked from 9.92 to 0.00.
Finally, we ranked each city based on the percentage of the American Indian and Alaska Native population, with a higher score being more American Indian and Alaska Native than a lower score. Pierre took the distinction of being the most American Indian and Alaska Native, while Brandon was the least Native American city.
We updated this article for 2026. This article is our eleventh time ranking the cities in South Dakota with the largest Native American population.
Summary: Native American Populations Across South Dakota
If you’re looking for a breakdown of Native American populations across South Dakota according to the most recent data, this is an accurate list.
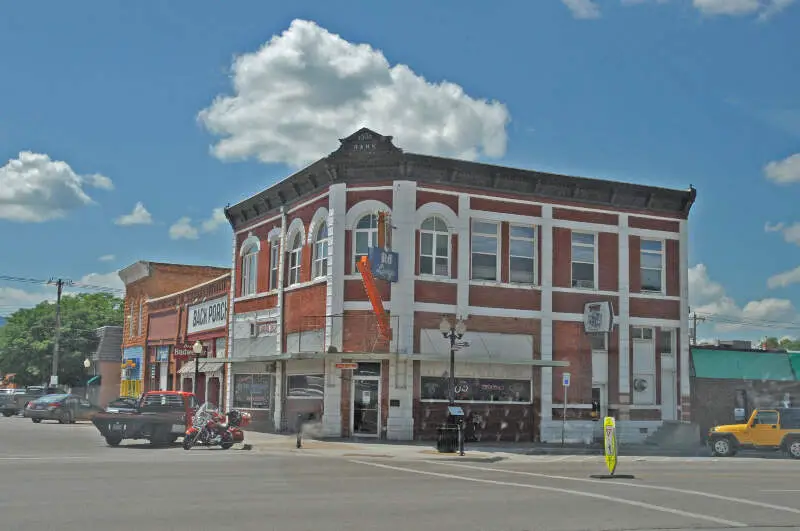
The most Native American cities in South Dakota are Pierre, Box Elder, Rapid City, Mitchell, Aberdeen, Spearfish, Vermillion, Watertown, Yankton, and Sioux Falls.
If you’re curious enough, here are the least Native American places in South Dakota:
- Brandon
- Belle Fourche
- Brookings
For more South Dakota reading, check out:
- Best Places To Raise A Family In South Dakota
- Best Places To Buy A House In South Dakota
- Richest Cities In South Dakota
Most Native American Places In South Dakota
| Rank | City | Population | Native American Population | % Native American |
|---|---|---|---|---|
| 1 | Pierre | 13,948 | 1,384 | 9.92% |
| 2 | Box Elder | 12,902 | 1,060 | 8.22% |
| 3 | Rapid City | 77,946 | 5,496 | 7.05% |
| 4 | Mitchell | 15,649 | 601 | 3.84% |
| 5 | Aberdeen | 28,189 | 1,002 | 3.55% |
| 6 | Spearfish | 12,930 | 447 | 3.46% |
| 7 | Vermillion | 11,878 | 358 | 3.01% |
| 8 | Watertown | 23,044 | 530 | 2.3% |
| 9 | Yankton | 15,540 | 357 | 2.3% |
| 10 | Sioux Falls | 201,469 | 3,332 | 1.65% |
| 11 | Sturgis | 7,086 | 99 | 1.4% |
| 12 | Huron | 14,385 | 186 | 1.29% |
| 13 | Madison | 6,094 | 52 | 0.85% |
| 14 | Brookings | 23,948 | 201 | 0.84% |
| 15 | Belle Fourche | 5,804 | 36 | 0.62% |
| 16 | Brandon | 10,996 | 0 | 0.0% |


