Fremont SnackAbility
Overall SnackAbility
Crime in Fremont summary. We use data from the FBI to determine the crime rates in Fremont. Key points include:
There were 400 total crimes in Fremont in the last reporting year.
The overall crime rate per 100,000 people in Fremont is 2,534.5 / 100k people.
The violent crime rate per 100,000 people in Fremont is 272.5 / 100k people.
The property crime rate per 100,000 people in Fremont is 2,262.1 / 100k people.
Overall, crime in Fremont is 19.60% above the national average.
Total Crimes
Above National Average
Crime In Fremont Comparison Table
| Statistic | Count Raw |
Fremont / 100k People |
Ohio / 100k People |
National / 100k People |
|---|---|---|---|---|
| Total Crimes Per 100K | 400 | 2,534.5 | 1,844.9 | 2,119.2 |
| Violent Crime | 43 | 272.5 | 293.7 | 359.0 |
| Murder | 1 | 6.3 | 5.0 | 5.0 |
| Robbery | 5 | 31.7 | 45.5 | 61.0 |
| Aggravated Assault | 35 | 221.8 | 197.4 | 256.0 |
| Property Crime | 357 | 2,262.1 | 1,551.2 | 1,760.0 |
| Burglary | 24 | 152.1 | 206.0 | 229.0 |
| Larceny | 321 | 2,034.0 | 1,132.8 | 1,272.0 |
| Car Theft | 12 | 76.0 | 212.5 | 259.0 |
Source: FBI Uniform Crime Reporting (2024)
Cost of living in Fremont summary. We use data on the cost of living to determine how expensive it is to live in Fremont. Real estate prices drive most of the variance in cost of living around Ohio. Key points include:
The cost of living in Fremont is 85 with 100 being average.
The cost of living in Fremont is 0.8x lower than the national average.
The median home value in Fremont is $173,490.
The median income in Fremont is $47,024.
Fremont's Overall Cost Of Living
Lower Than The National Average
Cost Of Living In Fremont Comparison Table
| Living Expense | Fremont | Ohio | National Average |
|---|---|---|---|
| Overall | 85 | 90 | 100 |
| Services | 94 | 97 | 100 |
| Groceries | 93 | 97 | 100 |
| Health | 59 | 75 | 100 |
| Housing | 98 | 97 | 100 |
| Transportation | 93 | 95 | 100 |
| Utilities | 96 | 97 | 100 |
Source: Cost of living index, normalized to US average = 100
Fremont, OH Weather
The average high in Fremont is 59.7° and the average low is 40.6°.
There are 81.0 days of precipitation each year.
Expect an average of 35.5 inches of precipitation each year with 25.6 inches of snow.
| Stat | Fremont |
|---|---|
| Average Annual High | 59.7 |
| Average Annual Low | 40.6 |
| Annual Precipitation Days | 81.0 |
| Average Annual Precipitation | 35.5 |
| Average Annual Snowfall | 25.6 |
Average High
Days of Rain
Source: NOAA climate normals (30-year)
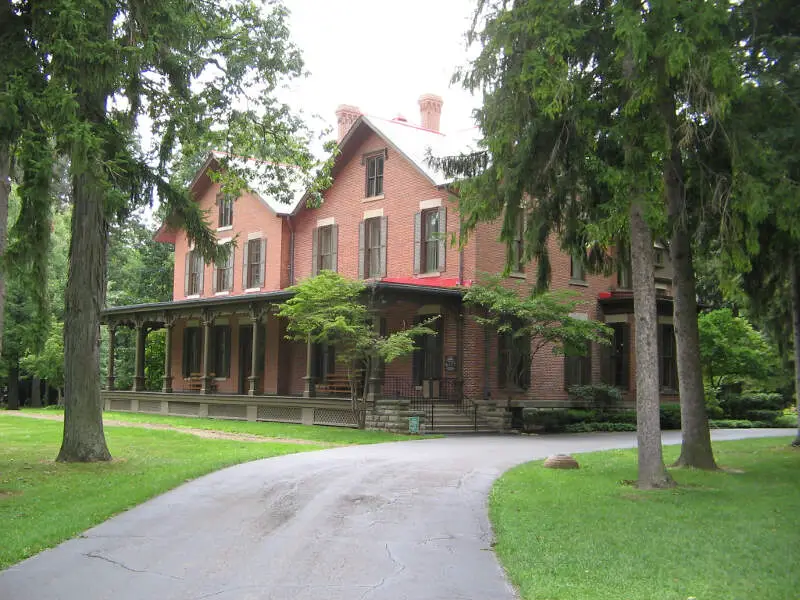
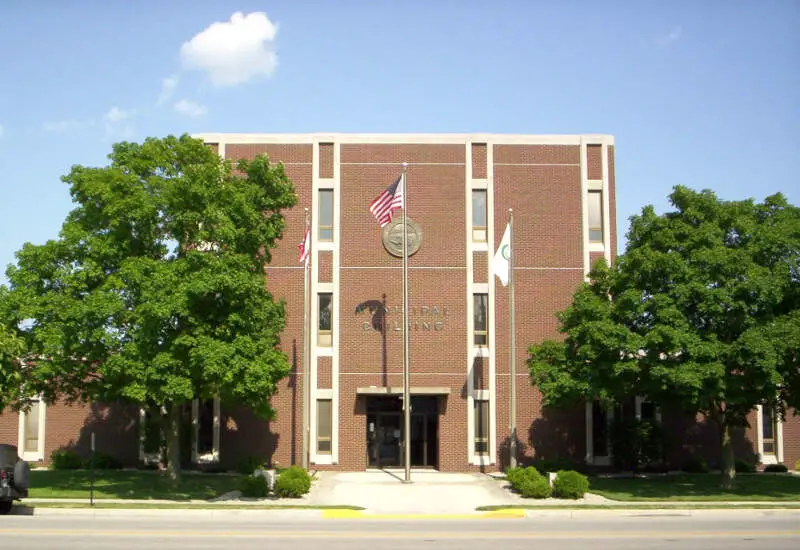
Fremont, OH Photos


Rankings & Articles For Fremont


Locations Around Fremont
Map Of Fremont, OH
Best Places Around Fremont
Perrysburg, OH
Population 25,181
Sylvania, OH
Population 19,055
Waterville, OH
Population 6,017
Huron, OH
Population 6,757
Rossford, OH
Population 6,323
Findlay, OH
Population 40,287
Bowling Green, OH
Population 29,983
Port Clinton, OH
Population 5,970
Maumee, OH
Population 13,715
Amherst, OH
Population 12,906
Fremont Demographics And Statistics
Population over time in Fremont
The current population in Fremont is 15,835. The population has decreased 6.6% from 2010.
| Year | Population | % Change |
|---|---|---|
| 2024 | 15,835 | -0.1% |
| 2023 | 15,851 | -0.3% |
| 2022 | 15,900 | -0.3% |
| 2021 | 15,954 | -0.3% |
| 2020 | 16,005 | -0.4% |
| 2019 | 16,073 | -0.6% |
| 2018 | 16,171 | -0.6% |
| 2017 | 16,265 | -0.8% |
| 2016 | 16,388 | -0.6% |
| 2015 | 16,484 | -0.4% |
| 2014 | 16,555 | -0.5% |
| 2013 | 16,633 | -0.5% |
| 2012 | 16,717 | -0.7% |
| 2011 | 16,839 | -0.7% |
| 2010 | 16,959 | - |
Race / Ethnicity in Fremont
See the full breakdown
Fremont is:
69.3% White with 10,981 White residents.
8.3% African American with 1,320 African American residents.
0.0% American Indian with 0 American Indian residents.
0.3% Asian with 48 Asian residents.
0.0% Hawaiian with 0 Hawaiian residents.
0.0% Other with 0 Other residents.
5.4% Two Or More with 854 Two Or More residents.
16.6% Hispanic with 2,632 Hispanic residents.
| Race | Fremont | OH | USA |
|---|---|---|---|
| White | 69.3% | 75.8% | 57.4% |
| African American | 8.3% | 12.0% | 11.9% |
| American Indian | 0.0% | 0.1% | 0.5% |
| Asian | 0.3% | 2.5% | 5.9% |
| Hawaiian | 0.0% | 0.0% | 0.2% |
| Other | 0.0% | 0.4% | 0.6% |
| Two Or More | 5.4% | 4.3% | 4.3% |
| Hispanic | 16.6% | 4.8% | 19.3% |
Gender in Fremont
See the full breakdown
Fremont is 50.3% female with 7,959 female residents.
Fremont is 49.7% male with 7,876 male residents.
| Gender | Fremont | OH | USA |
|---|---|---|---|
| Female | 50.3% | 50.7% | 50.5% |
| Male | 49.7% | 49.3% | 49.5% |
Highest level of educational attainment in Fremont for adults over 25
See the full breakdown
0.0% of adults in Fremont completed < 9th grade.
7.0% of adults in Fremont completed 9-12th grade.
46.0% of adults in Fremont completed high school / ged.
22.0% of adults in Fremont completed some college.
9.0% of adults in Fremont completed associate's degree.
12.0% of adults in Fremont completed bachelor's degree.
3.0% of adults in Fremont completed master's degree.
1.0% of adults in Fremont completed professional degree.
0.0% of adults in Fremont completed doctorate degree.
| Education | Fremont | OH | USA |
|---|---|---|---|
| < 9th Grade | 0.0% | 3.0% | 4.0% |
| 9-12th Grade | 7.0% | 6.0% | 6.0% |
| High School / GED | 46.0% | 32.0% | 26.0% |
| Some College | 22.0% | 19.0% | 19.0% |
| Associate's Degree | 9.0% | 9.0% | 9.0% |
| Bachelor's Degree | 12.0% | 19.0% | 22.0% |
| Master's Degree | 3.0% | 9.0% | 10.0% |
| Professional Degree | 1.0% | 2.0% | 2.0% |
| Doctorate Degree | 0.0% | 1.0% | 2.0% |
Household Income For Fremont, Ohio
See the full breakdown
9.6% of households in Fremont earn Less than $10,000.
5.8% of households in Fremont earn $10,000 to $14,999.
11.0% of households in Fremont earn $15,000 to $24,999.
10.6% of households in Fremont earn $25,000 to $34,999.
15.2% of households in Fremont earn $35,000 to $49,999.
19.3% of households in Fremont earn $50,000 to $74,999.
12.5% of households in Fremont earn $75,000 to $99,999.
7.9% of households in Fremont earn $100,000 to $149,999.
6.2% of households in Fremont earn $150,000 to $199,999.
1.9% of households in Fremont earn $200,000 or more.
| Income | Fremont | OH | USA |
|---|---|---|---|
| Less than $10,000 | 9.6% | 5.2% | 5.0% |
| $10,000 to $14,999 | 5.8% | 4.0% | 3.4% |
| $15,000 to $24,999 | 11.0% | 7.1% | 6.3% |
| $25,000 to $34,999 | 10.6% | 7.5% | 6.6% |
| $35,000 to $49,999 | 15.2% | 11.6% | 10.1% |
| $50,000 to $74,999 | 19.3% | 16.9% | 15.5% |
| $75,000 to $99,999 | 12.5% | 13.1% | 12.6% |
| $100,000 to $149,999 | 7.9% | 17.1% | 17.5% |
| $150,000 to $199,999 | 6.2% | 8.3% | 9.6% |
| $200,000 or more | 1.9% | 9.1% | 13.4% |
Source: U.S. Census ACS 5-year estimates (2024)


