Lock Haven, PA
Demographics And Statistics
Living In Lock Haven, Pennsylvania Summary
Life in Lock Haven research summary. HomeSnacks has been using Saturday Night Science to research the quality of life in Lock Haven over the past nine years using Census, FBI, Zillow, and other primary data sources. Based on the most recently available data, we found the following about life in Lock Haven:
The population in Lock Haven is 8,386.
The median home value in Lock Haven is $200,545.
The median income in Lock Haven is $40,131.
The cost of living in Lock Haven is 92 which is 0.9x lower than the national average.
The median rent in Lock Haven is $794.
The unemployment rate in Lock Haven is 8.8%.
The poverty rate in Lock Haven is 25.0%.
The average high in Lock Haven is 60.3° and the average low is 38.0°.
Table Of Contents
Lock Haven SnackAbility
Overall SnackAbility
Lock Haven, PA Cost Of Living
Cost of living in Lock Haven summary. We use data on the cost of living to determine how expensive it is to live in Lock Haven. Real estate prices drive most of the variance in cost of living around Pennsylvania. Key points include:
The cost of living in Lock Haven is 92 with 100 being average.
The cost of living in Lock Haven is 0.9x lower than the national average.
The median home value in Lock Haven is $200,545.
The median income in Lock Haven is $40,131.
Lock Haven's Overall Cost Of Living
Lower Than The National Average
Cost Of Living In Lock Haven Comparison Table
| Living Expense | Lock Haven | Pennsylvania | National Average | |
|---|---|---|---|---|
| Overall | 92 | 100 | 100 | |
| Services | 97 | 101 | 100 | |
| Groceries | 100 | 101 | 100 | |
| Health | 92 | 95 | 100 | |
| Housing | 71 | 93 | 100 | |
| Transportation | 110 | 108 | 100 | |
| Utilities | 105 | 108 | 100 | |
Lock Haven, PA Weather
The average high in Lock Haven is 60.3° and the average low is 38.0°.
There are 83.3 days of precipitation each year.
Expect an average of 41.5 inches of precipitation each year with 29.6 inches of snow.
| Stat | Lock Haven |
|---|---|
| Average Annual High | 60.3 |
| Average Annual Low | 38.0 |
| Annual Precipitation Days | 83.3 |
| Average Annual Precipitation | 41.5 |
| Average Annual Snowfall | 29.6 |
Average High
Days of Rain
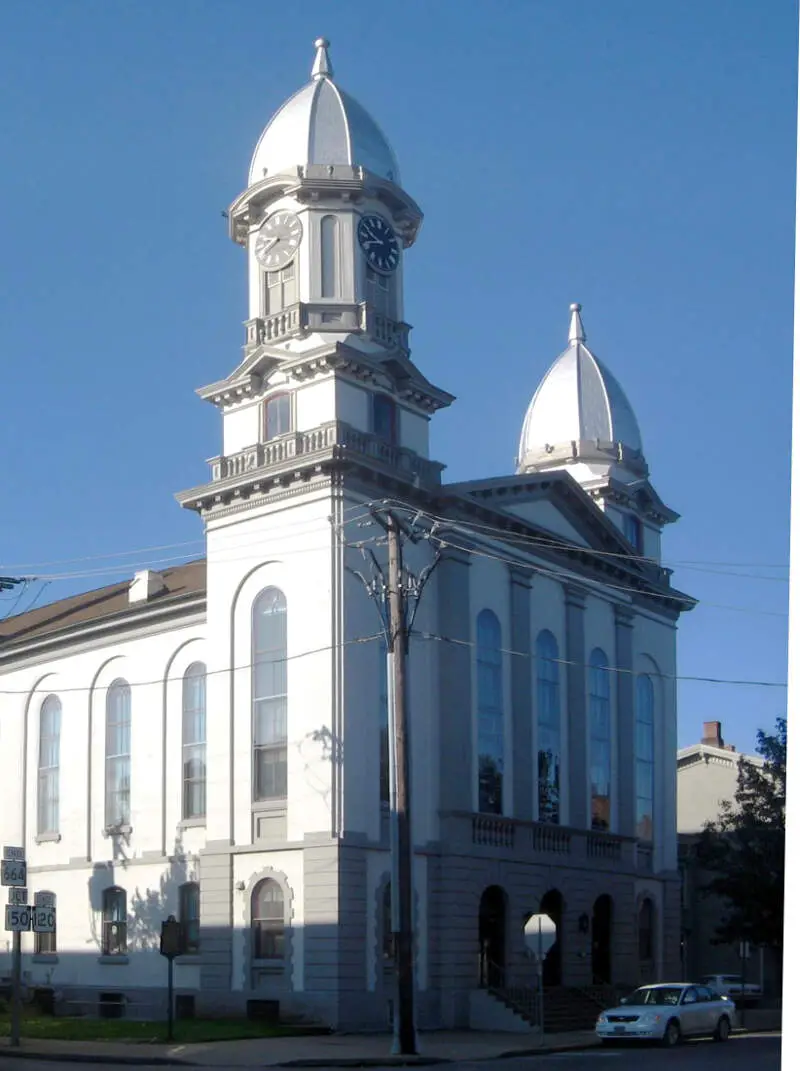
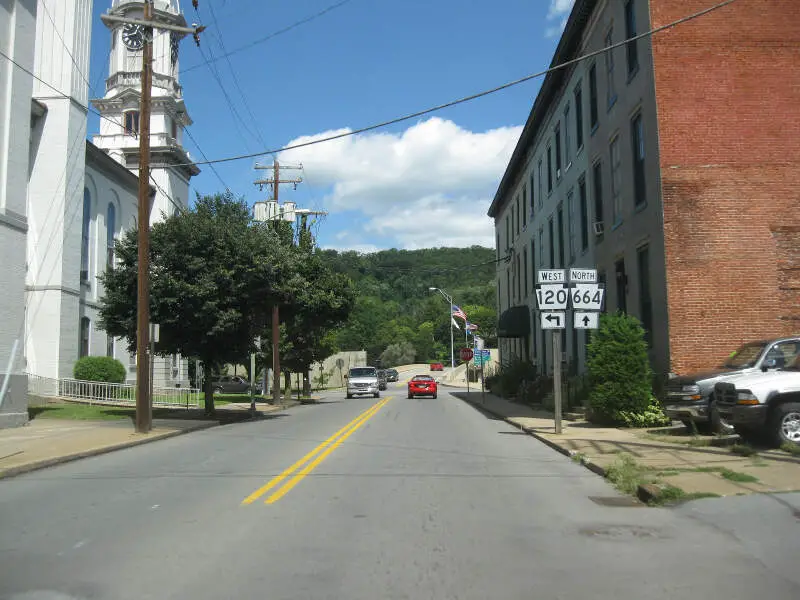
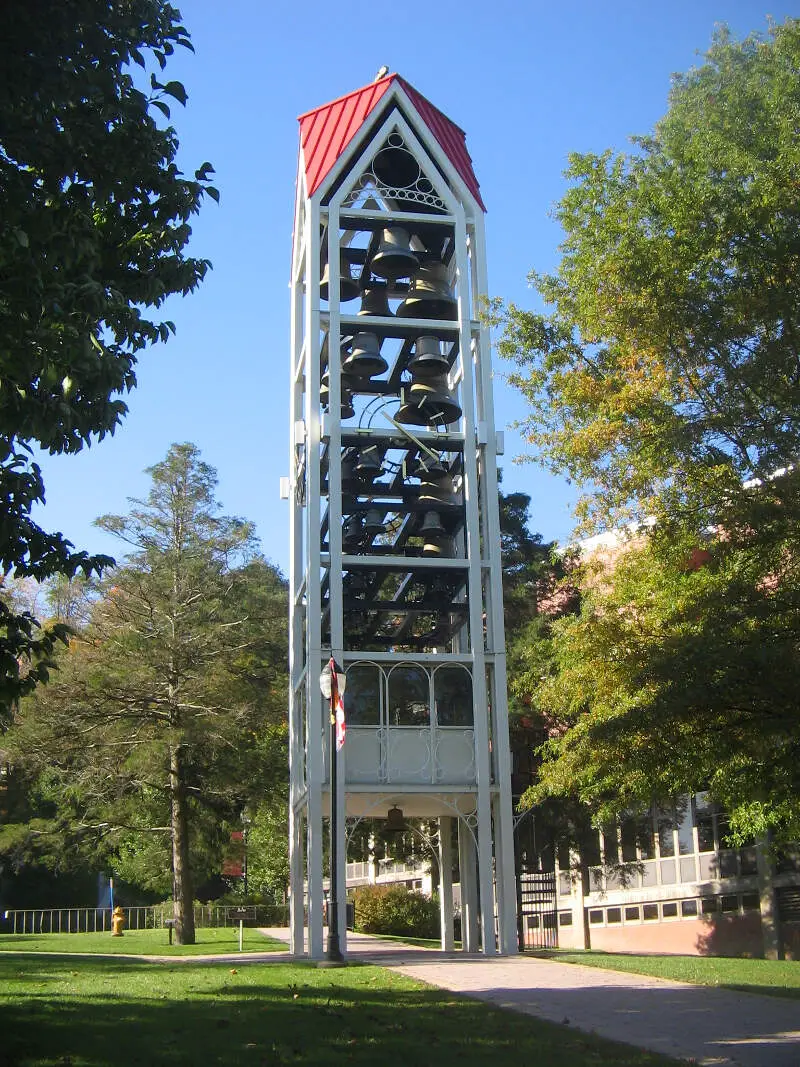
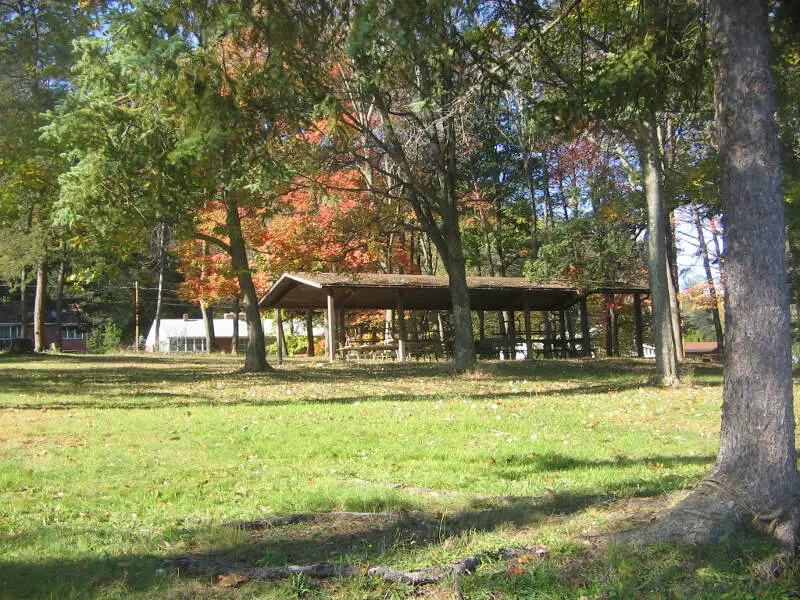
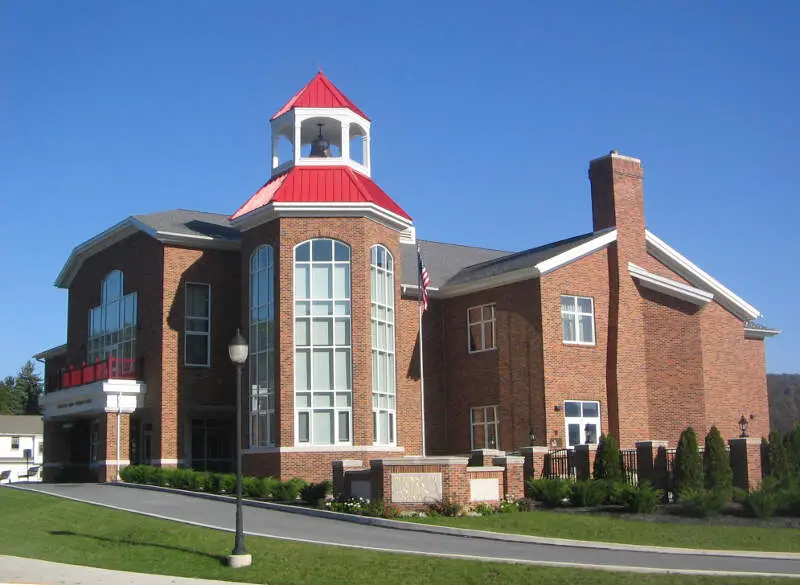
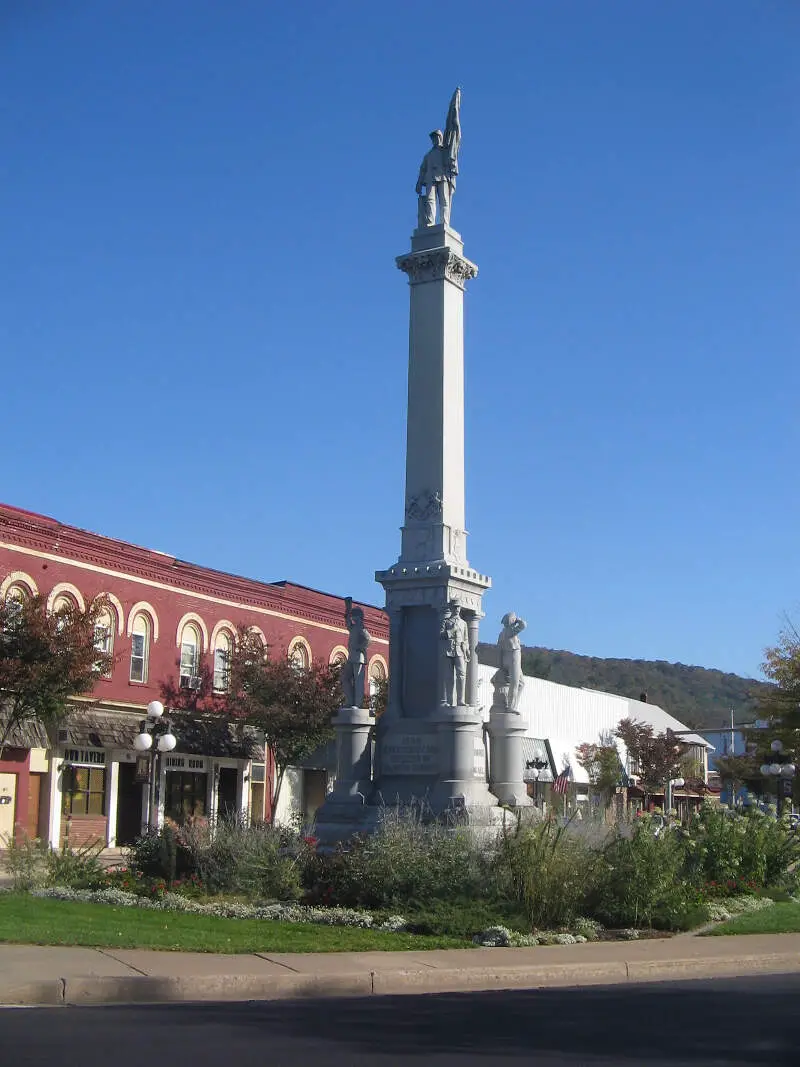
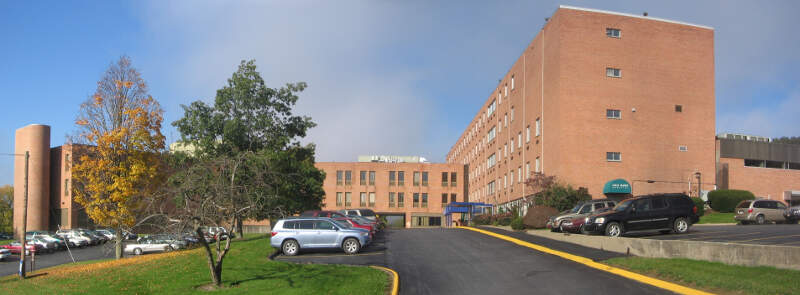
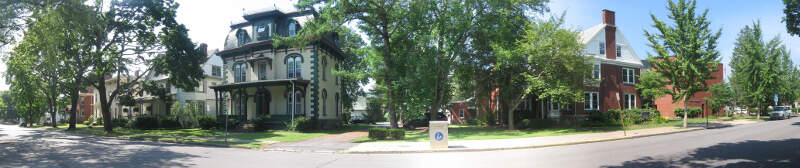
Lock Haven, PA Photos

Rankings for Lock Haven in Pennsylvania


Locations Around Lock Haven
Map Of Lock Haven, PA
Best Places Around Lock Haven
State College, PA
Population 40,669
Bellefonte, PA
Population 6,022
Prospect Park, PA
Population 262
Lewisburg, PA
Population 5,247
South Williamsport, PA
Population 6,216
Selinsgrove, PA
Population 5,655
Milton, PA
Population 6,582
Williamsport, PA
Population 27,629
Sunbury, PA
Population 9,643
Jacksonville, TX
Population 14,186
Lock Haven Demographics And Statistics
Population over time in Lock Haven
The current population in Lock Haven is 8,386. The population has decreased -13.0% from 2010.
| Year | Population | % Change |
|---|---|---|
| 2023 | 8,386 | -0.4% |
| 2022 | 8,422 | -0.4% |
| 2021 | 8,458 | -6.0% |
| 2020 | 8,997 | -2.7% |
| 2019 | 9,247 | -1.0% |
| 2018 | 9,345 | -2.0% |
| 2017 | 9,540 | -1.9% |
| 2016 | 9,725 | -0.7% |
| 2015 | 9,790 | -0.7% |
| 2014 | 9,860 | -0.0% |
| 2013 | 9,861 | 1.1% |
| 2012 | 9,750 | 1.7% |
| 2011 | 9,587 | -0.6% |
| 2010 | 9,644 | - |
Race / Ethnicity in Lock Haven
Lock Haven is:
88.9% White with 7,459 White residents.
4.3% African American with 357 African American residents.
0.2% American Indian with 13 American Indian residents.
1.2% Asian with 101 Asian residents.
0.0% Hawaiian with 0 Hawaiian residents.
0.0% Other with 0 Other residents.
2.5% Two Or More with 210 Two Or More residents.
2.9% Hispanic with 246 Hispanic residents.
| Race | Lock Haven | PA | USA |
|---|---|---|---|
| White | 88.9% | 73.8% | 58.2% |
| African American | 4.3% | 10.3% | 12.0% |
| American Indian | 0.2% | 0.1% | 0.5% |
| Asian | 1.2% | 3.7% | 5.7% |
| Hawaiian | 0.0% | 0.0% | 0.2% |
| Other | 0.0% | 0.4% | 0.5% |
| Two Or More | 2.5% | 3.3% | 3.9% |
| Hispanic | 2.9% | 8.4% | 19.0% |
Gender in Lock Haven
Lock Haven is 52.2% female with 4,376 female residents.
Lock Haven is 47.8% male with 4,010 male residents.
| Gender | Lock Haven | PA | USA |
|---|---|---|---|
| Female | 52.2% | 50.7% | 50.5% |
| Male | 47.8% | 49.3% | 49.5% |
Highest level of educational attainment in Lock Haven for adults over 25
1.0% of adults in Lock Haven completed < 9th grade.
10.0% of adults in Lock Haven completed 9-12th grade.
45.0% of adults in Lock Haven completed high school / ged.
14.0% of adults in Lock Haven completed some college.
6.0% of adults in Lock Haven completed associate's degree.
16.0% of adults in Lock Haven completed bachelor's degree.
5.0% of adults in Lock Haven completed master's degree.
1.0% of adults in Lock Haven completed professional degree.
2.0% of adults in Lock Haven completed doctorate degree.
| Education | Lock Haven | PA | USA |
|---|---|---|---|
| < 9th Grade | 1.0% | 3.0% | 5.0% |
| 9-12th Grade | 10.0% | 5.0% | 6.0% |
| High School / GED | 45.0% | 33.0% | 26.0% |
| Some College | 14.0% | 15.0% | 19.0% |
| Associate's Degree | 6.0% | 9.0% | 9.0% |
| Bachelor's Degree | 16.0% | 21.0% | 21.0% |
| Master's Degree | 5.0% | 10.0% | 10.0% |
| Professional Degree | 1.0% | 2.0% | 2.0% |
| Doctorate Degree | 2.0% | 2.0% | 2.0% |
Household Income For Lock Haven, Pennsylvania
10.7% of households in Lock Haven earn Less than $10,000.
9.1% of households in Lock Haven earn $10,000 to $14,999.
15.0% of households in Lock Haven earn $15,000 to $24,999.
11.0% of households in Lock Haven earn $25,000 to $34,999.
13.7% of households in Lock Haven earn $35,000 to $49,999.
16.4% of households in Lock Haven earn $50,000 to $74,999.
6.8% of households in Lock Haven earn $75,000 to $99,999.
13.2% of households in Lock Haven earn $100,000 to $149,999.
1.9% of households in Lock Haven earn $150,000 to $199,999.
2.3% of households in Lock Haven earn $200,000 or more.
| Income | Lock Haven | PA | USA |
|---|---|---|---|
| Less than $10,000 | 10.7% | 4.8% | 4.9% |
| $10,000 to $14,999 | 9.1% | 3.7% | 3.6% |
| $15,000 to $24,999 | 15.0% | 7.0% | 6.6% |
| $25,000 to $34,999 | 11.0% | 7.1% | 6.8% |
| $35,000 to $49,999 | 13.7% | 10.7% | 10.4% |
| $50,000 to $74,999 | 16.4% | 16.1% | 15.7% |
| $75,000 to $99,999 | 6.8% | 12.9% | 12.7% |
| $100,000 to $149,999 | 13.2% | 17.6% | 17.4% |
| $150,000 to $199,999 | 1.9% | 9.0% | 9.3% |
| $200,000 or more | 2.3% | 11.1% | 12.6% |


