Milton SnackAbility
Overall SnackAbility
Cost of living in Milton summary. We use data on the cost of living to determine how expensive it is to live in Milton. Real estate prices drive most of the variance in cost of living around Pennsylvania. Key points include:
The cost of living in Milton is 91 with 100 being average.
The cost of living in Milton is 0.9x lower than the national average.
The median home value in Milton is $220,577.
The median income in Milton is $54,577.
Milton's Overall Cost Of Living
Lower Than The National Average
Cost Of Living In Milton Comparison Table
| Living Expense | Milton | Pennsylvania | National Average |
|---|---|---|---|
| Overall | 91 | 97 | 100 |
| Services | 100 | 99 | 100 |
| Groceries | 99 | 100 | 100 |
| Health | 76 | 88 | 100 |
| Housing | 101 | 102 | 100 |
| Transportation | 98 | 100 | 100 |
| Utilities | 98 | 101 | 100 |
Source: Cost of living index, normalized to US average = 100
Milton, PA Weather
The average high in Milton is 60.7° and the average low is 39.7°.
There are 78.3 days of precipitation each year.
Expect an average of 42.4 inches of precipitation each year with 31.3 inches of snow.
| Stat | Milton |
|---|---|
| Average Annual High | 60.7 |
| Average Annual Low | 39.7 |
| Annual Precipitation Days | 78.3 |
| Average Annual Precipitation | 42.4 |
| Average Annual Snowfall | 31.3 |
Average High
Days of Rain
Source: NOAA climate normals (30-year)
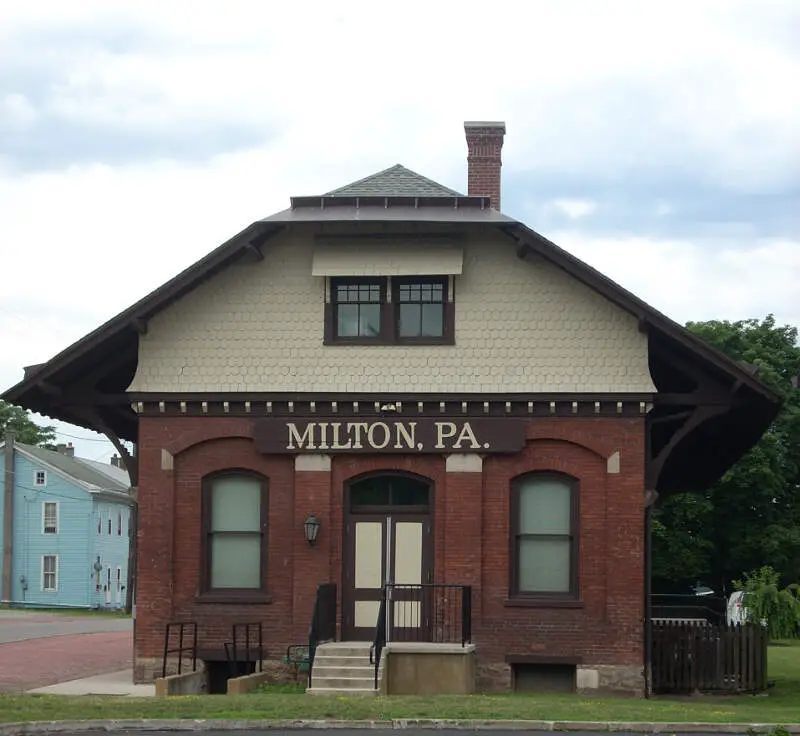
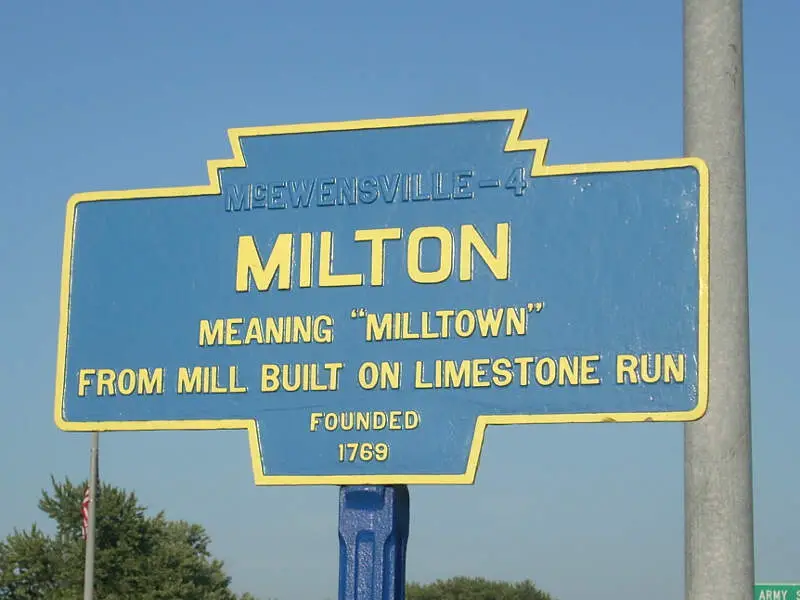
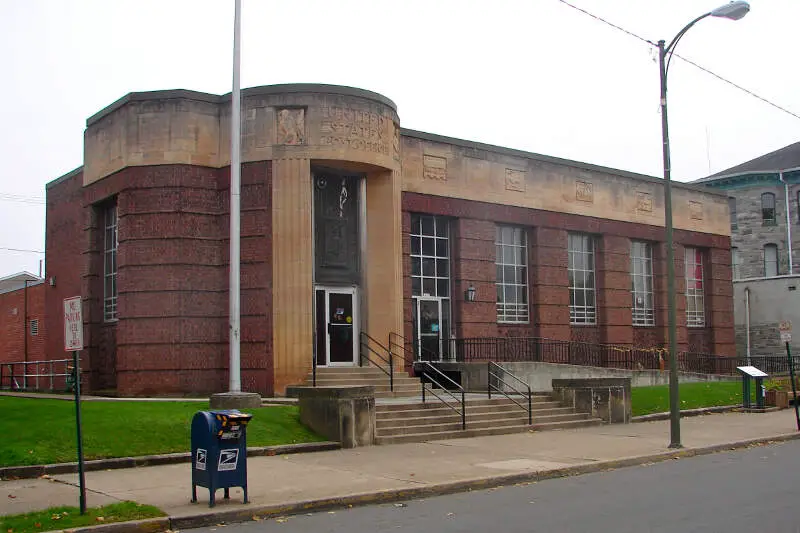
Milton, PA Photos
Rankings & Articles For Milton


Locations Around Milton
Map Of Milton, PA
Best Places Around Milton
Niskayuna, NY
Population 21,227
Cohoes, NY
Population 18,159
Saratoga Springs, NY
Population 28,631
Mechanicville, NY
Population 5,124
Scotia, NY
Population 7,264
Ballston Spa, NY
Population 5,027
East Glenville, NY
Population 11,914
Rotterdam, NY
Population 22,695
Schenectady, NY
Population 68,847
Amsterdam, NY
Population 18,166
Milton Demographics And Statistics
Population over time in Milton
The current population in Milton is 6,534. The population has decreased 7.1% from 2010.
| Year | Population | % Change |
|---|---|---|
| 2024 | 6,534 | -0.7% |
| 2023 | 6,582 | -0.4% |
| 2022 | 6,610 | -0.5% |
| 2021 | 6,641 | 1.3% |
| 2020 | 6,558 | -2.1% |
| 2019 | 6,697 | -2.1% |
| 2018 | 6,838 | -1.3% |
| 2017 | 6,926 | -0.6% |
| 2016 | 6,968 | -0.4% |
| 2015 | 6,993 | -0.3% |
| 2014 | 7,017 | -0.1% |
| 2013 | 7,026 | -0.3% |
| 2012 | 7,050 | 0.1% |
| 2011 | 7,040 | 0.1% |
| 2010 | 7,030 | - |
Race / Ethnicity in Milton
See the full breakdown
Milton is:
81.3% White with 5,311 White residents.
0.5% African American with 34 African American residents.
0.0% American Indian with 0 American Indian residents.
2.9% Asian with 187 Asian residents.
0.0% Hawaiian with 0 Hawaiian residents.
0.2% Other with 10 Other residents.
3.6% Two Or More with 234 Two Or More residents.
11.6% Hispanic with 758 Hispanic residents.
| Race | Milton | PA | USA |
|---|---|---|---|
| White | 81.3% | 73.0% | 57.4% |
| African American | 0.5% | 10.3% | 11.9% |
| American Indian | 0.0% | 0.1% | 0.5% |
| Asian | 2.9% | 3.8% | 5.9% |
| Hawaiian | 0.0% | 0.0% | 0.2% |
| Other | 0.2% | 0.5% | 0.6% |
| Two Or More | 3.6% | 3.6% | 4.3% |
| Hispanic | 11.6% | 8.7% | 19.3% |
Gender in Milton
See the full breakdown
Milton is 50.1% female with 3,275 female residents.
Milton is 49.9% male with 3,259 male residents.
| Gender | Milton | PA | USA |
|---|---|---|---|
| Female | 50.1% | 50.7% | 50.5% |
| Male | 49.9% | 49.3% | 49.5% |
Highest level of educational attainment in Milton for adults over 25
See the full breakdown
3.0% of adults in Milton completed < 9th grade.
5.0% of adults in Milton completed 9-12th grade.
42.0% of adults in Milton completed high school / ged.
20.0% of adults in Milton completed some college.
11.0% of adults in Milton completed associate's degree.
14.0% of adults in Milton completed bachelor's degree.
5.0% of adults in Milton completed master's degree.
0.0% of adults in Milton completed professional degree.
0.0% of adults in Milton completed doctorate degree.
| Education | Milton | PA | USA |
|---|---|---|---|
| < 9th Grade | 3.0% | 3.0% | 4.0% |
| 9-12th Grade | 5.0% | 5.0% | 6.0% |
| High School / GED | 42.0% | 33.0% | 26.0% |
| Some College | 20.0% | 15.0% | 19.0% |
| Associate's Degree | 11.0% | 9.0% | 9.0% |
| Bachelor's Degree | 14.0% | 21.0% | 22.0% |
| Master's Degree | 5.0% | 10.0% | 10.0% |
| Professional Degree | 0.0% | 2.0% | 2.0% |
| Doctorate Degree | 0.0% | 2.0% | 2.0% |
Household Income For Milton, Pennsylvania
See the full breakdown
3.2% of households in Milton earn Less than $10,000.
1.5% of households in Milton earn $10,000 to $14,999.
8.3% of households in Milton earn $15,000 to $24,999.
15.9% of households in Milton earn $25,000 to $34,999.
15.0% of households in Milton earn $35,000 to $49,999.
22.6% of households in Milton earn $50,000 to $74,999.
10.9% of households in Milton earn $75,000 to $99,999.
14.3% of households in Milton earn $100,000 to $149,999.
3.1% of households in Milton earn $150,000 to $199,999.
5.1% of households in Milton earn $200,000 or more.
| Income | Milton | PA | USA |
|---|---|---|---|
| Less than $10,000 | 3.2% | 4.9% | 5.0% |
| $10,000 to $14,999 | 1.5% | 3.5% | 3.4% |
| $15,000 to $24,999 | 8.3% | 6.7% | 6.3% |
| $25,000 to $34,999 | 15.9% | 6.9% | 6.6% |
| $35,000 to $49,999 | 15.0% | 10.5% | 10.1% |
| $50,000 to $74,999 | 22.6% | 15.9% | 15.5% |
| $75,000 to $99,999 | 10.9% | 12.8% | 12.6% |
| $100,000 to $149,999 | 14.3% | 17.7% | 17.5% |
| $150,000 to $199,999 | 3.1% | 9.3% | 9.6% |
| $200,000 or more | 5.1% | 11.8% | 13.4% |
Source: U.S. Census ACS 5-year estimates (2024)


