Lewisburg, PA
Demographics And Statistics
Living In Lewisburg, Pennsylvania Summary
Life in Lewisburg research summary. HomeSnacks has been using Saturday Night Science to research the quality of life in Lewisburg over the past nine years using Census, FBI, Zillow, and other primary data sources. Based on the most recently available data, we found the following about life in Lewisburg:
The population in Lewisburg is 5,247.
The median home value in Lewisburg is $318,738.
The median income in Lewisburg is $51,674.
The cost of living in Lewisburg is 103 which is 1.0x higher than the national average.
The median rent in Lewisburg is $941.
The unemployment rate in Lewisburg is 1.3%.
The poverty rate in Lewisburg is 19.5%.
The average high in Lewisburg is 60.5° and the average low is 39.3°.
Table Of Contents
Lewisburg SnackAbility
Overall SnackAbility
Lewisburg, PA Cost Of Living
Cost of living in Lewisburg summary. We use data on the cost of living to determine how expensive it is to live in Lewisburg. Real estate prices drive most of the variance in cost of living around Pennsylvania. Key points include:
The cost of living in Lewisburg is 103 with 100 being average.
The cost of living in Lewisburg is 1.0x higher than the national average.
The median home value in Lewisburg is $318,738.
The median income in Lewisburg is $51,674.
Lewisburg's Overall Cost Of Living
Higher Than The National Average
Cost Of Living In Lewisburg Comparison Table
| Living Expense | Lewisburg | Pennsylvania | National Average | |
|---|---|---|---|---|
| Overall | 103 | 100 | 100 | |
| Services | 97 | 101 | 100 | |
| Groceries | 102 | 101 | 100 | |
| Health | 92 | 95 | 100 | |
| Housing | 102 | 93 | 100 | |
| Transportation | 107 | 108 | 100 | |
| Utilities | 103 | 108 | 100 | |
Lewisburg, PA Weather
The average high in Lewisburg is 60.5° and the average low is 39.3°.
There are 80.3 days of precipitation each year.
Expect an average of 43.4 inches of precipitation each year with 32.4 inches of snow.
| Stat | Lewisburg |
|---|---|
| Average Annual High | 60.5 |
| Average Annual Low | 39.3 |
| Annual Precipitation Days | 80.3 |
| Average Annual Precipitation | 43.4 |
| Average Annual Snowfall | 32.4 |
Average High
Days of Rain
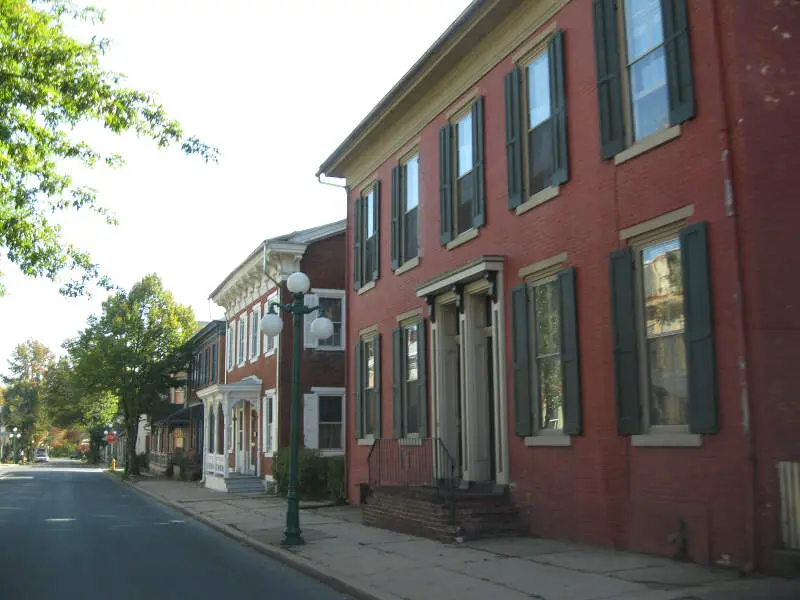
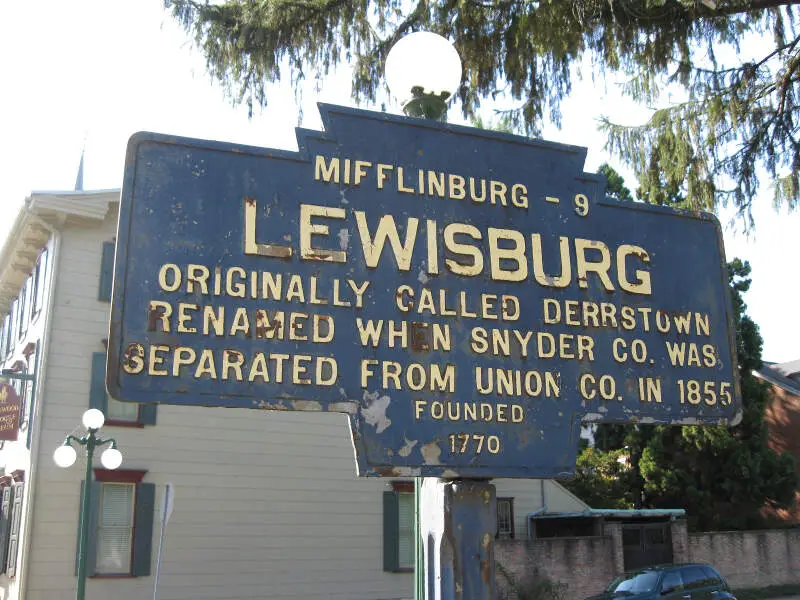
Lewisburg, PA Photos

Rankings for Lewisburg in Pennsylvania


Locations Around Lewisburg
Map Of Lewisburg, PA
Best Places Around Lewisburg
Bellefonte, PA
Population 6,022
Camp Hill, PA
Population 8,149
Fredericksburg, TX
Population 11,254
Linglestown, PA
Population 6,747
Progress, PA
Population 11,143
Palmyra, PA
Population 7,769
Colonial Park, PA
Population 18,125
Enola, PA
Population 5,913
Hershey, PA
Population 14,334
Lewisburg Demographics And Statistics
Population over time in Lewisburg
The current population in Lewisburg is 5,247. The population has decreased -10.5% from 2010.
| Year | Population | % Change |
|---|---|---|
| 2023 | 5,247 | -0.7% |
| 2022 | 5,284 | -1.0% |
| 2021 | 5,336 | -6.9% |
| 2020 | 5,730 | 0.1% |
| 2019 | 5,723 | -0.3% |
| 2018 | 5,740 | -0.2% |
| 2017 | 5,753 | -0.1% |
| 2016 | 5,757 | -0.4% |
| 2015 | 5,781 | 0.0% |
| 2014 | 5,781 | 0.4% |
| 2013 | 5,759 | -0.8% |
| 2012 | 5,804 | -0.5% |
| 2011 | 5,833 | -0.5% |
| 2010 | 5,862 | - |
Race / Ethnicity in Lewisburg
Lewisburg is:
86.4% White with 4,535 White residents.
3.4% African American with 177 African American residents.
0.0% American Indian with 0 American Indian residents.
4.6% Asian with 241 Asian residents.
0.0% Hawaiian with 0 Hawaiian residents.
0.1% Other with 6 Other residents.
2.4% Two Or More with 128 Two Or More residents.
3.0% Hispanic with 160 Hispanic residents.
| Race | Lewisburg | PA | USA |
|---|---|---|---|
| White | 86.4% | 73.8% | 58.2% |
| African American | 3.4% | 10.3% | 12.0% |
| American Indian | 0.0% | 0.1% | 0.5% |
| Asian | 4.6% | 3.7% | 5.7% |
| Hawaiian | 0.0% | 0.0% | 0.2% |
| Other | 0.1% | 0.4% | 0.5% |
| Two Or More | 2.4% | 3.3% | 3.9% |
| Hispanic | 3.0% | 8.4% | 19.0% |
Gender in Lewisburg
Lewisburg is 49.7% female with 2,608 female residents.
Lewisburg is 50.3% male with 2,638 male residents.
| Gender | Lewisburg | PA | USA |
|---|---|---|---|
| Female | 49.7% | 50.7% | 50.5% |
| Male | 50.3% | 49.3% | 49.5% |
Highest level of educational attainment in Lewisburg for adults over 25
3.0% of adults in Lewisburg completed < 9th grade.
11.0% of adults in Lewisburg completed 9-12th grade.
23.0% of adults in Lewisburg completed high school / ged.
16.0% of adults in Lewisburg completed some college.
4.0% of adults in Lewisburg completed associate's degree.
24.0% of adults in Lewisburg completed bachelor's degree.
11.0% of adults in Lewisburg completed master's degree.
3.0% of adults in Lewisburg completed professional degree.
5.0% of adults in Lewisburg completed doctorate degree.
| Education | Lewisburg | PA | USA |
|---|---|---|---|
| < 9th Grade | 3.0% | 3.0% | 5.0% |
| 9-12th Grade | 11.0% | 5.0% | 6.0% |
| High School / GED | 23.0% | 33.0% | 26.0% |
| Some College | 16.0% | 15.0% | 19.0% |
| Associate's Degree | 4.0% | 9.0% | 9.0% |
| Bachelor's Degree | 24.0% | 21.0% | 21.0% |
| Master's Degree | 11.0% | 10.0% | 10.0% |
| Professional Degree | 3.0% | 2.0% | 2.0% |
| Doctorate Degree | 5.0% | 2.0% | 2.0% |
Household Income For Lewisburg, Pennsylvania
12.3% of households in Lewisburg earn Less than $10,000.
5.2% of households in Lewisburg earn $10,000 to $14,999.
7.5% of households in Lewisburg earn $15,000 to $24,999.
9.9% of households in Lewisburg earn $25,000 to $34,999.
13.0% of households in Lewisburg earn $35,000 to $49,999.
21.2% of households in Lewisburg earn $50,000 to $74,999.
11.1% of households in Lewisburg earn $75,000 to $99,999.
8.1% of households in Lewisburg earn $100,000 to $149,999.
6.5% of households in Lewisburg earn $150,000 to $199,999.
5.2% of households in Lewisburg earn $200,000 or more.
| Income | Lewisburg | PA | USA |
|---|---|---|---|
| Less than $10,000 | 12.3% | 4.8% | 4.9% |
| $10,000 to $14,999 | 5.2% | 3.7% | 3.6% |
| $15,000 to $24,999 | 7.5% | 7.0% | 6.6% |
| $25,000 to $34,999 | 9.9% | 7.1% | 6.8% |
| $35,000 to $49,999 | 13.0% | 10.7% | 10.4% |
| $50,000 to $74,999 | 21.2% | 16.1% | 15.7% |
| $75,000 to $99,999 | 11.1% | 12.9% | 12.7% |
| $100,000 to $149,999 | 8.1% | 17.6% | 17.4% |
| $150,000 to $199,999 | 6.5% | 9.0% | 9.3% |
| $200,000 or more | 5.2% | 11.1% | 12.6% |


