Williamsport SnackAbility
Overall SnackAbility
Cost of living in Williamsport summary. We use data on the cost of living to determine how expensive it is to live in Williamsport. Real estate prices drive most of the variance in cost of living around Pennsylvania. Key points include:
The cost of living in Williamsport is 89 with 100 being average.
The cost of living in Williamsport is 0.9x lower than the national average.
The median home value in Williamsport is $202,720.
The median income in Williamsport is $48,851.
Williamsport's Overall Cost Of Living
Lower Than The National Average
Cost Of Living In Williamsport Comparison Table
| Living Expense | Williamsport | Pennsylvania | National Average |
|---|---|---|---|
| Overall | 89 | 97 | 100 |
| Services | 96 | 99 | 100 |
| Groceries | 99 | 100 | 100 |
| Health | 69 | 88 | 100 |
| Housing | 103 | 102 | 100 |
| Transportation | 99 | 100 | 100 |
| Utilities | 99 | 101 | 100 |
Source: Cost of living index, normalized to US average = 100
Williamsport, PA Weather
The average high in Williamsport is 60.2° and the average low is 38.8°.
There are 81.3 days of precipitation each year.
Expect an average of 42.4 inches of precipitation each year with 33.5 inches of snow.
| Stat | Williamsport |
|---|---|
| Average Annual High | 60.2 |
| Average Annual Low | 38.8 |
| Annual Precipitation Days | 81.3 |
| Average Annual Precipitation | 42.4 |
| Average Annual Snowfall | 33.5 |
Average High
Days of Rain
Source: NOAA climate normals (30-year)
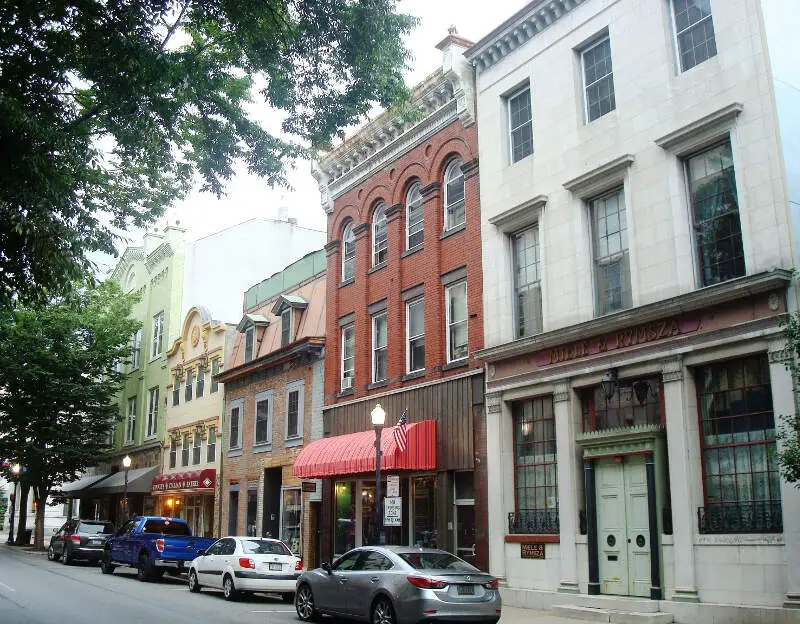
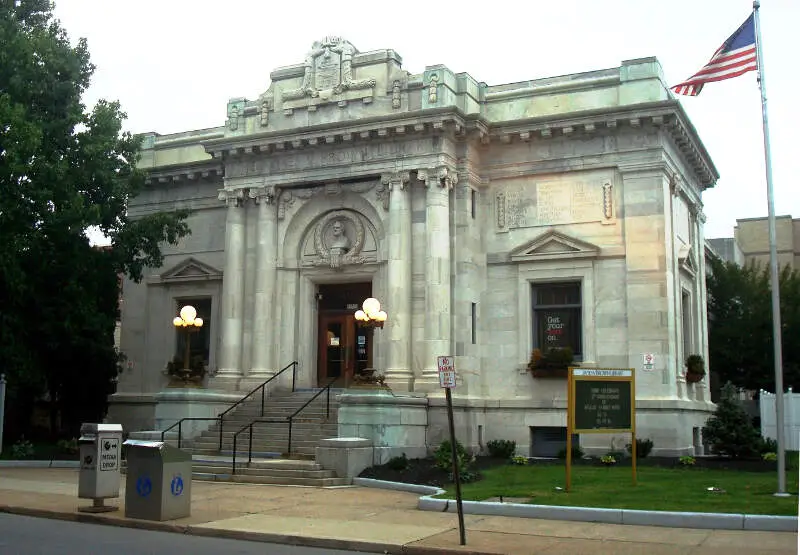
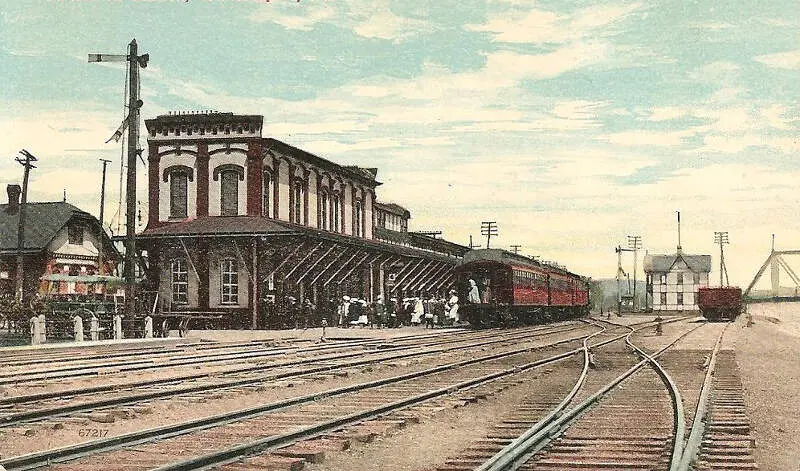
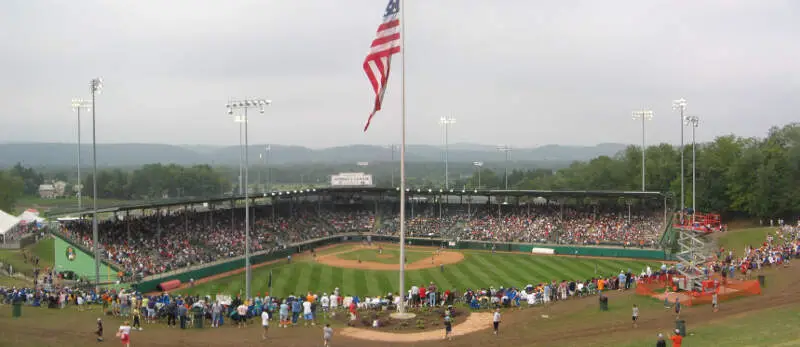
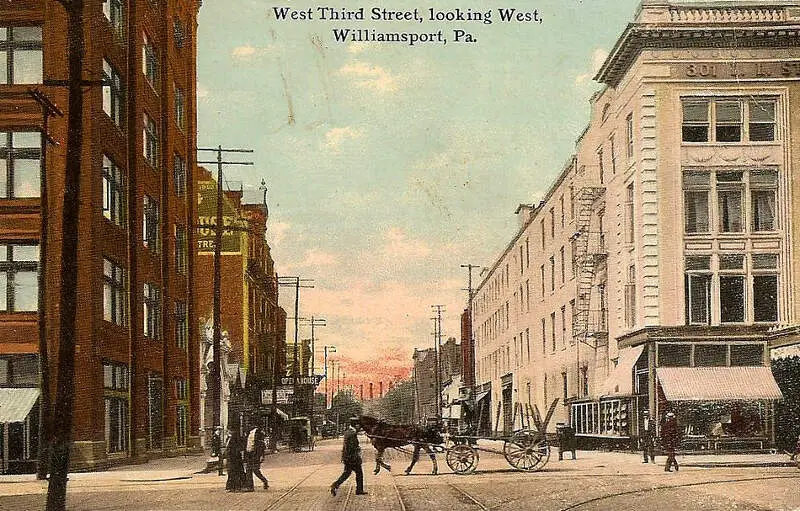
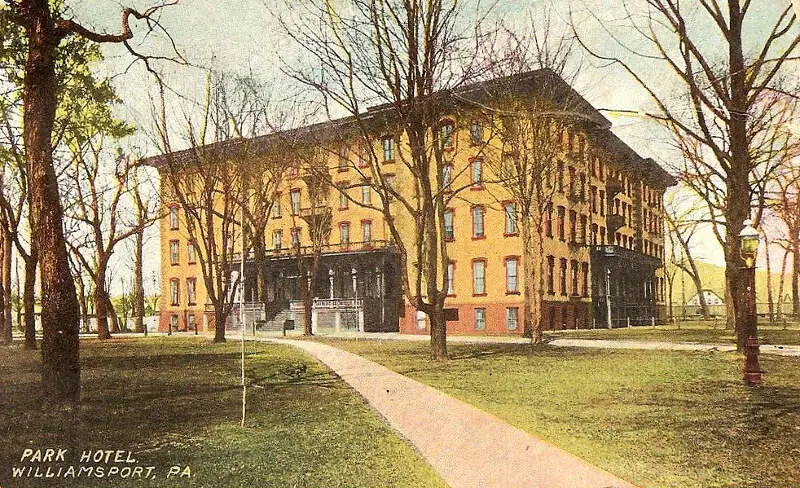
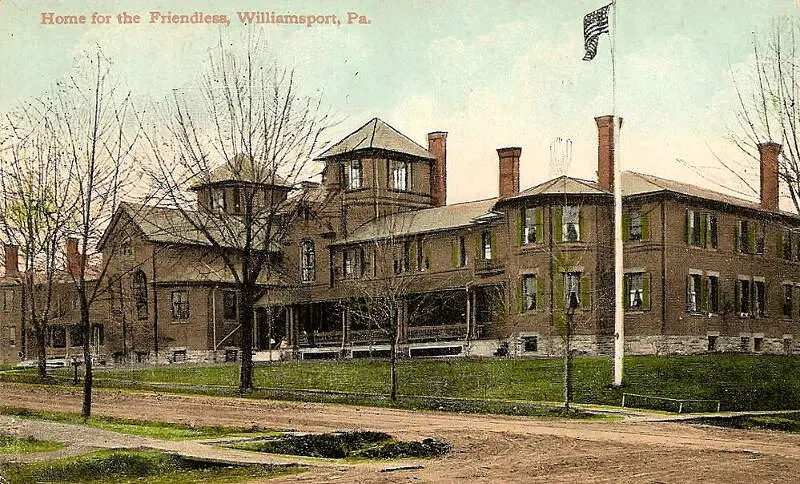
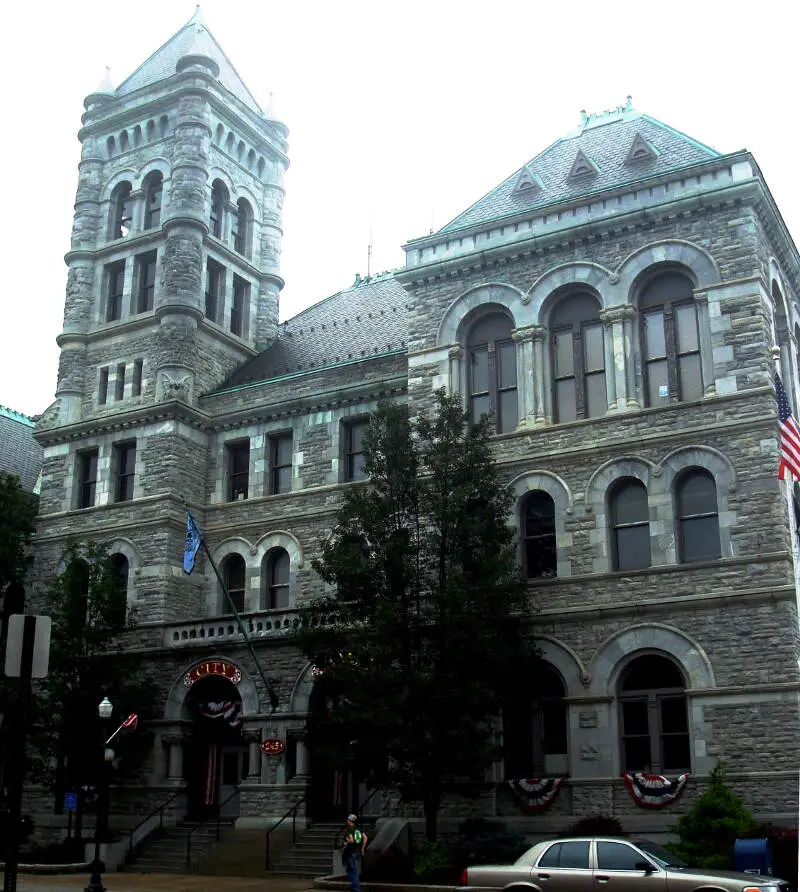
Williamsport, PA Photos

Rankings & Articles For Williamsport


Locations Around Williamsport
Map Of Williamsport, PA
Best Places Around Williamsport
Bellefonte, PA
Population 6,009
Lewisburg, PA
Population 5,257
South Williamsport, PA
Population 6,211
Shamokin, PA
Population 6,853
Bloomsburg, PA
Population 13,024
Berwick, PA
Population 10,317
Lock Haven, PA
Population 8,447
Mount Carmel, PA
Population 5,677
Selinsgrove, PA
Population 5,593
Milton, PA
Population 6,534
Williamsport Demographics And Statistics
Population over time in Williamsport
The current population in Williamsport is 27,612. The population has decreased 6.4% from 2010.
| Year | Population | % Change |
|---|---|---|
| 2024 | 27,612 | -0.1% |
| 2023 | 27,629 | -0.5% |
| 2022 | 27,755 | -0.5% |
| 2021 | 27,908 | -1.9% |
| 2020 | 28,437 | -0.4% |
| 2019 | 28,562 | -0.7% |
| 2018 | 28,757 | -0.6% |
| 2017 | 28,938 | -0.8% |
| 2016 | 29,180 | -0.5% |
| 2015 | 29,339 | -0.1% |
| 2014 | 29,377 | -0.2% |
| 2013 | 29,429 | -0.0% |
| 2012 | 29,441 | -0.1% |
| 2011 | 29,477 | -0.1% |
| 2010 | 29,508 | - |
Race / Ethnicity in Williamsport
See the full breakdown
Williamsport is:
74.2% White with 20,501 White residents.
12.0% African American with 3,305 African American residents.
0.2% American Indian with 44 American Indian residents.
1.4% Asian with 392 Asian residents.
0.0% Hawaiian with 0 Hawaiian residents.
0.4% Other with 101 Other residents.
7.4% Two Or More with 2,034 Two Or More residents.
4.5% Hispanic with 1,235 Hispanic residents.
| Race | Williamsport | PA | USA |
|---|---|---|---|
| White | 74.2% | 73.0% | 57.4% |
| African American | 12.0% | 10.3% | 11.9% |
| American Indian | 0.2% | 0.1% | 0.5% |
| Asian | 1.4% | 3.8% | 5.9% |
| Hawaiian | 0.0% | 0.0% | 0.2% |
| Other | 0.4% | 0.5% | 0.6% |
| Two Or More | 7.4% | 3.6% | 4.3% |
| Hispanic | 4.5% | 8.7% | 19.3% |
Gender in Williamsport
See the full breakdown
Williamsport is 49.2% female with 13,584 female residents.
Williamsport is 50.8% male with 14,028 male residents.
| Gender | Williamsport | PA | USA |
|---|---|---|---|
| Female | 49.2% | 50.7% | 50.5% |
| Male | 50.8% | 49.3% | 49.5% |
Highest level of educational attainment in Williamsport for adults over 25
See the full breakdown
2.0% of adults in Williamsport completed < 9th grade.
7.0% of adults in Williamsport completed 9-12th grade.
35.0% of adults in Williamsport completed high school / ged.
17.0% of adults in Williamsport completed some college.
11.0% of adults in Williamsport completed associate's degree.
17.0% of adults in Williamsport completed bachelor's degree.
7.0% of adults in Williamsport completed master's degree.
2.0% of adults in Williamsport completed professional degree.
2.0% of adults in Williamsport completed doctorate degree.
| Education | Williamsport | PA | USA |
|---|---|---|---|
| < 9th Grade | 2.0% | 3.0% | 4.0% |
| 9-12th Grade | 7.0% | 5.0% | 6.0% |
| High School / GED | 35.0% | 33.0% | 26.0% |
| Some College | 17.0% | 15.0% | 19.0% |
| Associate's Degree | 11.0% | 9.0% | 9.0% |
| Bachelor's Degree | 17.0% | 21.0% | 22.0% |
| Master's Degree | 7.0% | 10.0% | 10.0% |
| Professional Degree | 2.0% | 2.0% | 2.0% |
| Doctorate Degree | 2.0% | 2.0% | 2.0% |
Household Income For Williamsport, Pennsylvania
See the full breakdown
9.1% of households in Williamsport earn Less than $10,000.
8.2% of households in Williamsport earn $10,000 to $14,999.
12.6% of households in Williamsport earn $15,000 to $24,999.
8.0% of households in Williamsport earn $25,000 to $34,999.
13.2% of households in Williamsport earn $35,000 to $49,999.
18.5% of households in Williamsport earn $50,000 to $74,999.
10.7% of households in Williamsport earn $75,000 to $99,999.
13.0% of households in Williamsport earn $100,000 to $149,999.
3.6% of households in Williamsport earn $150,000 to $199,999.
3.1% of households in Williamsport earn $200,000 or more.
| Income | Williamsport | PA | USA |
|---|---|---|---|
| Less than $10,000 | 9.1% | 4.9% | 5.0% |
| $10,000 to $14,999 | 8.2% | 3.5% | 3.4% |
| $15,000 to $24,999 | 12.6% | 6.7% | 6.3% |
| $25,000 to $34,999 | 8.0% | 6.9% | 6.6% |
| $35,000 to $49,999 | 13.2% | 10.5% | 10.1% |
| $50,000 to $74,999 | 18.5% | 15.9% | 15.5% |
| $75,000 to $99,999 | 10.7% | 12.8% | 12.6% |
| $100,000 to $149,999 | 13.0% | 17.7% | 17.5% |
| $150,000 to $199,999 | 3.6% | 9.3% | 9.6% |
| $200,000 or more | 3.1% | 11.8% | 13.4% |
Source: U.S. Census ACS 5-year estimates (2024)


