Compare Pittsburgh to…
Pittsburgh SnackAbility
Overall SnackAbility
Cost of living in Pittsburgh summary. We use data on the cost of living to determine how expensive it is to live in Pittsburgh. Real estate prices drive most of the variance in cost of living around Pennsylvania. Key points include:
The cost of living in Pittsburgh is 98 with 100 being average.
The cost of living in Pittsburgh is 1.0x lower than the national average.
The median home value in Pittsburgh is $237,533.
The median income in Pittsburgh is $65,742.
Pittsburgh's Overall Cost Of Living
Lower Than The National Average
Cost Of Living In Pittsburgh Comparison Table
| Living Expense | Pittsburgh | Pennsylvania | National Average |
|---|---|---|---|
| Overall | 98 | 97 | 100 |
| Services | 97 | 99 | 100 |
| Groceries | 101 | 100 | 100 |
| Health | 84 | 88 | 100 |
| Housing | 105 | 102 | 100 |
| Transportation | 106 | 100 | 100 |
| Utilities | 99 | 101 | 100 |
Source: Cost of living index, normalized to US average = 100
Pittsburgh, PA Weather
The average high in Pittsburgh is 61.8° and the average low is 42.0°.
There are 78.8 days of precipitation each year.
Expect an average of 37.5 inches of precipitation each year with 27.6 inches of snow.
| Stat | Pittsburgh |
|---|---|
| Average Annual High | 61.8 |
| Average Annual Low | 42.0 |
| Annual Precipitation Days | 78.8 |
| Average Annual Precipitation | 37.5 |
| Average Annual Snowfall | 27.6 |
Average High
Days of Rain
Source: NOAA climate normals (30-year)
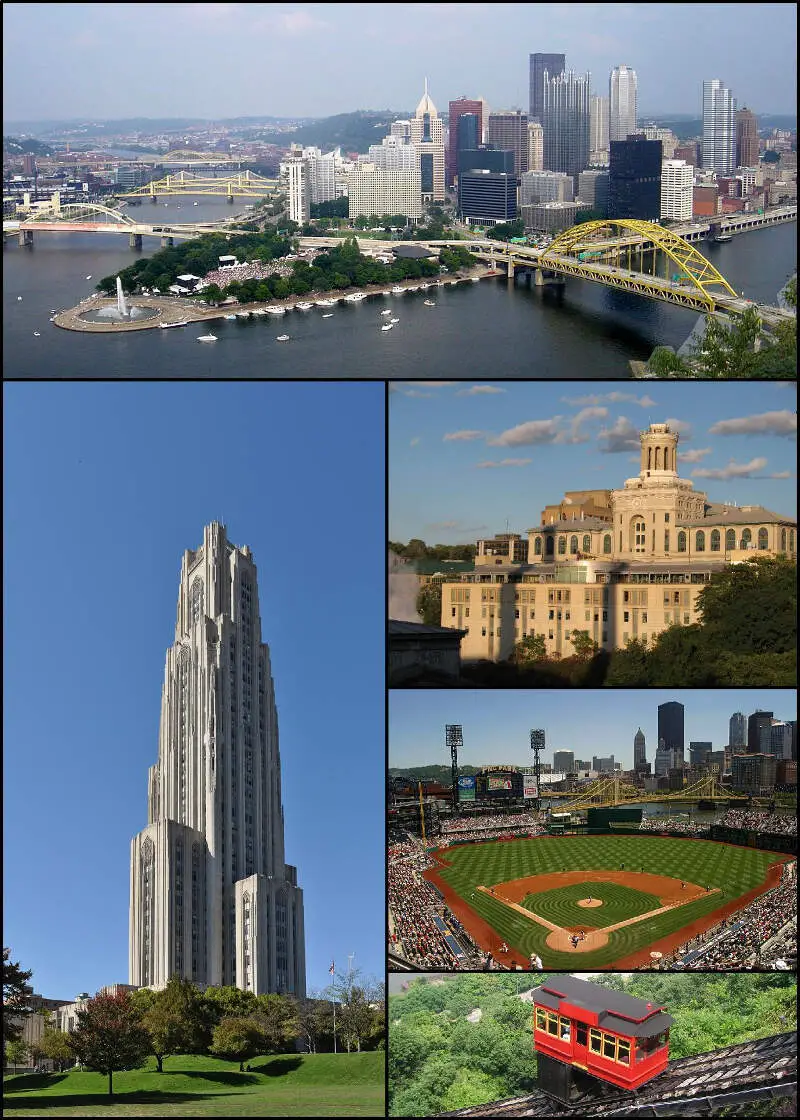
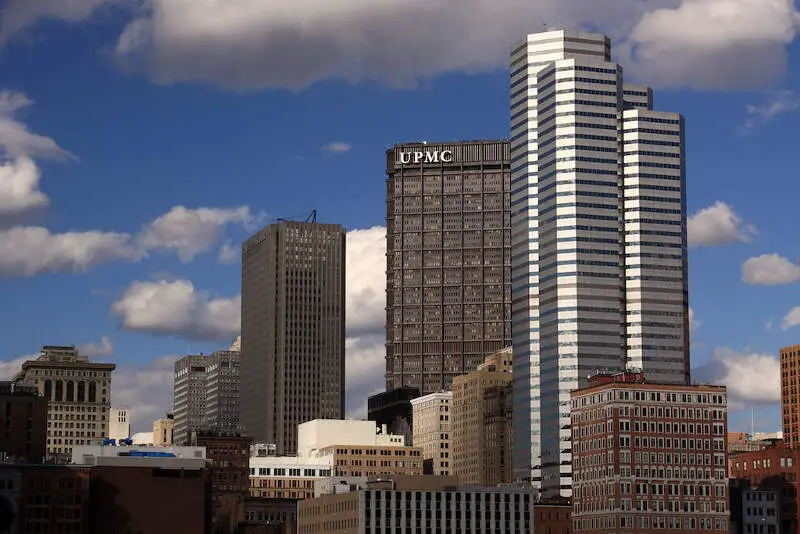
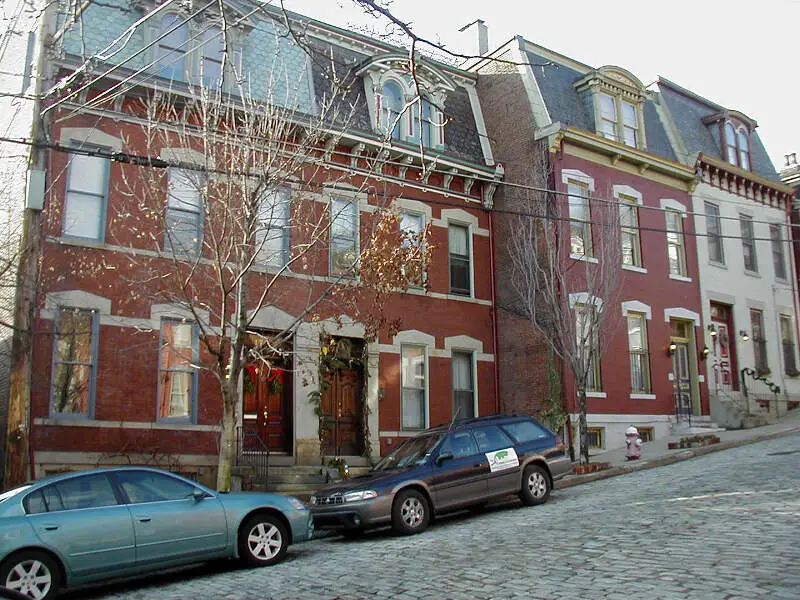
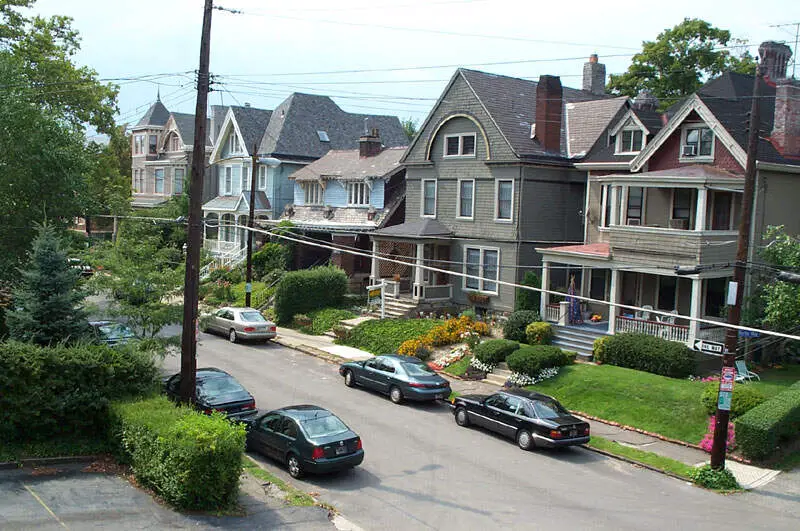
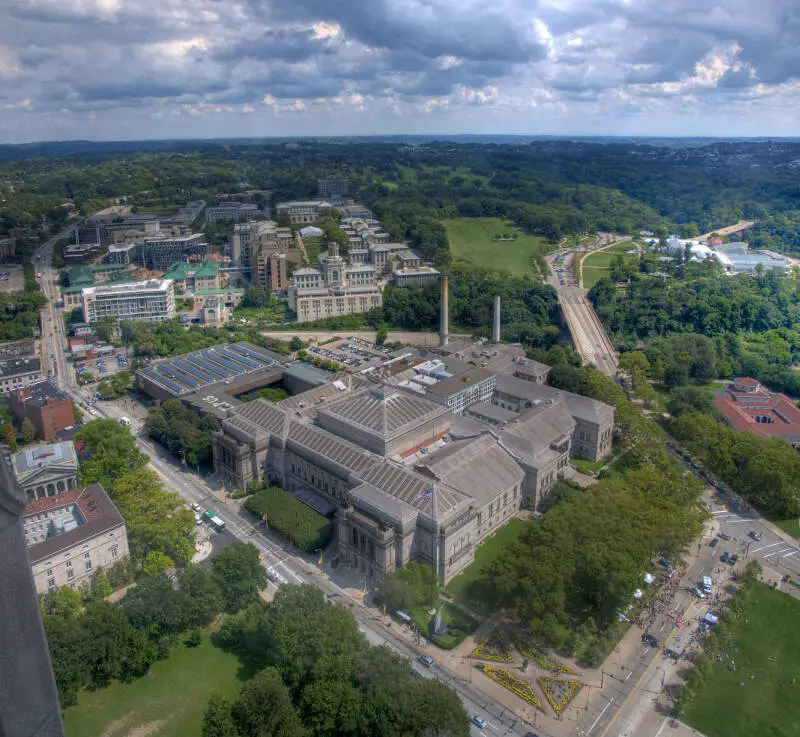
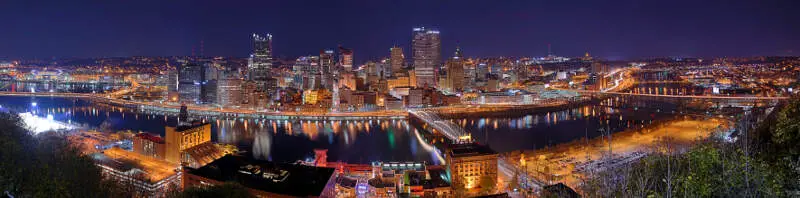
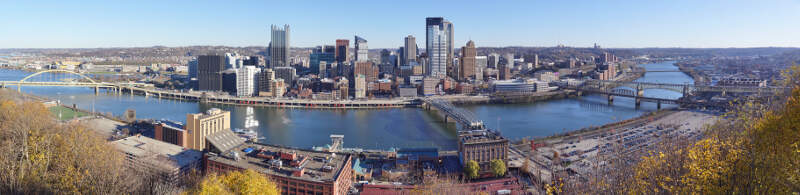
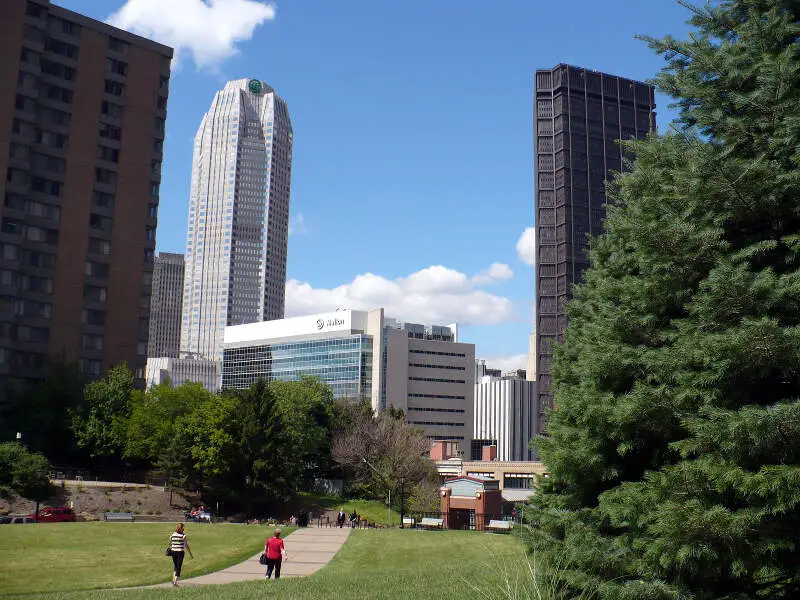
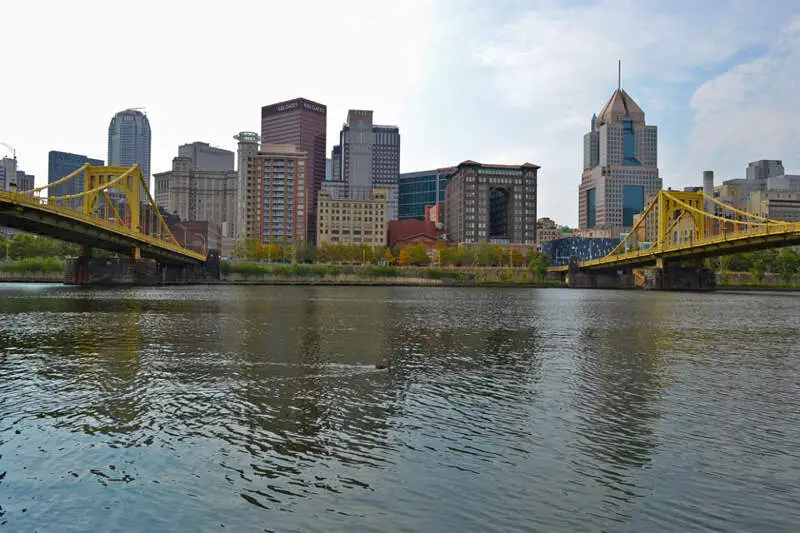
Pittsburgh, PA Photos
6 Reviews & Comments About Pittsburgh

Bruh I live in PA just south of Pittsburg and when I went to Pittsburg it was like the mafia druggies bums and just a bad town reply if you've ever been in the strip district in Pittsburgh that's a shithol
It is a smaller town but still a major city. It has a midwestern feel. People are very proud to be from Pittsburgh, but it is not very diverse, which can be problematic.
My favorite neighborhood is Shadyside. I love the skyline from Mount Washington.
It costs a lot of money to live in a decent neighborhood here - one that's easily accessible and has a low crime rate. There isn't much to do during your down time so it's hard to meet people.
If you're looking for entertainment after work, this isn't the place for you.
Pittsburgh has one of the worst school systems and recently has gained public attention for the racism in its policing. There is crime, generally most highlighted in certain, predominately poor and colored areas because Pittsburgh is one of the most segregated places I have visited. It is home to many college campuses and therefore college students, but is also considered a decent place tor raise a family. There are many sporting events if that is what your interest is and many plays and a decent art scene.
The Andy Warhol museum is a great place to visit and all of The Carnegie Museums offer an interesting way to spend an afternoon. Many broadway shows can be seen in Downtown Pittsburgh and the scenery by the many rivers makes for a great morning or evening walk/run. However the segregation is real so any area you are told to avoid is probably predominantly black and the gentrification that started with Google locating a headquarters there is saddening.
I absolutely loved our trip to Pittsburgh! Its a beautiful area that seemed low on crime and had super friendly people. No matter where you went you were greeted with a warm smile and hello. The Grist house brewery is amazing and the "Just ducky" boat tour is something every water lover needs to experience!
The National Aviary is amazing-if you love birds it is a MUST! The Pittsburgh zoo was also VERY NICE! Great variety of animals and very knowledgeable staff! My son loved it~
I enjoy visiting Pittsburgh with my family often and each time we have gone there, we have the best time. Whenever we leave we can't wait to go back. There is a feeling of country living close to everything you need and want which is so convenient. It is the perfect vacation spot for us!
There are tons of family-oriented places to go like museums and parks. The people are friendly, there's a ton of stores, restaurants, and country living. The views are beautiful all year round! The only bad I can think of is there are some rougher neighborhoods in the city but all in all, I felt safe there.
Rankings & Articles For Pittsburgh


Locations Around Pittsburgh
Map Of Pittsburgh, PA
Best Places Around Pittsburgh
Fox Chapel, PA
Population 5,246
Glenshaw, PA
Population 9,139
Franklin Park, PA
Population 15,235
Allison Park, PA
Population 22,045
Pleasant Hills, PA
Population 8,399
Forest Hills, PA
Population 6,286
Dormont, PA
Population 8,063
Castle Shannon, PA
Population 8,209
Whitehall, PA
Population 14,811
Pittsburgh Demographics And Statistics
Population over time in Pittsburgh
The current population in Pittsburgh is 304,759. The population has decreased 1.1% from 2010.
| Year | Population | % Change |
|---|---|---|
| 2024 | 304,759 | 0.4% |
| 2023 | 303,620 | -0.1% |
| 2022 | 303,843 | 0.2% |
| 2021 | 303,207 | 0.6% |
| 2020 | 301,286 | -0.3% |
| 2019 | 302,205 | -0.5% |
| 2018 | 303,587 | -0.5% |
| 2017 | 305,012 | -0.1% |
| 2016 | 305,305 | -0.2% |
| 2015 | 305,928 | -0.0% |
| 2014 | 306,045 | -0.0% |
| 2013 | 306,062 | -0.1% |
| 2012 | 306,430 | -0.4% |
| 2011 | 307,532 | -0.2% |
| 2010 | 308,003 | - |
Race / Ethnicity in Pittsburgh
See the full breakdown
Pittsburgh is:
61.9% White with 188,554 White residents.
22.1% African American with 67,304 African American residents.
0.1% American Indian with 207 American Indian residents.
6.1% Asian with 18,635 Asian residents.
0.0% Hawaiian with 36 Hawaiian residents.
0.6% Other with 1,902 Other residents.
4.8% Two Or More with 14,524 Two Or More residents.
4.5% Hispanic with 13,597 Hispanic residents.
| Race | Pittsburgh | PA | USA |
|---|---|---|---|
| White | 61.9% | 73.0% | 57.4% |
| African American | 22.1% | 10.3% | 11.9% |
| American Indian | 0.1% | 0.1% | 0.5% |
| Asian | 6.1% | 3.8% | 5.9% |
| Hawaiian | 0.0% | 0.0% | 0.2% |
| Other | 0.6% | 0.5% | 0.6% |
| Two Or More | 4.8% | 3.6% | 4.3% |
| Hispanic | 4.5% | 8.7% | 19.3% |
Gender in Pittsburgh
See the full breakdown
Pittsburgh is 51.3% female with 156,227 female residents.
Pittsburgh is 48.7% male with 148,531 male residents.
| Gender | Pittsburgh | PA | USA |
|---|---|---|---|
| Female | 51.3% | 50.7% | 50.5% |
| Male | 48.7% | 49.3% | 49.5% |
Highest level of educational attainment in Pittsburgh for adults over 25
See the full breakdown
0.0% of adults in Pittsburgh completed < 9th grade.
4.0% of adults in Pittsburgh completed 9-12th grade.
23.0% of adults in Pittsburgh completed high school / ged.
15.0% of adults in Pittsburgh completed some college.
8.0% of adults in Pittsburgh completed associate's degree.
25.0% of adults in Pittsburgh completed bachelor's degree.
15.0% of adults in Pittsburgh completed master's degree.
5.0% of adults in Pittsburgh completed professional degree.
5.0% of adults in Pittsburgh completed doctorate degree.
| Education | Pittsburgh | PA | USA |
|---|---|---|---|
| < 9th Grade | 0.0% | 3.0% | 4.0% |
| 9-12th Grade | 4.0% | 5.0% | 6.0% |
| High School / GED | 23.0% | 33.0% | 26.0% |
| Some College | 15.0% | 15.0% | 19.0% |
| Associate's Degree | 8.0% | 9.0% | 9.0% |
| Bachelor's Degree | 25.0% | 21.0% | 22.0% |
| Master's Degree | 15.0% | 10.0% | 10.0% |
| Professional Degree | 5.0% | 2.0% | 2.0% |
| Doctorate Degree | 5.0% | 2.0% | 2.0% |
Household Income For Pittsburgh, Pennsylvania
See the full breakdown
8.4% of households in Pittsburgh earn Less than $10,000.
5.5% of households in Pittsburgh earn $10,000 to $14,999.
8.1% of households in Pittsburgh earn $15,000 to $24,999.
7.2% of households in Pittsburgh earn $25,000 to $34,999.
11.0% of households in Pittsburgh earn $35,000 to $49,999.
15.9% of households in Pittsburgh earn $50,000 to $74,999.
11.9% of households in Pittsburgh earn $75,000 to $99,999.
14.5% of households in Pittsburgh earn $100,000 to $149,999.
7.3% of households in Pittsburgh earn $150,000 to $199,999.
10.3% of households in Pittsburgh earn $200,000 or more.
| Income | Pittsburgh | PA | USA |
|---|---|---|---|
| Less than $10,000 | 8.4% | 4.9% | 5.0% |
| $10,000 to $14,999 | 5.5% | 3.5% | 3.4% |
| $15,000 to $24,999 | 8.1% | 6.7% | 6.3% |
| $25,000 to $34,999 | 7.2% | 6.9% | 6.6% |
| $35,000 to $49,999 | 11.0% | 10.5% | 10.1% |
| $50,000 to $74,999 | 15.9% | 15.9% | 15.5% |
| $75,000 to $99,999 | 11.9% | 12.8% | 12.6% |
| $100,000 to $149,999 | 14.5% | 17.7% | 17.5% |
| $150,000 to $199,999 | 7.3% | 9.3% | 9.6% |
| $200,000 or more | 10.3% | 11.8% | 13.4% |
Source: U.S. Census ACS 5-year estimates (2024)


