Dallasvs.Pittsburgh Which City Is Right for You in 2026?
A head-to-head guide to cost of living, jobs, transportation, weather, crime, and quality of life — so you can decide where to live, work, or visit.
Updated 2026-05-26 · By HomeSnacks Editorial
Dallas vs. Pittsburgh at a glance
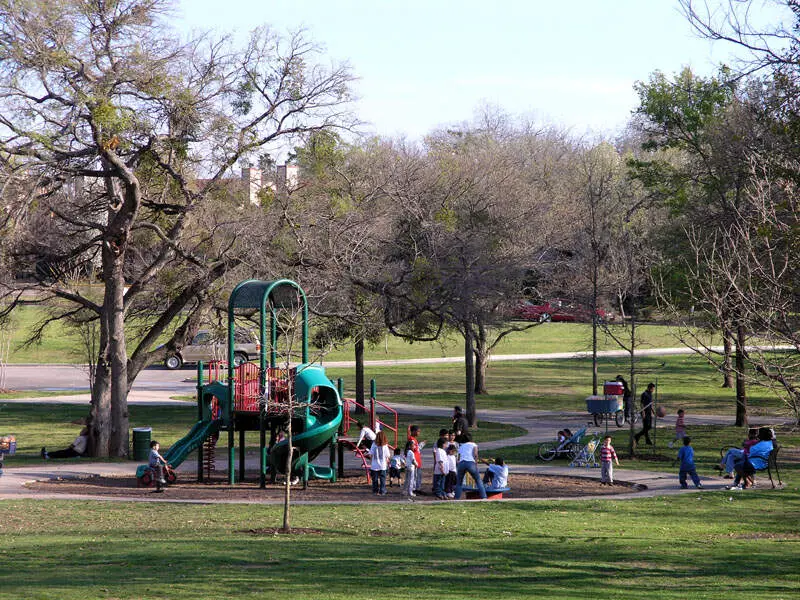
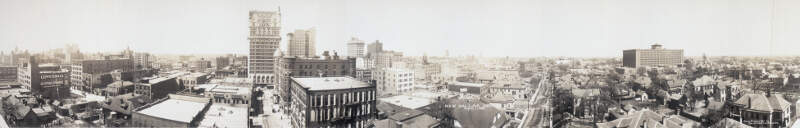
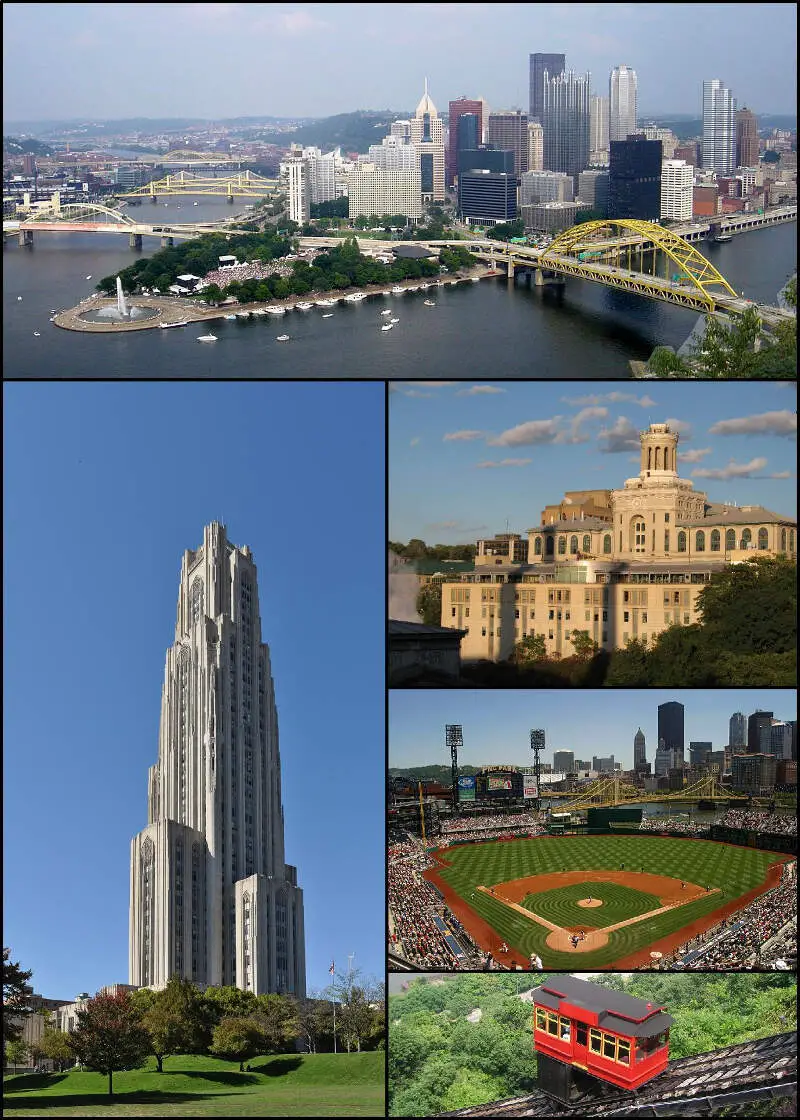
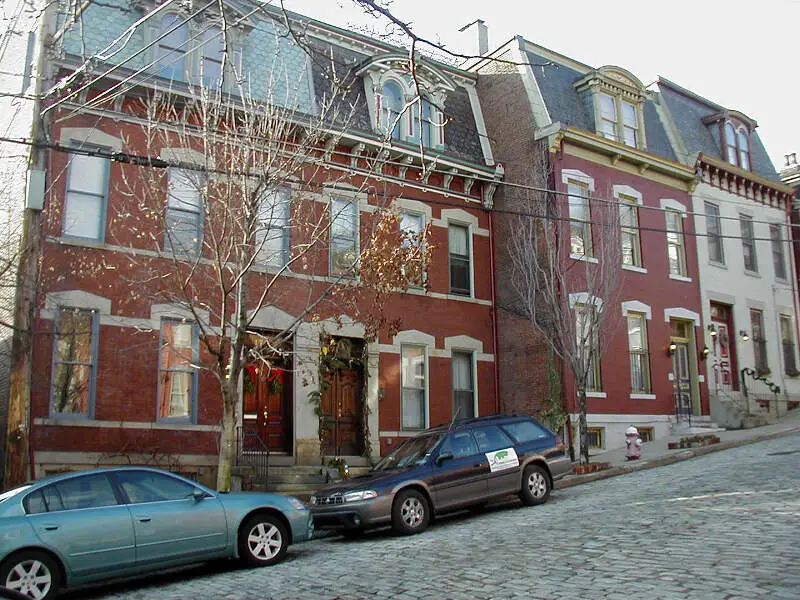
Dallas, TX and Pittsburgh, PA sit at very different points on the U.S. map — and the numbers reflect it. Dallas is a city in the U.S. state of Texas. Located in the state's northern region, it is the ninth-most populous city in the United States and third-most populous city in Texas, with a population of 1.3 million at the 2020 census. Pittsburgh is a city in Allegheny County, Pennsylvania, United States, and its county seat.
On cost of living, Pittsburgh is the cheaper city: its overall index sits at 98 versus 106 in Dallas (100 = national average). Median home values run $309,420 in Dallas and $237,533 in Pittsburgh, with median rents at $1,472 and $1,261 respectively. That puts the home-value-to-income ratio at 4.4x in Dallas versus 3.6x in Pittsburgh.
Public safety is another point of divergence. Pittsburgh reports 2,707 total crimes per 100,000 residents annually versus 4,010 in Dallas. Dallas is the more racially diverse of the two on a Herfindahl index basis — Dallas skews 43% Hispanic while Pittsburgh skews 62% White. On HomeSnacks' overall SnackAbility score, Pittsburgh edges ahead at 7/10 versus 5/10 for Dallas.
Dallas vs. Pittsburgh in photos
A side-by-side look at each city.


Cost of living
Pittsburgh is the cheaper city overall — 8% higher in Dallas than its rival. Index baseline: 100 = national average.
| Living expense | Dallas | Pittsburgh | US average |
|---|---|---|---|
| Overall | 106 | 98 | 100 |
| Services | 102 | 97 | 100 |
| Groceries | 103 | 101 | 100 |
| Health | 115 | 84 | 100 |
| Housing | 106 | 105 | 100 |
| Transportation | 108 | 106 | 100 |
| Utilities | 104 | 99 | 100 |
Lower index = cheaper. 100 = U.S. national average. Bar inside each cell scales relative to the highest value in the table.
Sources: HomeSnacks Cost of Living indices, normalized so 100 = U.S. national average. Drill in: Dallas cost of living, Pittsburgh cost of living, or the cheapest cities in America.
Housing breakdown
Home prices are higher in Dallas. Compare absolute price and price-to-income — a $500k home in a $100k-income city is very different from one in a $50k-income city.
| Metric | Dallas | Pittsburgh | United States |
|---|---|---|---|
| Median Home Value | $309,420 | $237,533 | $332,700 |
| Median Rent | $1,472 | $1,261 | $1,413 |
| Median Income | $70,518 | $65,742 | $80,734 |
| Home Value To Income | 4.4x | 3.6x | 4.1x |
| Rent To Monthly Income | 0.25x | 0.23x | 0.21x |
Source: U.S. Census Bureau ACS 2020-2024. See also states with the highest rent in America.
Crime
Pittsburgh is the safer city — total crime rate of 2,707 per 100k people vs 4,010 for Dallas. US average: 2,119.
| Crime (per 100k) | Dallas | Pittsburgh | US average |
|---|---|---|---|
| Total crime | 4,010 | 2,707 | 2,119 |
| Murder | 14 | 11 | 5 |
| Robbery | 169 | 124 | 61 |
| Aggravated Assault | 440 | 240 | 256 |
| Violent Crime | 658 | 427 | 359 |
| Burglary | 464 | 233 | 229 |
| Larceny | 1,787 | 1,704 | 1,272 |
| Car Theft | 1,100 | 343 | 259 |
| Property Crime | 3,352 | 2,280 | 1,760 |
Lower = safer. Bar inside each cell scales relative to the highest crime rate in the table.
Source: FBI Uniform Crime Reporting (2024). All rates are per 100,000 people. City pages: Dallas crime, Pittsburgh crime. See also: safest cities in America.
Diversity
Dallas is more racially diverse — lower HHI (closer to 0) means a more even mix across groups.
| Group | Dallas | Pittsburgh | United States |
|---|---|---|---|
| White | 27.6% | 61.9% | 57.4% |
| African American | 22.9% | 22.1% | 11.9% |
| American Indian | 0.2% | 0.1% | 0.5% |
| Asian | 3.8% | 6.1% | 5.9% |
| Hawaiian | 0.1% | 0.0% | 0.2% |
| Other | 0.3% | 0.6% | 0.6% |
| Two Or More | 2.6% | 4.8% | 4.3% |
| Hispanic | 42.6% | 4.5% | 19.3% |
Source: U.S. Census ACS 2020-2024. Lower HHI = more even racial mix. See also: most diverse cities in America.
SnackAbility — overall quality of life
Pittsburgh scores higher overall — 7/10 vs 5/10. SnackAbility is our 1–10 quality-of-life score; the median U.S. city scores a 7.
SnackAbility is a HomeSnacks proprietary 1–10 score blending jobs, housing, education, commute, amenities, affordability, crime, and diversity. Median U.S. city ≈ 7. Data: Census, BLS, FBI. See also: best places to live in America.
Getting around: Dallas vs. Pittsburgh
How each city handles commuting, transit, walkability, and car culture — the day-to-day reality that shapes where you'd actually want to live.
Dallas is built for the car. With 1.3 million residents spread across a sprawling footprint (nearly four times Pittsburgh's population), most people depend on I-35E, I-30, and the LBJ Freeway for daily movement. Traffic around the Mixmaster interchange is a daily reality.
DART's light rail covers major corridors into downtown and the suburbs, but headways are long and park-and-ride is the norm rather than a true walk-on system.
Pittsburgh packs more into a smaller, hillier geography. The Pittsburgh Regional Transit T-line connects the South Hills to downtown, and a dense bus network threads through neighborhoods like Shadyside and Lawrenceville.
Narrow streets, steep grades, and 446 bridges give driving its own learning curve. If you're coming from a walkable lifestyle, Pittsburgh's neighborhoods reward that more readily than Dallas does.
Jobs and careers in Dallas vs. Pittsburgh
The local job market, dominant industries, and which city to choose based on your career.
Dallas has one of the country's strongest job markets. AT&T, Southwest Airlines, Texas Instruments, and Toyota's North American headquarters (just north in Plano) drive a diverse economy spanning tech, finance, telecom, and logistics. No state income tax puts more of a median household income of $70,518 directly in your pocket.
The Uptown and Legacy West corridors have drawn significant corporate relocations and tech campuses, and hiring has stayed resilient even in tighter national markets.
Pittsburgh has rebuilt its economy around healthcare, education, and tech. UPMC is the region's dominant employer, and Carnegie Mellon University drives a real robotics and AI cluster that has attracted Amazon, Google, and Uber to open engineering offices here. Median household income of $65,742 trails Dallas, but with a cost of living index of 98 versus Dallas's 106, your dollar goes further in Pittsburgh.
Weather and climate
What to expect day-to-day — sun, fog, heat, rain, and the seasonal extremes that shape the lifestyle.
Expect heat in Dallas, serious and sustained. Summers routinely push past 100°F, and stretches of two weeks or more in triple digits aren't unusual.
Dallas gets roughly 234 sunny days a year and mild winters. Tornado season runs spring through early summer, and an ice storm every few years can paralyze a city not built for freezing rain.
Pittsburgh sits in a completely different climate band. Winters are cold and gray: the city ranks among the cloudiest in the country, averaging around 59 clear days annually, with lake-effect snow possible from November through March.
Summers are comfortable, though, with highs in the low-to-mid 80s and lower humidity than most of the East Coast. If you struggle with extreme heat, Pittsburgh's summer is a genuine advantage over Dallas.
Culture, nightlife, and entertainment
Food, music, neighborhoods, and the city vibe that gives each place its personality.
Dallas has the scale for big-city culture. Deep Ellum delivers live music and dive bars seven nights a week; the Arts District is home to the Dallas Museum of Art, the Nasher Sculpture Center, and the AT&T Performing Arts Center.
The Cowboys, Mavericks, Rangers, and Stars all play within 30 miles. Bishop Arts District and Lower Greenville add a neighborhood-scale dining and bar scene that has matured considerably over the last decade.
Pittsburgh has real cultural depth for a city its size. The Andy Warhol Museum and Carnegie Museum of Natural History anchor it, with a theater scene along Penn Avenue filling out the calendar.
The South Side's East Carson Street is one of the most walkable bar corridors in any mid-sized American city. Steelers fandom here functions as civic identity, not just sports enthusiasm.
The Strip District on a Saturday morning, with its produce vendors and old-school delis, offers a neighborhood energy Dallas's sprawl rarely replicates.
Outdoor activities and day trips
Parks, beaches, hikes, and the weekend escapes that define life outside the city limits.
Dallas is flat, which cuts both ways. Cycling and running are straightforward along the Katy Trail and the Trinity River Greenbelt, and White Rock Lake offers a popular 9-mile loop close to the city core.
Lake Ray Hubbard and Lake Lewisville are easy day trips for bigger water. The summer heat compresses useful outdoor time into early mornings and evenings from June through September, so plan accordingly.
Pittsburgh's three rivers and surrounding hills create a more varied outdoor landscape in a smaller radius. Frick Park and Schenley Park offer serious trail running right inside the city limits.
Point State Park, at the confluence of the Allegheny, Monongahela, and Ohio rivers, is a genuine urban greenspace. For bigger adventures, Ohiopyle State Park in the Laurel Highlands (whitewater rafting, mountain biking, the Great Allegheny Passage trail) sits only about 60 miles southeast, a day trip Dallas has no equivalent to.
Bottom line: which city is right for you?
Based on the head-to-head data above, here's the short version — pick the city that lines up with what you actually care about.
Choose Dallas if you prioritize…
- more affordable housing relative to Pittsburgh.
- a more racially diverse community (lower HHI on Census data).
Choose Pittsburgh if you prioritize…
- a lower cost of living (cheaper groceries, services, and day-to-day expenses).
- lower crime — a safer place to live, work, and raise a family.
- a higher overall SnackAbility quality-of-life score.
Methodology: winners are picked from public data — U.S. Census Bureau ACS (income, home value, rent, race/HHI), FBI Uniform Crime Reporting (crime rates per 100k), and HomeSnacks' proprietary SnackAbility quality-of-life score, which blends Bureau of Labor Statistics data with the above.
More about Texas & Pennsylvania

Best Places To Live In Texas
Photo: Public domain
Cheapest Places To Live In Texas
Photo: Public domain
Most Dangerous Places In Texas
Photo: Public domain
Best Places To Raise A Family In Texas
Photo: Public domain
Best Places To Retire In Texas
Photo: Public domain
Richest Cities In Texas
Photo: Public domain
Safest Places In Texas
Photo: Public domain
Worst Places To Live In Texas
Photo: Public domain