You’re probably never going to make enough money to live in the richest counties in Minnesota.
The median household income in Carver County, the richest county in Minnesota is $125,946, significantly higher than the US median of $74,580, which means based purely on math most people never make enough to live there.
And that’s okay because it’s still fun to look at the people living in the lap of luxury.
So we used Saturday Night Science and the most recent Census to rank home prices and incomes for all 87 counties in the North Star State. Let’s star gaze together.
Table Of Contents: Top Ten | Methodology | Table | Summary
The 10 Richest Counties In Minnesota For 2026
What is the richest county in Minnesota? The richest county in Minnesota is Carver County. In contrast, the poorest county in state is Traverse County, according to the Census data.
Now you know exactly where to move in Minnesota. Keep on reading for more about the top ten and a detailed methodology.
Or, check out the best places to live in Minnesota and the cheapest places to live in Minnesota.
The Richest Counties In Minnesota For 2026
1. Carver County

Biggest Place: Chaska
Population: 110,041
Median Income: $125,946 (highest)
Median Home Price: $483,655 (highest)
More on Carver County: Data
2. Scott County
Biggest Place: Shakopee
Population: 154,557
Median Income: $119,314 (2nd highest)
Median Home Price: $441,654 (2nd highest)
More on Scott County: Data
3. Washington County
Biggest Place: Woodbury
Population: 276,238
Median Income: $115,345 (3rd highest)
Median Home Price: $440,692 (3rd highest)
More on Washington County: Data
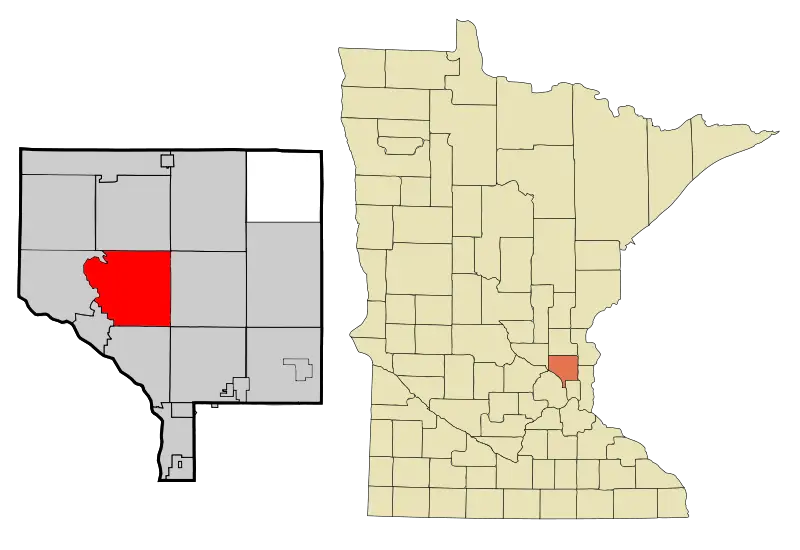
4. Wright County
Biggest Place: Otsego
Population: 148,269
Median Income: $107,209 (4th highest)
Median Home Price: $388,429 (6th highest)
More on Wright County: Data
5. Dakota County

Biggest Place: Lakeville
Population: 445,771
Median Income: $106,318 (5th highest)
Median Home Price: $395,251 (5th highest)
More on Dakota County: Data
6. Sherburne County
Biggest Place: St. Cloud
Population: 100,560
Median Income: $105,466 (6th highest)
Median Home Price: $383,718 (8th highest)
More on Sherburne County: Data
7. Hennepin County
Biggest Place: Minneapolis
Population: 1,269,496
Median Income: $97,653 (9th highest)
Median Home Price: $387,852 (7th highest)
More on Hennepin County: Data
8. Chisago County
Biggest Place: North Branch
Population: 57,991
Median Income: $99,400 (8th highest)
Median Home Price: $378,343 (9th highest)
More on Chisago County: Data
9. Anoka County
Biggest Place: Blaine
Population: 370,349
Median Income: $101,869 (7th highest)
Median Home Price: $367,949 (10th highest)
More on Anoka County: Data
10. Le Sueur County
Biggest Place: Mankato
Population: 29,113
Median Income: $94,968 (12th highest)
Median Home Price: $351,272 (12th highest)
More on Le Sueur County: Data
Methodology: How do you determine which Minnesota county is the richest?
To determine the richest county in Minnesota, we have to look at a handful of metrics that correlate with how rich people are. To do that, we made assumptions about what makes a county rich. For reference, we are trying to make the kind of argument you’d make at a bar using facts, Saturday Night Science.
With that in mind, we went to the American Community Survey data and Zillow for the most recent reporting period for data on the following:
- Average Home Price
- Median Income
We then ranked each county in Minnesota for each of the criteria from one to 87, with one being the richest.
Taking the average rank across the two criteria, we created a Rich Score with the county posting the lowest overall score being the “Richest County In Minnesota.”
The result is some of the places with the most expensive real estate and highest earners in the North Star State.
We updated this article for 2026. This report is our first time ranking the richest counties to live in Minnesota. We have also ranked the richest states and richest cities in the United States.
Summary: The Richest Counties In Minnesota For 2026
Living in Minnesota can vary from one part of the state to the next, with pretty extreme variance in home prices and incomes across counties.
The richest counties in Minnesota are Carver County, Scott County, Washington County, Wright County, Dakota County, Sherburne County, Hennepin County, Chisago County, Anoka County, and Le Sueur County.
Now you know the parts of the state where Goodwill will have the best goodies, and that’s what you came here to learn at the end of the day.
You are welcome.
Here’s a look at the poorest counties in Minnesota according to the data:
- Traverse County
- Faribault County
- Koochiching County
For more Minnesota reading, check out:
- Cheapest Places To Live In Minnesota
- Richest Cities In Minnesota
- Best Places To Live In Minnesota
- Best Counties To Live In Minnesota
Detailed List Of The Richest Counties In Minnesota
| Rank | County | Population | Median Income | Average Home Price |
|---|---|---|---|---|
| 1 | Carver County | 110,041 | $125,946 | $483,655 |
| 2 | Scott County | 154,557 | $119,314 | $441,654 |
| 3 | Washington County | 276,238 | $115,345 | $440,692 |
| 4 | Wright County | 148,269 | $107,209 | $388,429 |
| 5 | Dakota County | 445,771 | $106,318 | $395,251 |
| 6 | Sherburne County | 100,560 | $105,466 | $383,718 |
| 7 | Hennepin County | 1,269,496 | $97,653 | $387,852 |
| 8 | Chisago County | 57,991 | $99,400 | $378,343 |
| 9 | Anoka County | 370,349 | $101,869 | $367,949 |
| 10 | Le Sueur County | 29,113 | $94,968 | $351,272 |
| 11 | Olmsted County | 164,498 | $95,406 | $347,632 |
| 12 | Rice County | 67,917 | $83,181 | $344,689 |
| 13 | Isanti County | 42,596 | $87,440 | $334,413 |
| 14 | Dodge County | 21,045 | $95,739 | $322,430 |
| 15 | Ramsey County | 542,945 | $81,568 | $336,493 |
| 16 | Goodhue County | 47,943 | $84,171 | $322,013 |
| 17 | Douglas County | 39,575 | $79,043 | $337,107 |
| 18 | Wabasha County | 21,565 | $82,007 | $307,048 |
| 19 | Houston County | 18,653 | $79,825 | $317,202 |
| 20 | Steele County | 37,439 | $84,196 | $292,373 |
| 21 | Nicollet County | 34,411 | $79,756 | $310,840 |
| 22 | Clay County | 66,059 | $81,172 | $294,252 |
| 23 | Pope County | 11,418 | $76,220 | $328,244 |
| 24 | Carlton County | 36,518 | $80,573 | $292,855 |
| 25 | Stearns County | 160,865 | $77,066 | $312,501 |
| 26 | Cook County | 5,635 | $72,638 | $423,365 |
| 27 | Mcleod County | 36,798 | $80,084 | $291,893 |
| 28 | Sibley County | 15,005 | $77,634 | $282,130 |
| 29 | Crow Wing County | 67,686 | $72,589 | $362,465 |
| 30 | Fillmore County | 21,414 | $77,512 | $280,107 |
| 31 | Kandiyohi County | 44,079 | $76,592 | $275,544 |
| 32 | Blue Earth County | 69,871 | $74,477 | $300,116 |
| 33 | Benton County | 41,593 | $74,410 | $303,855 |
| 34 | Becker County | 35,343 | $71,388 | $347,851 |
| 35 | Meeker County | 23,468 | $75,446 | $286,407 |
| 36 | Otter Tail County | 60,475 | $72,255 | $323,150 |
| 37 | Mille Lacs County | 27,125 | $72,729 | $306,035 |
| 38 | Lake County | 10,879 | $75,541 | $272,294 |
| 39 | Waseca County | 18,885 | $76,261 | $249,600 |
| 40 | Hubbard County | 21,831 | $71,995 | $312,005 |
| 41 | Lake Of The Woods County | 3,821 | $77,546 | $227,172 |
| 42 | Cass County | 30,992 | $68,874 | $334,054 |
| 43 | Red Lake County | 3,915 | $77,188 | $211,300 |
| 44 | Jackson County | 9,933 | $75,743 | $221,299 |
| 45 | Murray County | 8,097 | $74,033 | $243,555 |
| 46 | Polk County | 30,705 | $73,107 | $244,862 |
| 47 | Morrison County | 34,249 | $69,446 | $303,389 |
| 48 | Pennington County | 13,791 | $77,325 | $190,508 |
| 49 | Kanabec County | 16,390 | $71,460 | $265,306 |
| 50 | Roseau County | 15,302 | $74,474 | $218,852 |
| 51 | Grant County | 6,127 | $73,917 | $229,858 |
| 52 | Stevens County | 9,739 | $75,733 | $209,674 |
| 53 | Lyon County | 25,503 | $75,303 | $214,037 |
| 54 | Rock County | 9,621 | $71,295 | $265,355 |
| 55 | Winona County | 49,779 | $70,744 | $273,187 |
| 56 | Pine County | 29,640 | $71,146 | $253,269 |
| 57 | Kittson County | 4,084 | $76,100 | $166,135 |
| 58 | Mower County | 40,343 | $73,074 | $199,052 |
| 59 | Beltrami County | 46,512 | $68,975 | $261,029 |
| 60 | Chippewa County | 12,377 | $71,458 | $220,852 |
| 61 | Marshall County | 8,909 | $72,543 | $207,227 |
| 62 | Wilkin County | 6,371 | $71,410 | $216,759 |
| 63 | St. Louis County | 200,123 | $70,069 | $233,077 |
| 64 | Todd County | 25,575 | $67,662 | $259,272 |
| 65 | Lac Qui Parle County | 6,682 | $74,432 | $165,912 |
| 66 | Brown County | 25,800 | $69,378 | $241,190 |
| 67 | Yellow Medicine County | 9,451 | $74,000 | $169,365 |
| 68 | Aitkin County | 16,056 | $60,833 | $268,115 |
| 69 | Itasca County | 45,275 | $68,603 | $241,941 |
| 70 | Clearwater County | 8,616 | $64,475 | $246,480 |
| 71 | Cottonwood County | 11,458 | $72,941 | $160,479 |
| 72 | Norman County | 6,367 | $72,260 | $172,481 |
| 73 | Nobles County | 22,041 | $66,101 | $235,209 |
| 74 | Freeborn County | 30,623 | $71,023 | $191,496 |
| 75 | Watonwan County | 11,205 | $71,699 | $171,371 |
| 76 | Lincoln County | 5,603 | $69,694 | $198,582 |
| 77 | Big Stone County | 5,127 | $70,400 | $193,279 |
| 78 | Pipestone County | 9,284 | $69,628 | $193,589 |
| 79 | Renville County | 14,558 | $70,625 | $189,696 |
| 80 | Wadena County | 14,256 | $61,467 | $223,828 |
| 81 | Martin County | 19,780 | $59,507 | $214,070 |
| 82 | Redwood County | 15,350 | $67,866 | $178,762 |
| 83 | Swift County | 9,748 | $60,412 | $188,707 |
| 84 | Mahnomen County | 5,358 | $59,441 | $179,667 |
| 85 | Koochiching County | 11,833 | $66,940 | $154,275 |
| 86 | Faribault County | 13,914 | $66,815 | $158,994 |
| 87 | Traverse County | 3,243 | $62,989 | $147,483 |


