Every city has safe neighborhoods and dangerous neighborhhods. We believe you should know which neighborhoods in Irvine are the safest before you move.
Every year, more than 30 million Americans move. Sometimes, its for a job, other times its to escape the big city. But no matter where you move, you want a neighborhood thats family friendly, clean, and most importantly, safe.
Weve analyzed the FBI crime reports data on violent and property crimes for every single neighborhood in Irvine. Then, we calculated your chances of being the victim of a crime in each one.
What Irvine neighborhoods can you leave your doors unlocked at night? Heres the list.
Which neighborhood is the safest in Irvine in 2025? That would be Shady Canyon. Thats according to the most recent FBI crime data, which takes into account everything from thefts and robberies to assaults and murders.
If you dont see a neighborhood youre looking for in our top , scroll down to the bottom, where we have all Irvine neighborhoods listed in order from safest to most dangerous.
For more California reading, check out:
- Safest Cities To Live In America
- Safest States To Live In America
- Worst neighborhoods in Irvine
- Best neighborhoods to live in Irvine.
Table Of Contents: Top 10 | Methodology | Summary | Table
The 10 Safest Neighborhoods To Live In Irvine For 2025
1. Shady Canyon
/10
Population: 777
Violent Crimes Per 100k: 20
Property Crime Per 100k: 599
More on Shady Canyon:
2. Turtle Ridge
/10
Population: 2,295
Violent Crimes Per 100k: 33
Property Crime Per 100k: 602
More on Turtle Ridge:
3. Uc Irvine
/10
Population: 15,807
Violent Crimes Per 100k: 28
Property Crime Per 100k: 732
More on Uc Irvine:
4. University Park
/10
Population: 7,885
Violent Crimes Per 100k: 44
Property Crime Per 100k: 952
More on University Park:
5. Oak Creek
/10
Population: 10,018
Violent Crimes Per 100k: 45
Property Crime Per 100k: 983
More on Oak Creek:
6. Turtle Rock

/10
Population: 10,186
Violent Crimes Per 100k: 49
Property Crime Per 100k: 1,088
More on Turtle Rock:
7. Northwood Point
/10
Population: 7,561
Violent Crimes Per 100k: 34
Property Crime Per 100k: 1,441
More on Northwood Point:
8. Woodbridge
/10
Population: 24,966
Violent Crimes Per 100k: 64
Property Crime Per 100k: 1,033
More on Woodbridge:
9. Northwood
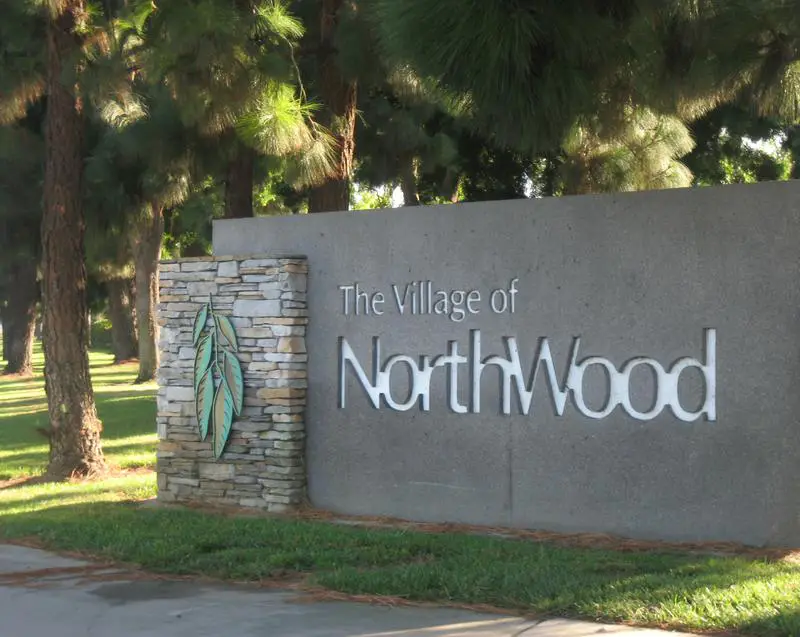
/10
Population: 22,218
Violent Crimes Per 100k: 49
Property Crime Per 100k: 1,319
More on Northwood:
10. El Camino Real
/10
Population: 15,999
Violent Crimes Per 100k: 51
Property Crime Per 100k: 1,201
More on El Camino Real:
Methodology: How We Determined The Safest Irvine Hoods In 2025
You can ask people which neighborhoods are the safest, or you can look at the unbiased raw data. We choose data.
Instead of relying on speculation and opinion, we used Saturday Night Science to analyze the numbers from the FBI’s most recent crime report for every neighborhood in Irvine.
To be more specific, we analyzed the FBI’s Uniform Crime Report. We then ran an analysis to calculate each neighborhood’s property and violent crimes per capita. We used the following criteria:
- Total Crimes Per Capita
- Violent Crimes Per Capita
- Property Crimes Per Capita
We then ranked each neighborhood with scores from 1 to 23 in each category, where 1 was the safest.
Next, we averaged the rankings for each neighborhood to create a safe neighborhood index.
Finally, we crowned the neighborhood with the lowest safest neighborhood index the “Safest City Neighborhood In Irvine.” We’re lookin’ at you, Shady Canyon.
We updated this article for 2025. This is our fourth time ranking the safest neighborhoods in Irvine.
Skip to the end to see the list of all the neighborhoods in the city, from safest to most expensive.
Summary: The Safest Places In Irvine
Looking at the data, you can tell that Shady Canyon is as safe as they come, according to science and data.
The safest neighborhoods in Irvine are Shady Canyon, Turtle Ridge, Uc Irvine, University Park, Oak Creek, Turtle Rock, Northwood Point, Woodbridge, Northwood, and El Camino Real.
But as most California residents would agree, almost every place here has its safe and not safe parts. So make sure you’re informed ahead of time.
The most dangerous neighborhoods in Irvine are Quail Hill, Irvine Health And Science Complex, Spectrum, El Toro Marine Air Station, and San Joaquin Marsh.
We ranked the neighborhoods from safest to most dangerous in the chart below.
For more California reading, check out:
- Best Places To Live In California
- Cheapest Places To Live In California
- Most Dangerous Cities In California
- Richest Cities In California
- Safest Places In California
- Worst Places To Live In California
Detailed List Of The Safest Neighborhoods To Live In Irvine For 2025
| Rank | Neighborhood | Crime Per 100K |
|---|---|---|
| 1 | Shady Canyon | 620 |
| 2 | Turtle Ridge | 635 |
| 3 | Uc Irvine | 760 |
| 4 | University Park | 996 |
| 5 | Oak Creek | 1,028 |
| 6 | Turtle Rock | 1,137 |
| 7 | Northwood Point | 1,475 |
| 8 | Woodbridge | 1,097 |
| 9 | Northwood | 1,368 |
| 10 | El Camino Real | 1,252 |
| 11 | West Park | 1,596 |
| 12 | University Town Center | 1,490 |
| 13 | Lower Peters Canyon | 1,823 |
| 14 | Business District | 1,827 |
| 15 | East Industrial Complex | 4,585 |
| 16 | Rancho San Joaquin | 1,829 |
| 17 | Walnut Village | 1,926 |
| 18 | Great Park | 2,480 |
| 19 | San Joaquin Marsh | 3,871 |
| 20 | El Toro Marine Air Station | 2,490 |
| 21 | Spectrum | 2,912 |
| 22 | Irvine Health And Science Complex | 9,491 |
| 23 | Quail Hill | 13,858 |