Compare Seattle to…
Seattle SnackAbility
Overall SnackAbility
Crime in Seattle summary. We use data from the FBI to determine the crime rates in Seattle. Key points include:
There were 43,952 total crimes in Seattle in the last reporting year.
The overall crime rate per 100,000 people in Seattle is 5,782.7 / 100k people.
The violent crime rate per 100,000 people in Seattle is 775.1 / 100k people.
The property crime rate per 100,000 people in Seattle is 5,007.6 / 100k people.
Overall, crime in Seattle is 172.87% above the national average.
Total Crimes
Above National Average
Crime In Seattle Comparison Table
| Statistic | Count Raw |
Seattle / 100k People |
Washington / 100k People |
National / 100k People |
|---|---|---|---|---|
| Total Crimes Per 100K | 43,952 | 5,782.7 | 2,792.6 | 2,119.2 |
| Violent Crime | 5,891 | 775.1 | 326.1 | 359.0 |
| Murder | 52 | 6.8 | 3.8 | 5.0 |
| Robbery | 1,677 | 220.6 | 67.5 | 61.0 |
| Aggravated Assault | 3,810 | 501.3 | 217.0 | 256.0 |
| Property Crime | 38,061 | 5,007.6 | 2,466.5 | 1,760.0 |
| Burglary | 8,756 | 1,152.0 | 398.8 | 229.0 |
| Larceny | 21,905 | 2,882.0 | 1,634.2 | 1,272.0 |
| Car Theft | 7,400 | 973.6 | 433.5 | 259.0 |
Source: FBI Uniform Crime Reporting (2024)
Cost of living in Seattle summary. We use data on the cost of living to determine how expensive it is to live in Seattle. Real estate prices drive most of the variance in cost of living around Washington. Key points include:
The cost of living in Seattle is 181 with 100 being average.
The cost of living in Seattle is 1.8x higher than the national average.
The median home value in Seattle is $868,680.
The median income in Seattle is $123,860.
Seattle's Overall Cost Of Living
Higher Than The National Average
Cost Of Living In Seattle Comparison Table
| Living Expense | Seattle | Washington | National Average |
|---|---|---|---|
| Overall | 181 | 120 | 100 |
| Services | 107 | 108 | 100 |
| Groceries | 111 | 108 | 100 |
| Health | 326 | 137 | 100 |
| Housing | 125 | 111 | 100 |
| Transportation | 112 | 111 | 100 |
| Utilities | 123 | 110 | 100 |
Source: Cost of living index, normalized to US average = 100
Seattle, WA Weather
The average high in Seattle is 59.9° and the average low is 45.1°.
There are 92.1 days of precipitation each year.
Expect an average of 36.6 inches of precipitation each year with 5.0 inches of snow.
| Stat | Seattle |
|---|---|
| Average Annual High | 59.9 |
| Average Annual Low | 45.1 |
| Annual Precipitation Days | 92.1 |
| Average Annual Precipitation | 36.6 |
| Average Annual Snowfall | 5.0 |
Average High
Days of Rain
Source: NOAA climate normals (30-year)
Seattle, WA Photos
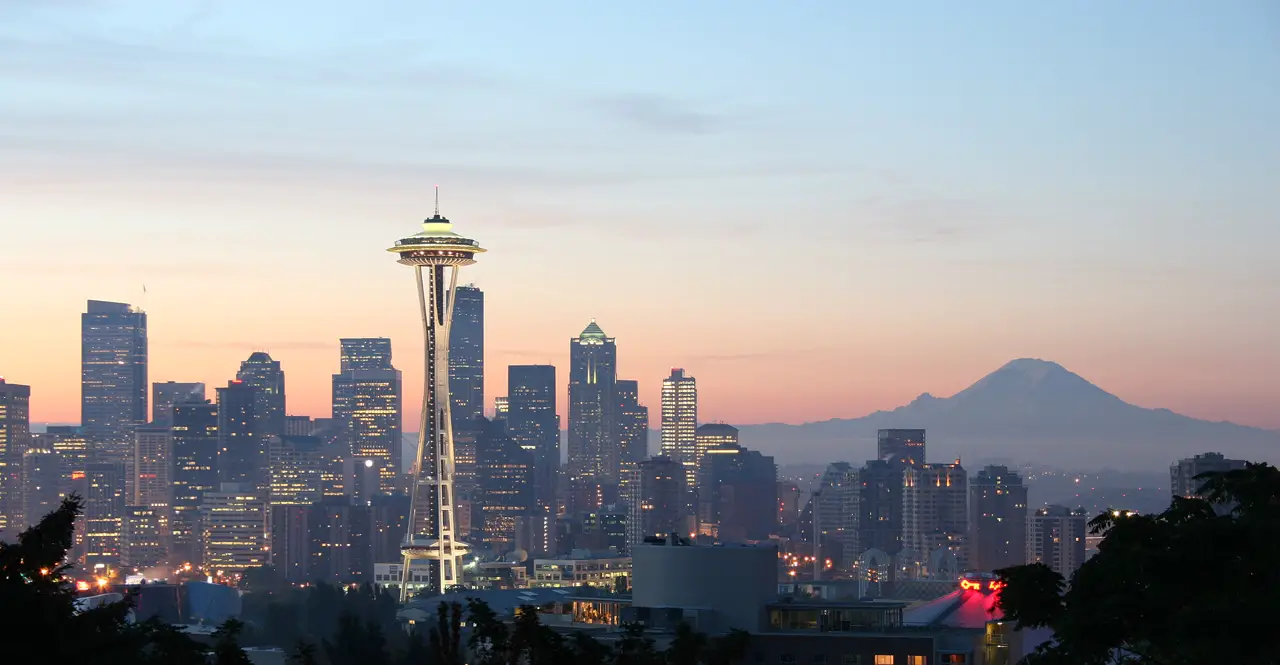
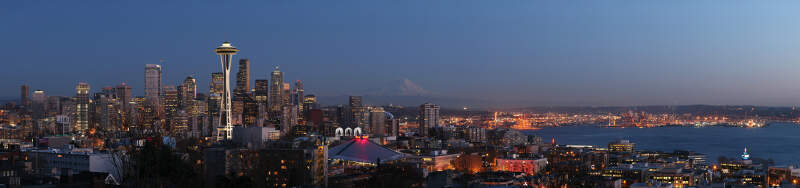


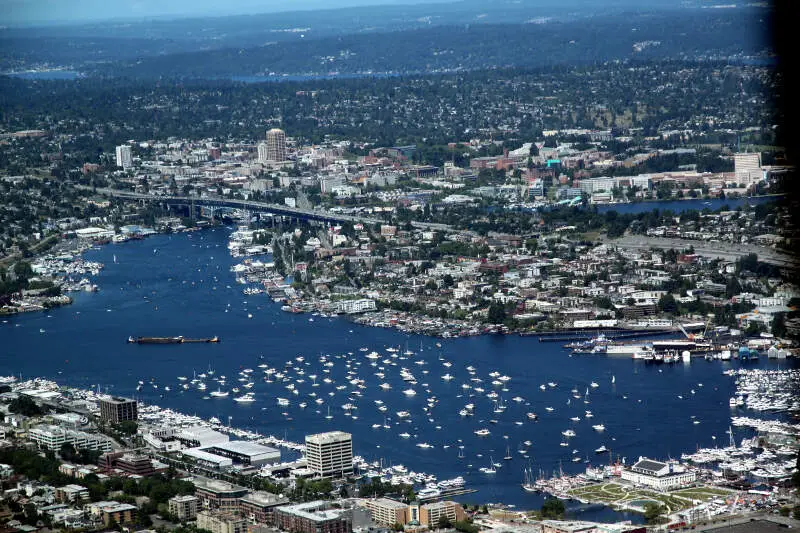
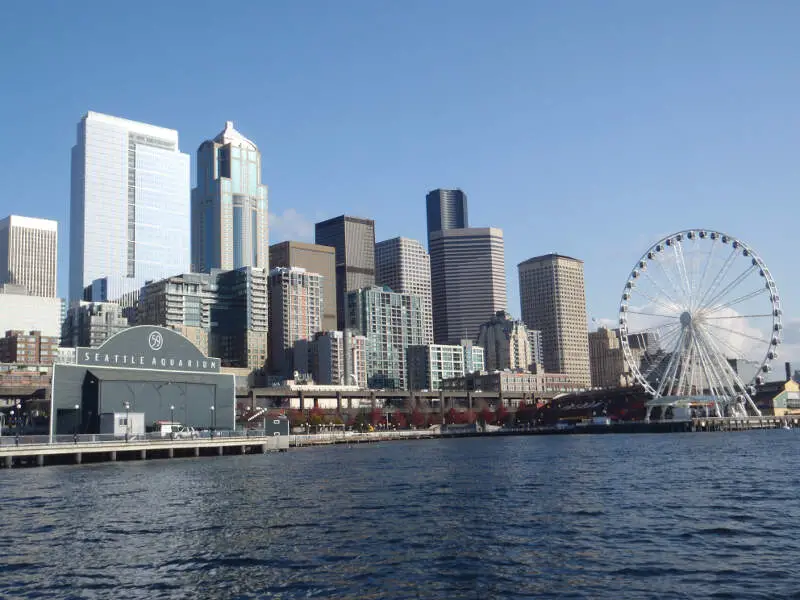
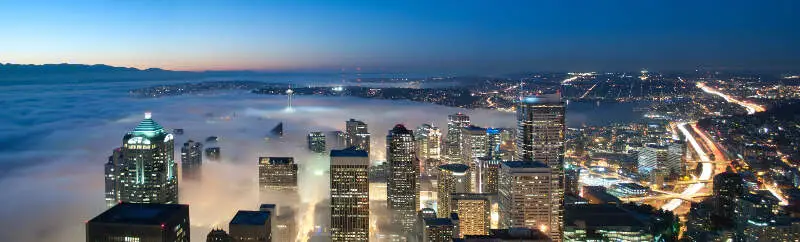
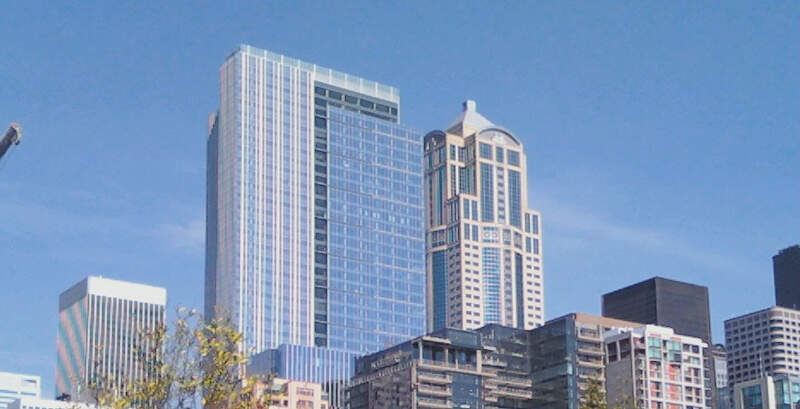
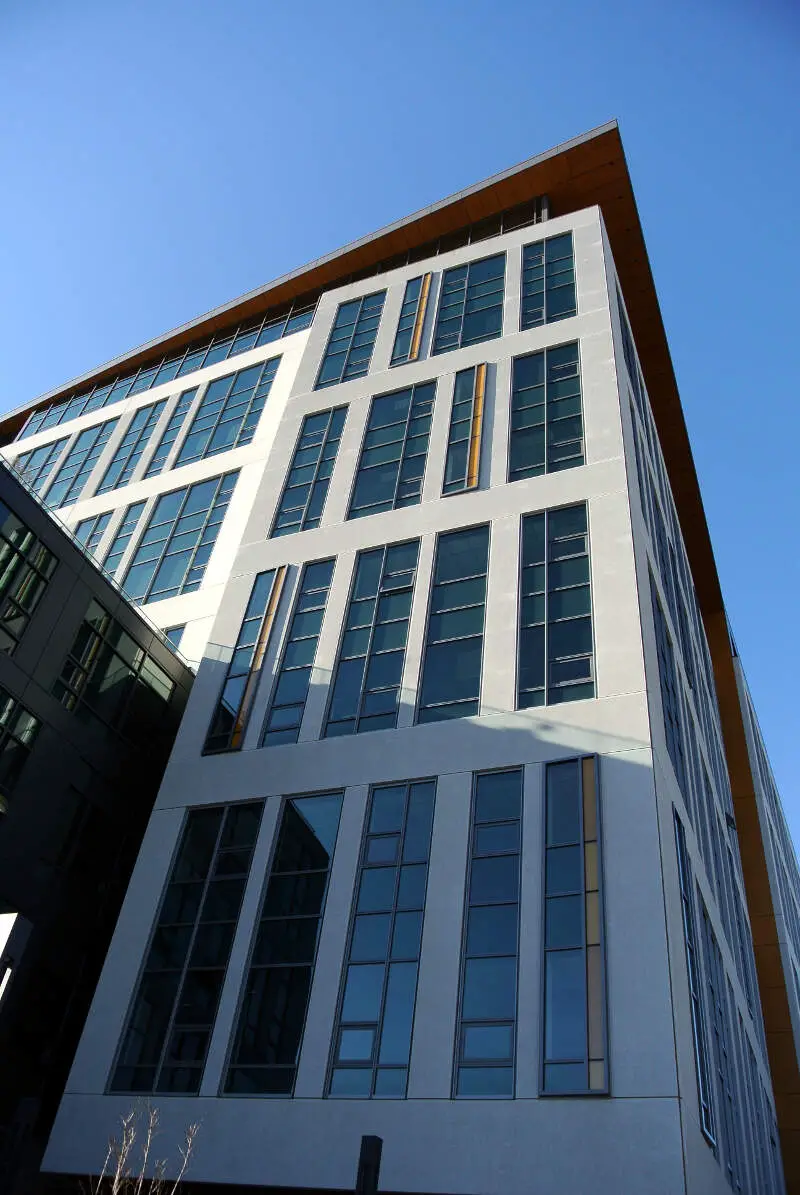
8 Reviews & Comments About Seattle

Seattle is definitely an expensive city and one that you need a good job to live in adequately. The school system was good according to my friends who were parents. The biggest problem is the lack of affordable housing. The city does have a vibrant liberal culture that makes it stand apart from the Trumpian hellscape to the East in flyover country.
My favorite place in Seattle is Club Sapphire. This is a s*x-positive club with membership dues for individuals and couples to "play" in a private setting. Sapphire's membership dues kept out some of the scammers and other disreputable types that sometimes infiltrate the scene. This s*x club really does stand out compared to other major metropolitan s*x clubs such as NYC's. Sapphire managed to imbibe the city's liberal atmosphere and apply it to sexuality making it a distinctive Seattle experience that was far more memorable than the Space Needle.
The schools are great, crime is low! There is lots of hiking and nature to explore, in the summer the coast and lakes are beautiful.
The space needle is my favorite in the city, there is a good music scene in seattle. It's easy to get around by bus, the nearby cities are also very beautiful.
here no crime and child do play well,
living things to be happy in all the day when spend here
The city is rather expensive, but some of the locale and people there are first rate. The biggest drawback is property taxes which squeeze out a lot of people from living there. But the climate is great and the people can be quite liberal in orientations.
The best feature of Seattle by far is Club Sapphire. This establishment bills itself as a "place for grown ups to play and fantasies to become real." Although it might appear at first to be a s********b, Sapphire is a premier s*x club for discriminating individuals and couples to pay and have fun. Swingers and other types enjoy the area and I have had more than a few nice nights out there. I have met so many couples willing to explore their wildest e****c fantasies with me and my SO at Sapphire, it really is an excellent example of what Seattle can be.
During the day the hustle of the city is never ending. Traffic is terrible and most days, assuming your commute is through downtown on I5, it takes you longer to get home than anywhere else in the state. However at night when the city is lit up and the weather is clear there is nothing else like it in the area. The Space Needle is lit up, the Ferris Wheel out on the pier and even watching the sound under a full moon doesn't have much competition to anywhere on that side of I5.
Favorite place is to drive along the I90 bridge after dark because there aren't any street lights. It's a floating bridge so you are just above the water and although it doesn't last long it is definitely a unique experience.
I loved the city of Seattle. The city was full of life, the market place was amazing and the restaurants were wonderful. I would go back there in a heart beat!
I loved the market place. It was artsy, fun and something I never experienced before. Having the fish people throwing fish around in the market place was a lot of fun.
I love Seattle. There is so much to do and see. It's right on Puget Sound so there is water everywhere you look. And Mt. Rainier is close by and when the mountain is "out", as the locals say, the view can't be beat. The waterfront area has so many fun things to do. The wheel is wonderful, and there are great places to shop. One of my favorite shops on the waterfront is Ye Olde Curiosity Shop. There are so many unique, wonderful and interesting things there. And the best place for lunch is Ivar's Fish Bar, where you can get fish and chips, eat on the pier, and feed your left over french fries to the seagulls!
The variety of the geography - you've got the water on one side and the mountains on the other. And there are a lot of activities to check out.
I agree with the person above me. However, I also slightly disagree. Seattle smells like s**t and is full of hobos and junkies now.
Some of my favorite places are the farmers market, the Irish pub, the EMP, the waterfront, the parks, and the Seattle Zoo.
Rankings & Articles For Seattle



Locations Around Seattle
Map Of Seattle, WA
Best Places Around Seattle
Bremerton, WA
Population 44,830
Port Orchard, WA
Population 17,149
Bangor Base, WA
Population 6,112
Bainbridge Island, WA
Population 24,631
Poulsbo, WA
Population 12,165
Vashon, WA
Population 9,934
SeaTac, WA
Population 32,414
Kent, WA
Population 135,603
Silverdale, WA
Population 20,685
Tukwila, WA
Population 21,451
Seattle Demographics And Statistics
Population over time in Seattle
The current population in Seattle is 754,195. The population has increased 26.7% from 2010.
| Year | Population | % Change |
|---|---|---|
| 2024 | 754,195 | 1.7% |
| 2023 | 741,440 | 0.9% |
| 2022 | 734,603 | 1.2% |
| 2021 | 726,054 | -2.1% |
| 2020 | 741,251 | 2.3% |
| 2019 | 724,305 | 2.2% |
| 2018 | 708,823 | 3.0% |
| 2017 | 688,245 | 2.9% |
| 2016 | 668,849 | 2.4% |
| 2015 | 653,017 | 2.4% |
| 2014 | 637,850 | 2.1% |
| 2013 | 624,681 | 1.9% |
| 2012 | 612,916 | 1.6% |
| 2011 | 603,174 | 1.3% |
| 2010 | 595,240 | - |
Race / Ethnicity in Seattle
See the full breakdown
Seattle is:
58.8% White with 443,250 White residents.
6.4% African American with 48,376 African American residents.
0.3% American Indian with 2,385 American Indian residents.
17.5% Asian with 131,815 Asian residents.
0.2% Hawaiian with 1,748 Hawaiian residents.
0.6% Other with 4,741 Other residents.
7.7% Two Or More with 57,986 Two Or More residents.
8.5% Hispanic with 63,894 Hispanic residents.
| Race | Seattle | WA | USA |
|---|---|---|---|
| White | 58.8% | 63.1% | 57.4% |
| African American | 6.4% | 3.8% | 11.9% |
| American Indian | 0.3% | 0.8% | 0.5% |
| Asian | 17.5% | 9.7% | 5.9% |
| Hawaiian | 0.2% | 0.7% | 0.2% |
| Other | 0.6% | 0.6% | 0.6% |
| Two Or More | 7.7% | 6.8% | 4.3% |
| Hispanic | 8.5% | 14.4% | 19.3% |
Gender in Seattle
See the full breakdown
Seattle is 49.1% female with 370,039 female residents.
Seattle is 50.9% male with 384,155 male residents.
| Gender | Seattle | WA | USA |
|---|---|---|---|
| Female | 49.1% | 49.6% | 50.5% |
| Male | 50.9% | 50.4% | 49.5% |
Highest level of educational attainment in Seattle for adults over 25
See the full breakdown
3.0% of adults in Seattle completed < 9th grade.
2.0% of adults in Seattle completed 9-12th grade.
9.0% of adults in Seattle completed high school / ged.
12.0% of adults in Seattle completed some college.
6.0% of adults in Seattle completed associate's degree.
38.0% of adults in Seattle completed bachelor's degree.
21.0% of adults in Seattle completed master's degree.
5.0% of adults in Seattle completed professional degree.
4.0% of adults in Seattle completed doctorate degree.
| Education | Seattle | WA | USA |
|---|---|---|---|
| < 9th Grade | 3.0% | 4.0% | 4.0% |
| 9-12th Grade | 2.0% | 4.0% | 6.0% |
| High School / GED | 9.0% | 22.0% | 26.0% |
| Some College | 12.0% | 21.0% | 19.0% |
| Associate's Degree | 6.0% | 10.0% | 9.0% |
| Bachelor's Degree | 38.0% | 24.0% | 22.0% |
| Master's Degree | 21.0% | 11.0% | 10.0% |
| Professional Degree | 5.0% | 2.0% | 2.0% |
| Doctorate Degree | 4.0% | 2.0% | 2.0% |
Household Income For Seattle, Washington
See the full breakdown
4.5% of households in Seattle earn Less than $10,000.
2.7% of households in Seattle earn $10,000 to $14,999.
3.8% of households in Seattle earn $15,000 to $24,999.
3.9% of households in Seattle earn $25,000 to $34,999.
6.1% of households in Seattle earn $35,000 to $49,999.
11.1% of households in Seattle earn $50,000 to $74,999.
9.7% of households in Seattle earn $75,000 to $99,999.
15.9% of households in Seattle earn $100,000 to $149,999.
11.8% of households in Seattle earn $150,000 to $199,999.
30.4% of households in Seattle earn $200,000 or more.
| Income | Seattle | WA | USA |
|---|---|---|---|
| Less than $10,000 | 4.5% | 3.9% | 5.0% |
| $10,000 to $14,999 | 2.7% | 2.5% | 3.4% |
| $15,000 to $24,999 | 3.8% | 4.6% | 6.3% |
| $25,000 to $34,999 | 3.9% | 5.0% | 6.6% |
| $35,000 to $49,999 | 6.1% | 8.2% | 10.1% |
| $50,000 to $74,999 | 11.1% | 14.1% | 15.5% |
| $75,000 to $99,999 | 9.7% | 12.4% | 12.6% |
| $100,000 to $149,999 | 15.9% | 19.2% | 17.5% |
| $150,000 to $199,999 | 11.8% | 11.4% | 9.6% |
| $200,000 or more | 30.4% | 18.5% | 13.4% |
Source: U.S. Census ACS 5-year estimates (2024)