Woodstock SnackAbility
Overall SnackAbility
Crime in Woodstock summary. We use data from the FBI to determine the crime rates in Woodstock. Key points include:
There were 119 total crimes in Woodstock in the last reporting year.
The overall crime rate per 100,000 people in Woodstock is 1,989.0 / 100k people.
The violent crime rate per 100,000 people in Woodstock is 133.7 / 100k people.
The property crime rate per 100,000 people in Woodstock is 1,855.3 / 100k people.
Overall, crime in Woodstock is -6.15% below the national average.
Total Crimes
Below National Average
Crime In Woodstock Comparison Table
| Statistic | Count Raw |
Woodstock / 100k People |
Virginia / 100k People |
National / 100k People |
|---|---|---|---|---|
| Total Crimes Per 100K | 119 | 1,989.0 | 1,787.6 | 2,119.2 |
| Violent Crime | 8 | 133.7 | 217.9 | 359.0 |
| Murder | 1 | 16.7 | 4.8 | 5.0 |
| Robbery | 0 | 0.0 | 33.1 | 61.0 |
| Aggravated Assault | 5 | 83.6 | 152.2 | 256.0 |
| Property Crime | 111 | 1,855.3 | 1,569.7 | 1,760.0 |
| Burglary | 9 | 150.4 | 108.7 | 229.0 |
| Larceny | 95 | 1,587.8 | 1,315.9 | 1,272.0 |
| Car Theft | 7 | 117.0 | 145.1 | 259.0 |
Source: FBI Uniform Crime Reporting (2024)
Cost of living in Woodstock summary. We use data on the cost of living to determine how expensive it is to live in Woodstock. Real estate prices drive most of the variance in cost of living around Virginia. Key points include:
The cost of living in Woodstock is 108 with 100 being average.
The cost of living in Woodstock is 1.1x higher than the national average.
The median home value in Woodstock is $337,785.
The median income in Woodstock is $76,100.
Woodstock's Overall Cost Of Living
Higher Than The National Average
Cost Of Living In Woodstock Comparison Table
| Living Expense | Woodstock | Virginia | National Average |
|---|---|---|---|
| Overall | 108 | 112 | 100 |
| Services | 103 | 103 | 100 |
| Groceries | 107 | 104 | 100 |
| Health | 111 | 131 | 100 |
| Housing | 103 | 105 | 100 |
| Transportation | 108 | 105 | 100 |
| Utilities | 107 | 104 | 100 |
Source: Cost of living index, normalized to US average = 100
Woodstock, VA Weather
The average high in Woodstock is 65.4° and the average low is 41.3°.
There are 74.5 days of precipitation each year.
Expect an average of 37.1 inches of precipitation each year with 23.7 inches of snow.
| Stat | Woodstock |
|---|---|
| Average Annual High | 65.4 |
| Average Annual Low | 41.3 |
| Annual Precipitation Days | 74.5 |
| Average Annual Precipitation | 37.1 |
| Average Annual Snowfall | 23.7 |
Average High
Days of Rain
Source: NOAA climate normals (30-year)
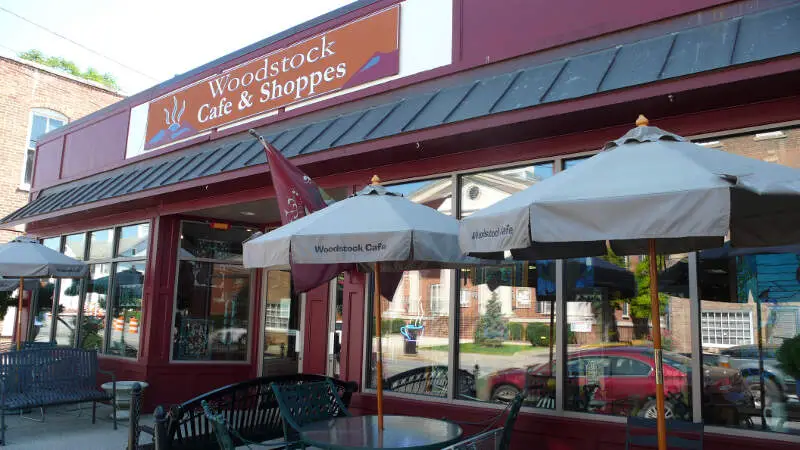
Woodstock, VA Photos
2 Reviews & Comments About Woodstock

There is not much to do in Woodstock Virginia. There is a small 2 movie theater, 4 thrift stores, a Walmart, and a couple mom and pop shops.
We took the kids to the park while we were here and greatly disappointed. There was only a basketball court and tennis court that my 10 year old would play on because the jungle gym was designed for younger kids like 2-7 or 8. We were here about 10 years ago and the park's play area was a lot bigger and had more for the older kids. I'm glad they added more for the little kids but they took away the parts that appealed to the older kids.
I live in Woodstock and ive only seen one trailer park here, and no bait shops...
Im sure there's a place to get bait as ppl do fish around here. There are no bars, dive or toherwise here...
Yes we have a walmart but winchester has 5 and a bass pro shop ;)
Rankings & Articles For Woodstock


Locations Around Woodstock
Map Of Woodstock, VA
Best Places Around Woodstock
Purcellville, VA
Population 8,973
New Baltimore, VA
Population 11,919
Gainesville, VA
Population 18,196
Warrenton, VA
Population 10,176
Winchester, VA
Population 27,913
Harrisonburg, VA
Population 51,392
Strasburg, VA
Population 7,214
Front Royal, VA
Population 15,296
Keyser, WV
Population 4,857
Martinsburg, WV
Population 18,904
Woodstock Demographics And Statistics
Population over time in Woodstock
The current population in Woodstock is 5,871. The population has increased 17.6% from 2010.
| Year | Population | % Change |
|---|---|---|
| 2024 | 5,871 | 0.3% |
| 2023 | 5,851 | 0.9% |
| 2022 | 5,798 | 1.4% |
| 2021 | 5,716 | 8.9% |
| 2020 | 5,247 | 0.7% |
| 2019 | 5,210 | 0.3% |
| 2018 | 5,192 | 0.4% |
| 2017 | 5,169 | -0.7% |
| 2016 | 5,208 | 0.5% |
| 2015 | 5,181 | 0.3% |
| 2014 | 5,164 | 0.6% |
| 2013 | 5,131 | 0.6% |
| 2012 | 5,099 | 1.0% |
| 2011 | 5,050 | 1.1% |
| 2010 | 4,994 | - |
Race / Ethnicity in Woodstock
See the full breakdown
Woodstock is:
67.2% White with 3,943 White residents.
6.4% African American with 378 African American residents.
0.0% American Indian with 0 American Indian residents.
4.2% Asian with 249 Asian residents.
0.0% Hawaiian with 0 Hawaiian residents.
0.0% Other with 0 Other residents.
0.3% Two Or More with 20 Two Or More residents.
21.8% Hispanic with 1,281 Hispanic residents.
| Race | Woodstock | VA | USA |
|---|---|---|---|
| White | 67.2% | 58.4% | 57.4% |
| African American | 6.4% | 18.3% | 11.9% |
| American Indian | 0.0% | 0.1% | 0.5% |
| Asian | 4.2% | 6.9% | 5.9% |
| Hawaiian | 0.0% | 0.1% | 0.2% |
| Other | 0.0% | 0.6% | 0.6% |
| Two Or More | 0.3% | 4.7% | 4.3% |
| Hispanic | 21.8% | 11.0% | 19.3% |
Gender in Woodstock
See the full breakdown
Woodstock is 54.4% female with 3,196 female residents.
Woodstock is 45.6% male with 2,674 male residents.
| Gender | Woodstock | VA | USA |
|---|---|---|---|
| Female | 54.4% | 50.6% | 50.5% |
| Male | 45.6% | 49.4% | 49.5% |
Highest level of educational attainment in Woodstock for adults over 25
See the full breakdown
5.0% of adults in Woodstock completed < 9th grade.
6.0% of adults in Woodstock completed 9-12th grade.
41.0% of adults in Woodstock completed high school / ged.
18.0% of adults in Woodstock completed some college.
8.0% of adults in Woodstock completed associate's degree.
11.0% of adults in Woodstock completed bachelor's degree.
9.0% of adults in Woodstock completed master's degree.
1.0% of adults in Woodstock completed professional degree.
1.0% of adults in Woodstock completed doctorate degree.
| Education | Woodstock | VA | USA |
|---|---|---|---|
| < 9th Grade | 5.0% | 2.0% | 4.0% |
| 9-12th Grade | 6.0% | 5.0% | 6.0% |
| High School / GED | 41.0% | 24.0% | 26.0% |
| Some College | 18.0% | 18.0% | 19.0% |
| Associate's Degree | 8.0% | 8.0% | 9.0% |
| Bachelor's Degree | 11.0% | 24.0% | 22.0% |
| Master's Degree | 9.0% | 14.0% | 10.0% |
| Professional Degree | 1.0% | 3.0% | 2.0% |
| Doctorate Degree | 1.0% | 2.0% | 2.0% |
Household Income For Woodstock, Virginia
See the full breakdown
6.1% of households in Woodstock earn Less than $10,000.
4.8% of households in Woodstock earn $10,000 to $14,999.
11.9% of households in Woodstock earn $15,000 to $24,999.
4.5% of households in Woodstock earn $25,000 to $34,999.
6.5% of households in Woodstock earn $35,000 to $49,999.
15.8% of households in Woodstock earn $50,000 to $74,999.
19.2% of households in Woodstock earn $75,000 to $99,999.
23.2% of households in Woodstock earn $100,000 to $149,999.
2.7% of households in Woodstock earn $150,000 to $199,999.
5.4% of households in Woodstock earn $200,000 or more.
| Income | Woodstock | VA | USA |
|---|---|---|---|
| Less than $10,000 | 6.1% | 4.2% | 5.0% |
| $10,000 to $14,999 | 4.8% | 2.7% | 3.4% |
| $15,000 to $24,999 | 11.9% | 5.2% | 6.3% |
| $25,000 to $34,999 | 4.5% | 5.7% | 6.6% |
| $35,000 to $49,999 | 6.5% | 8.8% | 10.1% |
| $50,000 to $74,999 | 15.8% | 14.3% | 15.5% |
| $75,000 to $99,999 | 19.2% | 12.1% | 12.6% |
| $100,000 to $149,999 | 23.2% | 18.1% | 17.5% |
| $150,000 to $199,999 | 2.7% | 11.1% | 9.6% |
| $200,000 or more | 5.4% | 17.7% | 13.4% |
Source: U.S. Census ACS 5-year estimates (2024)


