Whitest cities in Missouri research summary. We analyzed Missouri’s most recent Census data to determine the whitest cities in Missouri based on the percentage of White residents.
94.4% White · #1 whitest in Missouri
Odessa is a city in Lafayette County, Missouri, United States. The population was 5,300 at the 2010 census.
Data | Crime | Cost of living | Movers
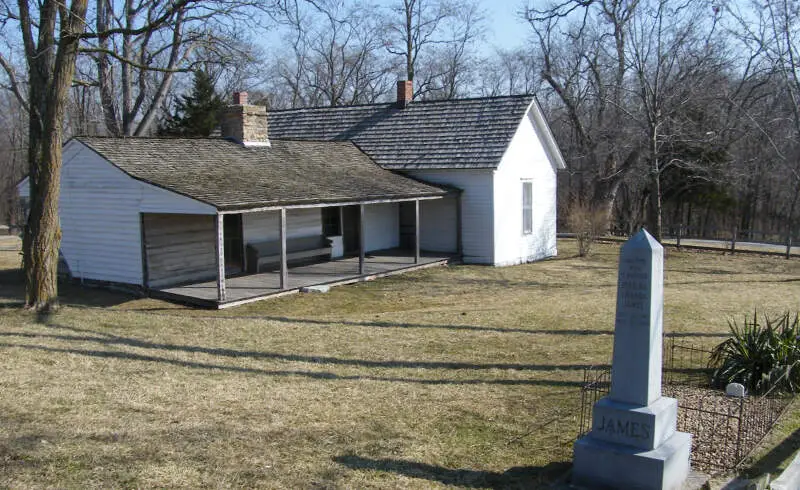
94.1% White · #2 whitest in Missouri
Kearney is a city in Clay County, Missouri, United States. The population per the 2010 U.S. Census was 8,381. It is most famous for being the birthplace of Jesse James, and there is an annual festival in the third weekend of September to recognize the notorious outlaw.
Data | Crime | Cost of living | Movers
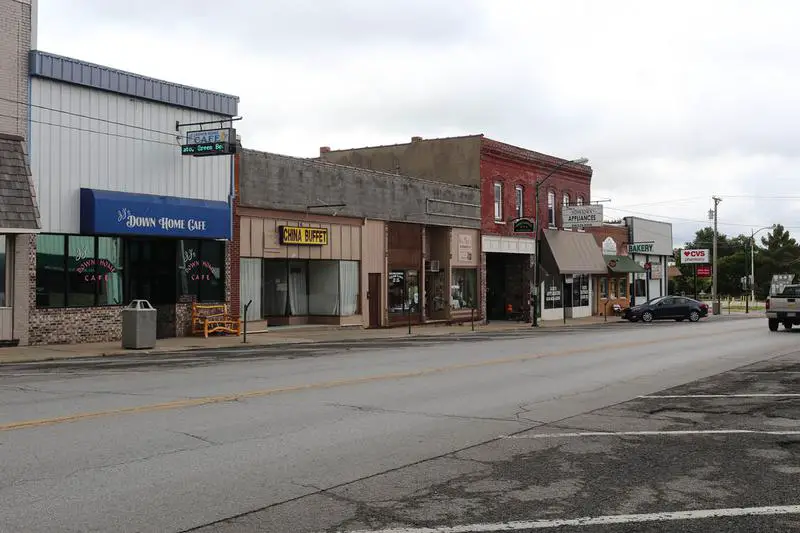
94.1% White · #3 whitest in Missouri
West Plains is a city in Howell County, Missouri, United States. The population was 11,986 at the 2010 Census. It is the county seat of Howell County.
Data | Crime | Cost of living | Movers
93.9% White · #4 whitest in Missouri
Weldon Spring is a city in St. Charles County, Missouri, United States. The population was 5,443 at the 2010 census. It was the location of the largest World War 2 explosives plant and later a uranium refining faculty.
Data | Crime | Cost of living | Movers
93.6% White · #5 whitest in Missouri
Smithville is a city in Clay and Platte counties in the U.S. state of Missouri, along the Little Platte River. The population was 8,425 at the 2010 United States Census.
Data | Crime | Cost of living | Movers
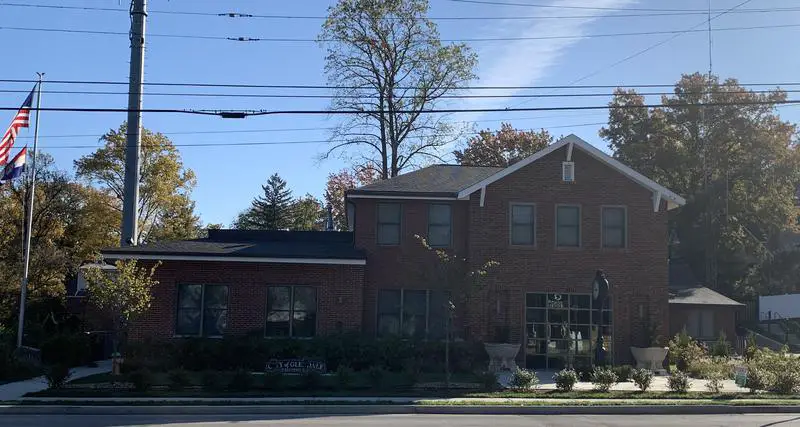
92.5% White · #6 whitest in Missouri
Glendale is a city in St. Louis County, Missouri, United States. The population was 5,925 at the 2010 census.
Data | Crime | Cost of living | Movers
92.4% White · #7 whitest in Missouri
Harrisonville is a city in Cass County, Missouri, United States. The population was 10,019 at the 2010 census. It is the county seat of Cass County.
Data | Crime | Cost of living | Movers
91.9% White · #8 whitest in Missouri
Carl Junction is a city in Jasper County, Missouri, United States. The population was 7,445 at the 2010 census. It is part of the Joplin, Missouri Metropolitan Statistical Area.
Data | Crime | Cost of living | Movers
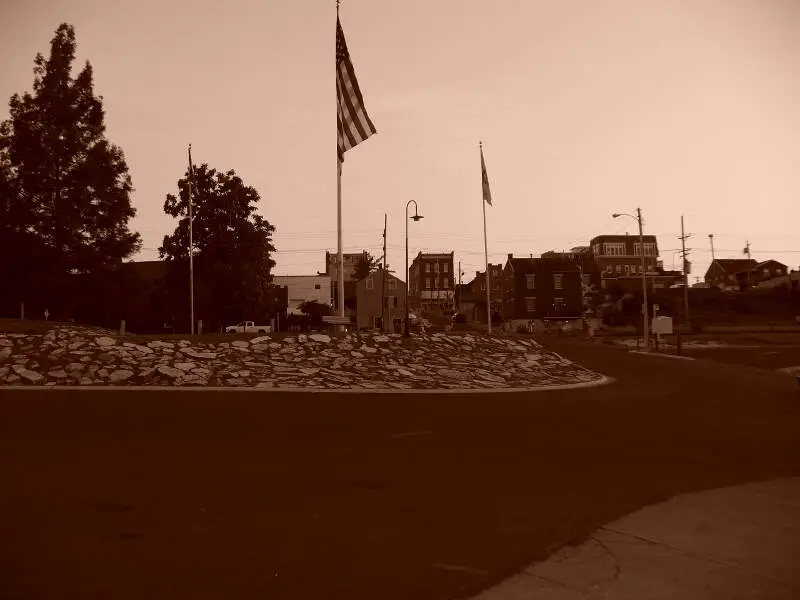
91.7% White · #9 whitest in Missouri
Washington is a city on the Missouri River in Franklin County, Missouri, United States. The population was 13,892 from the 2010 census. It is the corncob pipe capital of the world, with Missouri Meerschaum located on the riverfront.
Data | Crime | Cost of living | Movers
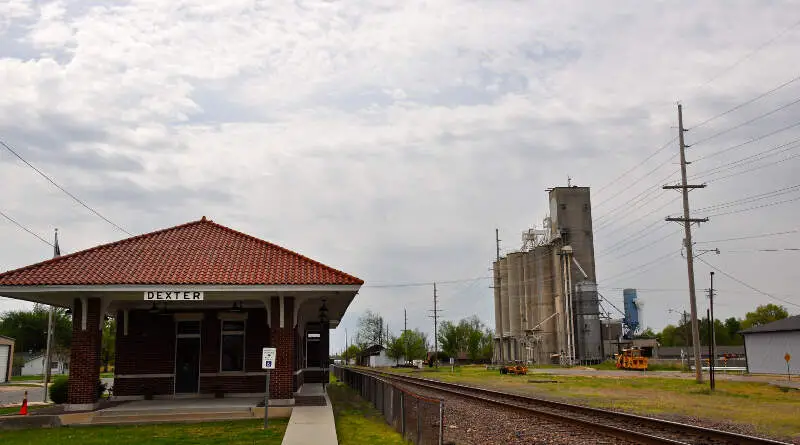
91.7% White · #10 whitest in Missouri
Dexter is a city in Stoddard County, Missouri, United States, founded in 1873. The population was 7,864 at the 2010 census.
Data | Crime | Cost of living | Movers
The receipts
Compare the top ten
Pick a metric. The bars rescale. The red line is Missouri’s statewide median.
On the map
Where Missouri’s White population is concentrated
Saturday Night Science
Methodology: How we determined the whitest places in Missouri for 2026
To rank the whitest places in Missouri, we used Saturday Night Science to look at Census demographic data.
We had to look at the number of white people living in each city in Missouri on a per capita basis. In other words, the percentage of white people living in each city in Missouri.
We looked at table B03002: Hispanic OR LATINO ORIGIN BY RACE. Here are the category names as defined by the Census:
- Hispanic or Latino
- White alone*
- Black or African American alone*
- American Indian and Alaska Native alone*
- Asian alone*
- Native Hawaiian and Other Pacific Islander alone*
- Some other race alone*
- Two or more races*
Our particular column of interest here was the number of people who identified as White alone.
We limited our analysis to places with a population greater than 5,000 people. That left us with 121 cities.
We then calculated the percentage of residents that are White. The percentages ranked from 94.4% to 4.9%.
Finally, we ranked each city based on the percentage of the White population, with a higher percentage being more White. Odessa took the distinction of being the most White, while Jennings was the least White city.
We updated this article for 2026. This report represents our eleventh time ranking the whitest cities in Missouri.
The full plate
Cities In Missouri By White Population
Click any column to sort. Search by city name.
| Rank | City | Population | White Population | % White |
|---|---|---|---|---|
| 1 | Odessa | 5,620 | 5,308 | 94.4% |
| 2 | Kearney | 10,885 | 10,242 | 94.1% |
| 3 | West Plains | 12,441 | 11,704 | 94.1% |
| 4 | Weldon Spring | 5,310 | 4,984 | 93.9% |
| 5 | Smithville | 10,705 | 10,025 | 93.6% |
| 6 | Glendale | 6,114 | 5,658 | 92.5% |
| 7 | Harrisonville | 9,970 | 9,215 | 92.4% |
| 8 | Carl Junction | 8,339 | 7,660 | 91.9% |
| 9 | Washington | 15,130 | 13,877 | 91.7% |
| 10 | Dexter | 7,891 | 7,235 | 91.7% |
| 11 | Sunset Hills | 9,112 | 8,330 | 91.4% |
| 12 | Bolivar | 11,170 | 10,211 | 91.4% |
| 13 | Crestwood | 12,295 | 11,215 | 91.2% |
| 14 | Lebanon | 15,270 | 13,902 | 91.0% |
| 15 | Pevely | 6,055 | 5,512 | 91.0% |
| 16 | Richmond | 5,959 | 5,418 | 90.9% |
| 17 | Des Peres | 9,170 | 8,333 | 90.9% |
| 18 | Clinton | 9,065 | 8,193 | 90.4% |
| 19 | Aurora | 7,397 | 6,642 | 89.8% |
| 20 | Battlefield | 6,165 | 5,493 | 89.1% |
| 21 | Warrenton | 9,066 | 8,059 | 88.9% |
| 22 | Nixa | 24,836 | 22,062 | 88.8% |
| 23 | Oak Grove | 8,538 | 7,579 | 88.8% |
| 24 | Trenton | 5,536 | 4,911 | 88.7% |
| 25 | Park Hills | 8,678 | 7,688 | 88.6% |
| 26 | Perryville | 8,536 | 7,559 | 88.6% |
| 27 | Farmington | 18,282 | 16,168 | 88.4% |
| 28 | Troy | 13,947 | 12,331 | 88.4% |
| 29 | Maryville | 10,428 | 9,212 | 88.3% |
| 30 | Nevada | 7,925 | 6,984 | 88.1% |
| 31 | Arnold | 20,956 | 18,451 | 88.0% |
| 32 | Republic | 19,829 | 17,419 | 87.8% |
| 33 | Sullivan | 6,310 | 5,532 | 87.7% |
| 34 | Jackson | 15,659 | 13,728 | 87.7% |
| 35 | Hannibal | 16,771 | 14,643 | 87.3% |
| 36 | Chillicothe | 8,923 | 7,778 | 87.2% |
| 37 | Pleasant Hill | 8,847 | 7,702 | 87.1% |
| 38 | Union | 12,781 | 11,056 | 86.5% |
| 39 | Festus | 13,201 | 11,363 | 86.1% |
| 40 | Cameron | 8,519 | 7,318 | 85.9% |
| 41 | Ladue | 8,940 | 7,655 | 85.6% |
| 42 | Eureka | 13,081 | 11,195 | 85.6% |
| 43 | Macon | 5,466 | 4,672 | 85.5% |
| 44 | Ozark | 22,417 | 19,143 | 85.4% |
| 45 | Dardenne Prairie | 13,503 | 11,488 | 85.1% |
| 46 | St. Peters | 59,092 | 50,236 | 85.0% |
| 47 | De Soto | 6,470 | 5,490 | 84.9% |
| 48 | Lake St. Louis | 18,066 | 15,303 | 84.7% |
| 49 | Wentzville | 47,061 | 39,637 | 84.2% |
| 50 | Marshfield | 7,696 | 6,464 | 84.0% |
| 51 | Fulton | 12,617 | 10,591 | 83.9% |
| 52 | Webb City | 13,221 | 11,070 | 83.7% |
| 53 | Liberty | 30,689 | 25,685 | 83.7% |
| 54 | Mexico | 11,477 | 9,594 | 83.6% |
| 55 | Boonville | 7,689 | 6,376 | 82.9% |
| 56 | Kirksville | 17,563 | 14,562 | 82.9% |
| 57 | Wildwood | 35,133 | 29,058 | 82.7% |
| 58 | Moberly | 13,526 | 11,175 | 82.6% |
| 59 | Valley Park | 6,795 | 5,569 | 82.0% |
| 60 | Springfield | 169,954 | 138,669 | 81.6% |
| 61 | Richmond Heights | 9,153 | 7,460 | 81.5% |
| 62 | Kirkwood | 29,363 | 23,926 | 81.5% |
| 63 | Excelsior Springs | 10,484 | 8,516 | 81.2% |
| 64 | Joplin | 52,593 | 42,720 | 81.2% |
| 65 | Ellisville | 10,002 | 8,121 | 81.2% |
| 66 | Webster Groves | 23,712 | 19,242 | 81.1% |
| 67 | Town and Country | 11,607 | 9,346 | 80.5% |
| 68 | Grain Valley | 16,271 | 13,088 | 80.4% |
| 69 | Branson | 12,817 | 10,272 | 80.1% |
| 70 | Pacific | 7,475 | 5,957 | 79.7% |
| 71 | O’Fallon | 93,801 | 74,564 | 79.5% |
| 72 | Warrensburg | 19,582 | 15,470 | 79.0% |
| 73 | Rolla | 20,287 | 16,003 | 78.9% |
| 74 | Poplar Bluff | 16,254 | 12,759 | 78.5% |
| 75 | Blue Springs | 59,965 | 46,879 | 78.2% |
| 76 | Shrewsbury | 6,316 | 4,937 | 78.2% |
| 77 | Parkville | 8,366 | 6,533 | 78.1% |
| 78 | Brentwood | 8,144 | 6,344 | 77.9% |
| 79 | St. Charles | 71,508 | 55,566 | 77.7% |
| 80 | St. Joseph | 71,236 | 55,082 | 77.3% |
| 81 | Lee’s Summit | 103,656 | 79,967 | 77.1% |
| 82 | Raymore | 24,526 | 18,821 | 76.7% |
| 83 | Kennett | 10,196 | 7,818 | 76.7% |
| 84 | Belton | 25,008 | 19,142 | 76.5% |
| 85 | Bonne Terre | 6,683 | 5,113 | 76.5% |
| 86 | Cape Girardeau | 40,344 | 30,356 | 75.2% |
| 87 | Ballwin | 31,279 | 23,448 | 75.0% |
| 88 | Gladstone | 27,207 | 20,154 | 74.1% |
| 89 | Sedalia | 22,003 | 16,249 | 73.8% |
| 90 | Chesterfield | 49,574 | 36,471 | 73.6% |
| 91 | Columbia | 128,548 | 92,127 | 71.7% |
| 92 | Jefferson City | 42,488 | 30,343 | 71.4% |
| 93 | Maplewood | 8,156 | 5,824 | 71.4% |
| 94 | Manchester | 18,160 | 12,934 | 71.2% |
| 95 | Neosho | 13,224 | 9,215 | 69.7% |
| 96 | Creve Coeur | 18,643 | 12,819 | 68.8% |
| 97 | Independence | 121,740 | 83,395 | 68.5% |
| 98 | Sikeston | 16,320 | 11,126 | 68.2% |
| 99 | Marshall | 13,739 | 9,187 | 66.9% |
| 100 | Clayton | 17,380 | 11,572 | 66.6% |
Source: U.S. Census ACS 2020-2024. 121 cities with more than 5,000 residents.
Summary
Summary: White Populations Across Missouri
We measured the locations with the highest percentage of white people in Missouri. According to the most recent data, this list provides accurate information on the whitest places in Missouri.
The most White cities in Missouri are Odessa, Kearney, West Plains, Weldon Spring, Smithville, Glendale, Harrisonville, Carl Junction, Washington, and Dexter. Not sold on Missouri? Take the two-minute Find Your Place quiz and see which state actually fits you.


