Parkersburg SnackAbility
Overall SnackAbility
Crime in Parkersburg summary. We use data from the FBI to determine the crime rates in Parkersburg. Key points include:
There were 1,002 total crimes in Parkersburg in the last reporting year.
The overall crime rate per 100,000 people in Parkersburg is 3,477.4 / 100k people.
The violent crime rate per 100,000 people in Parkersburg is 260.3 / 100k people.
The property crime rate per 100,000 people in Parkersburg is 3,217.1 / 100k people.
Overall, crime in Parkersburg is 64.09% above the national average.
Total Crimes
Above National Average
Crime In Parkersburg Comparison Table
| Statistic | Count Raw |
Parkersburg / 100k People |
West Virginia / 100k People |
National / 100k People |
|---|---|---|---|---|
| Total Crimes Per 100K | 1,002 | 3,477.4 | 1,410.8 | 2,119.2 |
| Violent Crime | 75 | 260.3 | 248.8 | 359.0 |
| Murder | 0 | 0.0 | 5.3 | 5.0 |
| Robbery | 6 | 20.8 | 9.7 | 61.0 |
| Aggravated Assault | 50 | 173.5 | 185.8 | 256.0 |
| Property Crime | 927 | 3,217.1 | 1,161.9 | 1,760.0 |
| Burglary | 91 | 315.8 | 178.3 | 229.0 |
| Larceny | 784 | 2,720.8 | 905.1 | 1,272.0 |
| Car Theft | 52 | 180.5 | 78.5 | 259.0 |
Source: FBI Uniform Crime Reporting (2024)
Cost of living in Parkersburg summary. We use data on the cost of living to determine how expensive it is to live in Parkersburg. Real estate prices drive most of the variance in cost of living around West Virginia. Key points include:
The cost of living in Parkersburg is 80 with 100 being average.
The cost of living in Parkersburg is 0.8x lower than the national average.
The median home value in Parkersburg is $147,802.
The median income in Parkersburg is $49,025.
Parkersburg's Overall Cost Of Living
Lower Than The National Average
Cost Of Living In Parkersburg Comparison Table
| Living Expense | Parkersburg | West Virginia | National Average |
|---|---|---|---|
| Overall | 80 | 86 | 100 |
| Services | 95 | 95 | 100 |
| Groceries | 97 | 95 | 100 |
| Health | 55 | 61 | 100 |
| Housing | 90 | 95 | 100 |
| Transportation | 95 | 93 | 100 |
| Utilities | 88 | 93 | 100 |
Source: Cost of living index, normalized to US average = 100
Parkersburg, WV Weather
The average high in Parkersburg is 65.0° and the average low is 42.4°.
There are 85.1 days of precipitation each year.
Expect an average of 42.3 inches of precipitation each year with 14.9 inches of snow.
| Stat | Parkersburg |
|---|---|
| Average Annual High | 65.0 |
| Average Annual Low | 42.4 |
| Annual Precipitation Days | 85.1 |
| Average Annual Precipitation | 42.3 |
| Average Annual Snowfall | 14.9 |
Average High
Days of Rain
Source: NOAA climate normals (30-year)
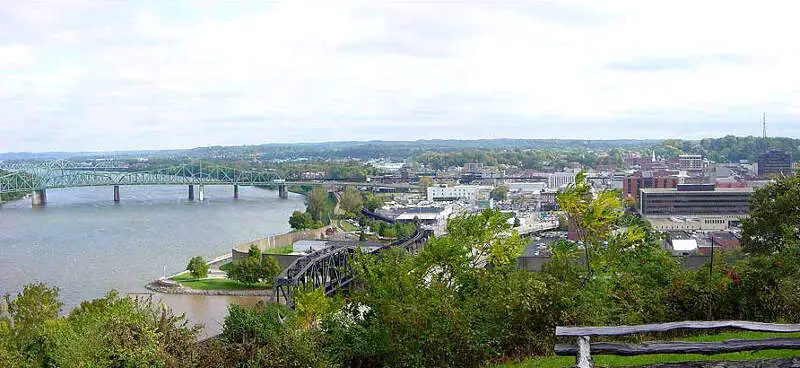
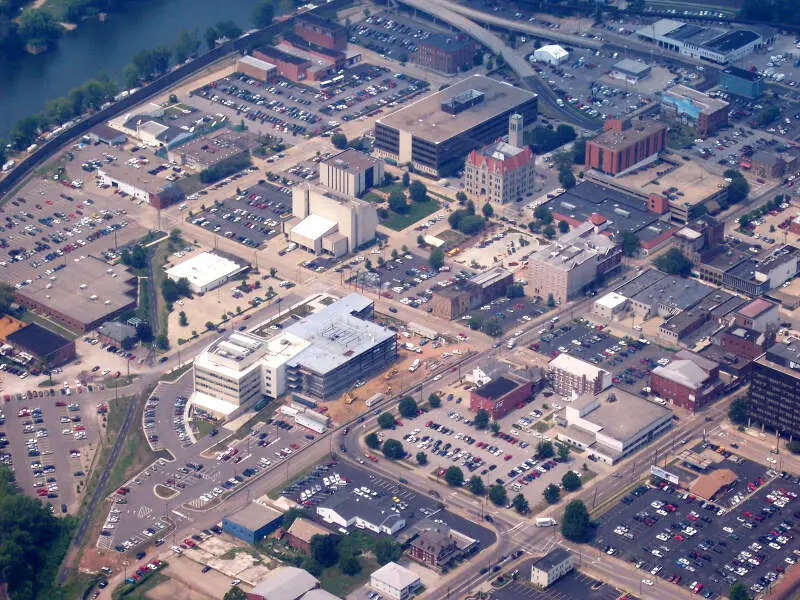
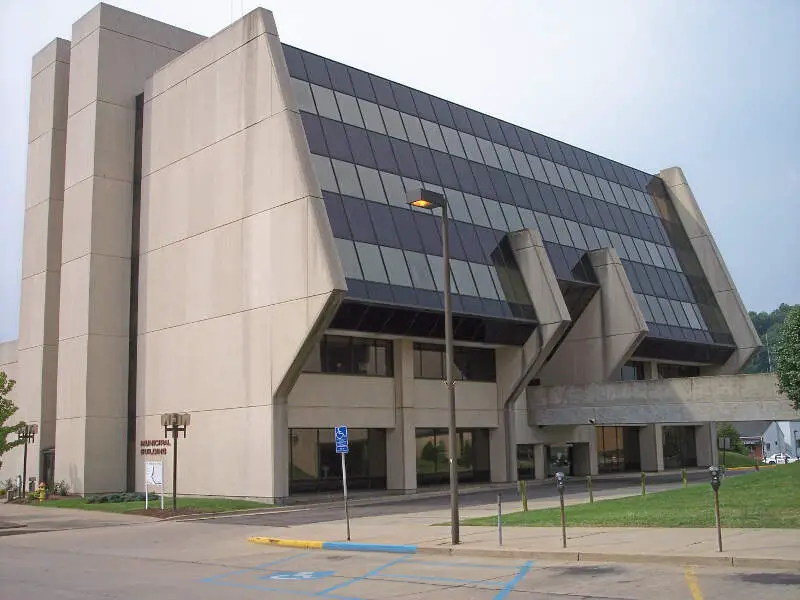
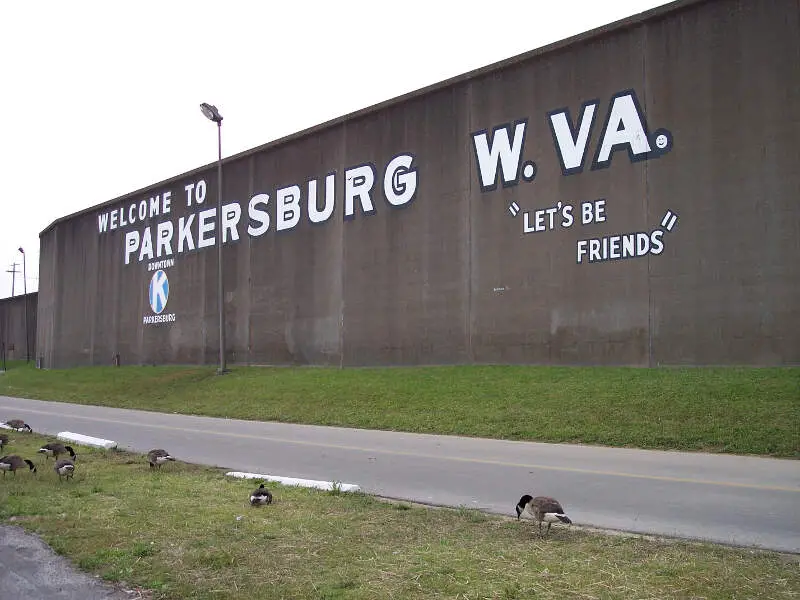
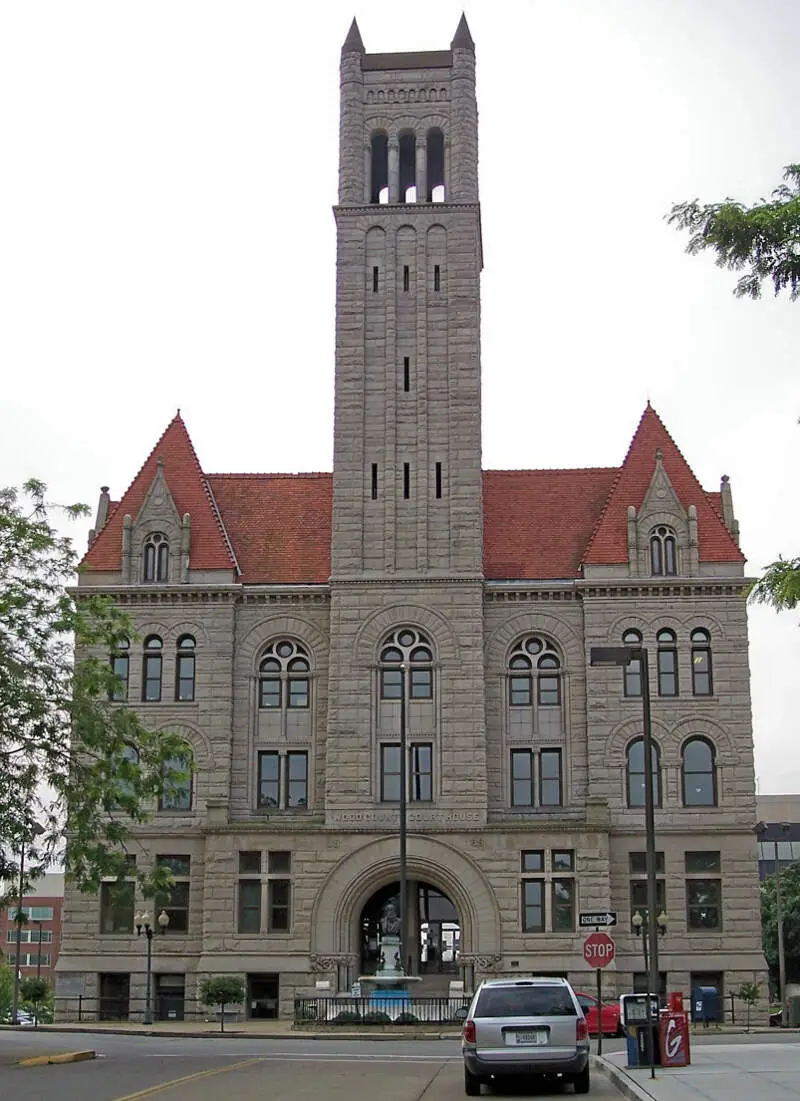
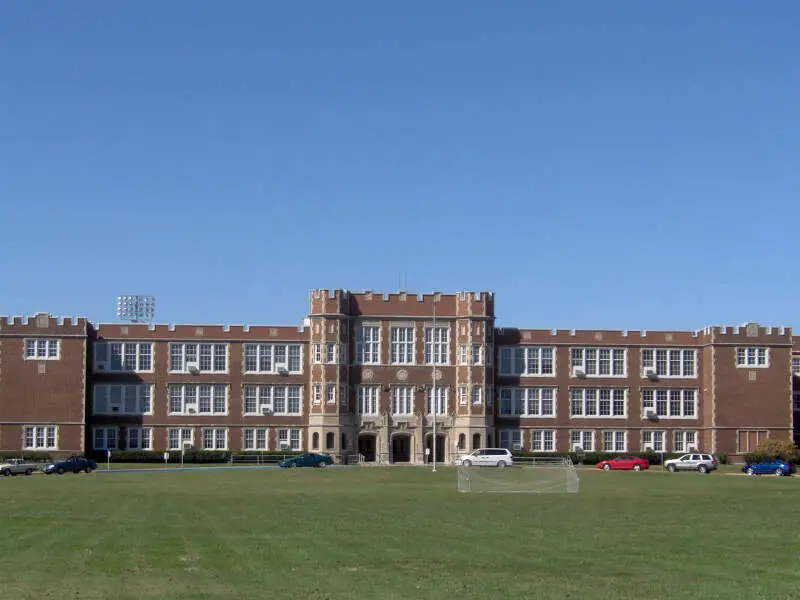
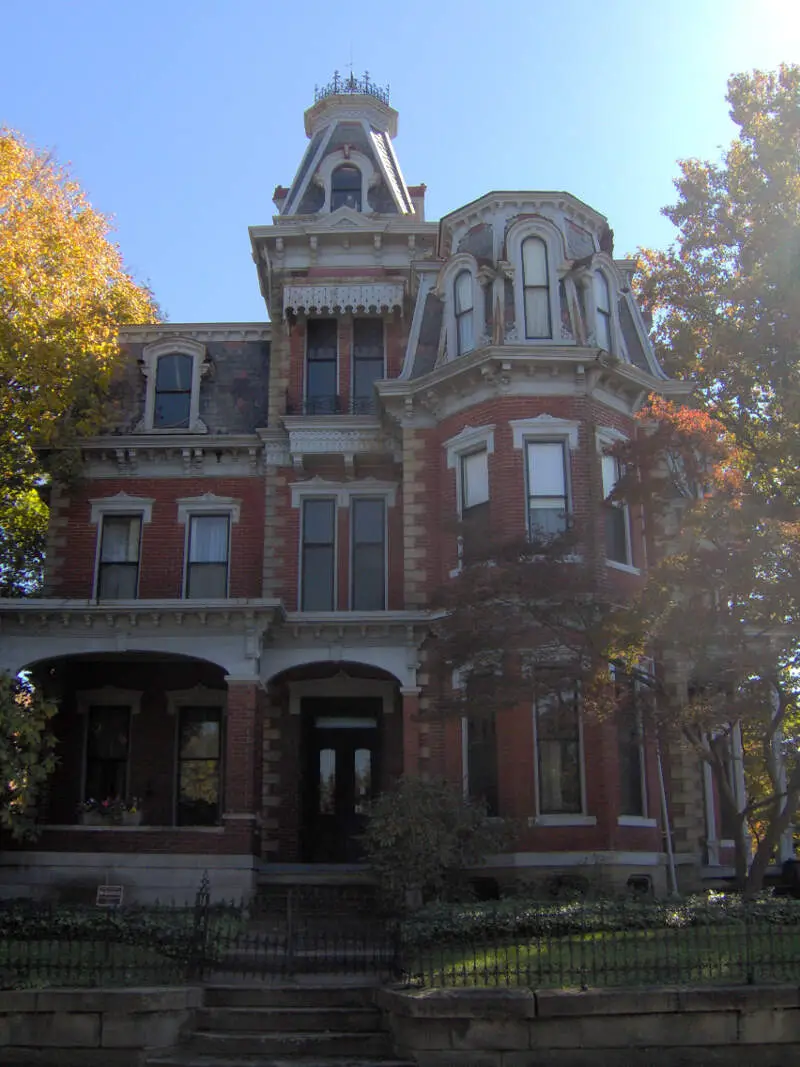
Parkersburg, WV Photos
1 Reviews & Comments About Parkersburg

I live in Parkersburg. This is interesting because the h****n is over coming our city. It's getting worse every year. I moved here from Youngstown Ohio so I could have a family and raise them in a safer place. But this is how it all starts. It's a sad reality but unless we take our city back it's going to end up just like my home town. Trust me you don't want that.
Rankings & Articles For Parkersburg


Locations Around Parkersburg
Map Of Parkersburg, WV
Best Places Around Parkersburg
Athens, OH
Population 23,396
Belpre, OH
Population 6,654
Marietta, OH
Population 13,203
Logan, OH
Population 6,993
Murray, UT
Population 50,188
Newport, OR
Population 10,583
Vienna, WV
Population 10,518
New Martinsville, WV
Population 5,133
Parkersburg Demographics And Statistics
Population over time in Parkersburg
The current population in Parkersburg is 29,240. The population has decreased 7.9% from 2010.
| Year | Population | % Change |
|---|---|---|
| 2024 | 29,240 | -0.8% |
| 2023 | 29,461 | -0.8% |
| 2022 | 29,685 | -0.8% |
| 2021 | 29,910 | 0.6% |
| 2020 | 29,732 | -1.0% |
| 2019 | 30,021 | -1.0% |
| 2018 | 30,328 | -0.9% |
| 2017 | 30,596 | -1.2% |
| 2016 | 30,962 | -0.5% |
| 2015 | 31,133 | -0.2% |
| 2014 | 31,195 | -0.5% |
| 2013 | 31,357 | -0.4% |
| 2012 | 31,482 | -0.5% |
| 2011 | 31,646 | -0.3% |
| 2010 | 31,742 | - |
Race / Ethnicity in Parkersburg
See the full breakdown
Parkersburg is:
91.4% White with 26,731 White residents.
1.6% African American with 460 African American residents.
0.1% American Indian with 38 American Indian residents.
0.6% Asian with 166 Asian residents.
0.3% Hawaiian with 89 Hawaiian residents.
0.2% Other with 50 Other residents.
4.0% Two Or More with 1,176 Two Or More residents.
1.8% Hispanic with 530 Hispanic residents.
| Race | Parkersburg | WV | USA |
|---|---|---|---|
| White | 91.4% | 89.7% | 57.4% |
| African American | 1.6% | 3.1% | 11.9% |
| American Indian | 0.1% | 0.1% | 0.5% |
| Asian | 0.6% | 0.8% | 5.9% |
| Hawaiian | 0.3% | 0.0% | 0.2% |
| Other | 0.2% | 0.3% | 0.6% |
| Two Or More | 4.0% | 3.9% | 4.3% |
| Hispanic | 1.8% | 2.1% | 19.3% |
Gender in Parkersburg
See the full breakdown
Parkersburg is 50.5% female with 14,754 female residents.
Parkersburg is 49.5% male with 14,486 male residents.
| Gender | Parkersburg | WV | USA |
|---|---|---|---|
| Female | 50.5% | 50.1% | 50.5% |
| Male | 49.5% | 49.9% | 49.5% |
Highest level of educational attainment in Parkersburg for adults over 25
See the full breakdown
4.0% of adults in Parkersburg completed < 9th grade.
10.0% of adults in Parkersburg completed 9-12th grade.
37.0% of adults in Parkersburg completed high school / ged.
19.0% of adults in Parkersburg completed some college.
9.0% of adults in Parkersburg completed associate's degree.
14.0% of adults in Parkersburg completed bachelor's degree.
5.0% of adults in Parkersburg completed master's degree.
1.0% of adults in Parkersburg completed professional degree.
1.0% of adults in Parkersburg completed doctorate degree.
| Education | Parkersburg | WV | USA |
|---|---|---|---|
| < 9th Grade | 4.0% | 5.0% | 4.0% |
| 9-12th Grade | 10.0% | 7.0% | 6.0% |
| High School / GED | 37.0% | 39.0% | 26.0% |
| Some College | 19.0% | 17.0% | 19.0% |
| Associate's Degree | 9.0% | 8.0% | 9.0% |
| Bachelor's Degree | 14.0% | 14.0% | 22.0% |
| Master's Degree | 5.0% | 7.0% | 10.0% |
| Professional Degree | 1.0% | 2.0% | 2.0% |
| Doctorate Degree | 1.0% | 1.0% | 2.0% |
Household Income For Parkersburg, West Virginia
See the full breakdown
5.7% of households in Parkersburg earn Less than $10,000.
5.9% of households in Parkersburg earn $10,000 to $14,999.
14.2% of households in Parkersburg earn $15,000 to $24,999.
10.9% of households in Parkersburg earn $25,000 to $34,999.
14.5% of households in Parkersburg earn $35,000 to $49,999.
19.3% of households in Parkersburg earn $50,000 to $74,999.
12.1% of households in Parkersburg earn $75,000 to $99,999.
10.1% of households in Parkersburg earn $100,000 to $149,999.
4.6% of households in Parkersburg earn $150,000 to $199,999.
2.7% of households in Parkersburg earn $200,000 or more.
| Income | Parkersburg | WV | USA |
|---|---|---|---|
| Less than $10,000 | 5.7% | 6.2% | 5.0% |
| $10,000 to $14,999 | 5.9% | 5.5% | 3.4% |
| $15,000 to $24,999 | 14.2% | 9.4% | 6.3% |
| $25,000 to $34,999 | 10.9% | 9.2% | 6.6% |
| $35,000 to $49,999 | 14.5% | 12.4% | 10.1% |
| $50,000 to $74,999 | 19.3% | 17.3% | 15.5% |
| $75,000 to $99,999 | 12.1% | 12.7% | 12.6% |
| $100,000 to $149,999 | 10.1% | 15.1% | 17.5% |
| $150,000 to $199,999 | 4.6% | 6.3% | 9.6% |
| $200,000 or more | 2.7% | 5.9% | 13.4% |
Source: U.S. Census ACS 5-year estimates (2024)


