Gadsden SnackAbility
Overall SnackAbility
Crime in Gadsden summary. We use data from the FBI to determine the crime rates in Gadsden. Key points include:
There were 1,043 total crimes in Gadsden in the last reporting year.
The overall crime rate per 100,000 people in Gadsden is 3,159.2 / 100k people.
The violent crime rate per 100,000 people in Gadsden is 581.6 / 100k people.
The property crime rate per 100,000 people in Gadsden is 2,577.6 / 100k people.
Overall, crime in Gadsden is 49.07% above the national average.
Total Crimes
Above National Average
Crime In Gadsden Comparison Table
| Statistic | Count Raw |
Gadsden / 100k People |
Alabama / 100k People |
National / 100k People |
|---|---|---|---|---|
| Total Crimes Per 100K | 1,043 | 3,159.2 | 1,924.9 | 2,119.2 |
| Violent Crime | 192 | 581.6 | 359.9 | 359.0 |
| Murder | 4 | 12.1 | 8.7 | 5.0 |
| Robbery | 16 | 48.5 | 34.0 | 61.0 |
| Aggravated Assault | 168 | 508.9 | 291.4 | 256.0 |
| Property Crime | 851 | 2,577.6 | 1,565.1 | 1,760.0 |
| Burglary | 97 | 293.8 | 243.5 | 229.0 |
| Larceny | 682 | 2,065.7 | 1,148.5 | 1,272.0 |
| Car Theft | 72 | 218.1 | 173.0 | 259.0 |
Source: FBI Uniform Crime Reporting (2024)
Cost of living in Gadsden summary. We use data on the cost of living to determine how expensive it is to live in Gadsden. Real estate prices drive most of the variance in cost of living around Alabama. Key points include:
The cost of living in Gadsden is 83 with 100 being average.
The cost of living in Gadsden is 0.8x lower than the national average.
The median home value in Gadsden is $114,157.
The median income in Gadsden is $40,345.
Gadsden's Overall Cost Of Living
Lower Than The National Average
Cost Of Living In Gadsden Comparison Table
| Living Expense | Gadsden | Alabama | National Average |
|---|---|---|---|
| Overall | 83 | 91 | 100 |
| Services | 93 | 95 | 100 |
| Groceries | 94 | 96 | 100 |
| Health | 51 | 74 | 100 |
| Housing | 93 | 96 | 100 |
| Transportation | 98 | 95 | 100 |
| Utilities | 96 | 95 | 100 |
Source: Cost of living index, normalized to US average = 100
Gadsden, AL Weather
The average high in Gadsden is 71.9° and the average low is 49.5°.
There are 79.0 days of precipitation each year.
Expect an average of 54.8 inches of precipitation each year with 0.6 inches of snow.
| Stat | Gadsden |
|---|---|
| Average Annual High | 71.9 |
| Average Annual Low | 49.5 |
| Annual Precipitation Days | 79.0 |
| Average Annual Precipitation | 54.8 |
| Average Annual Snowfall | 0.6 |
Average High
Days of Rain
Source: NOAA climate normals (30-year)
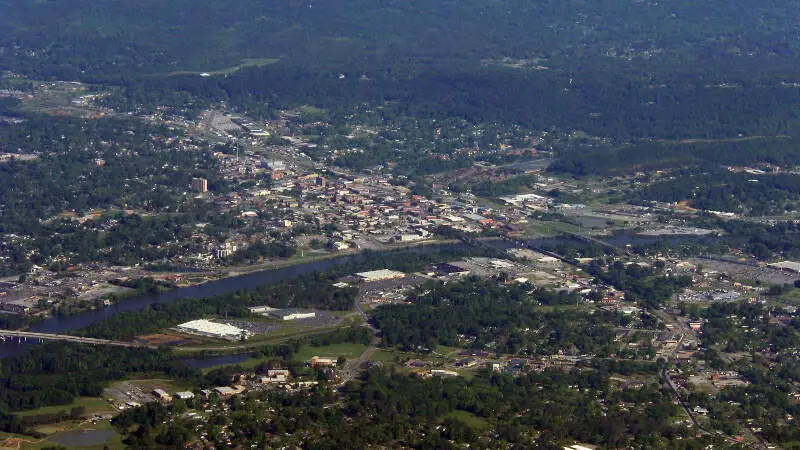
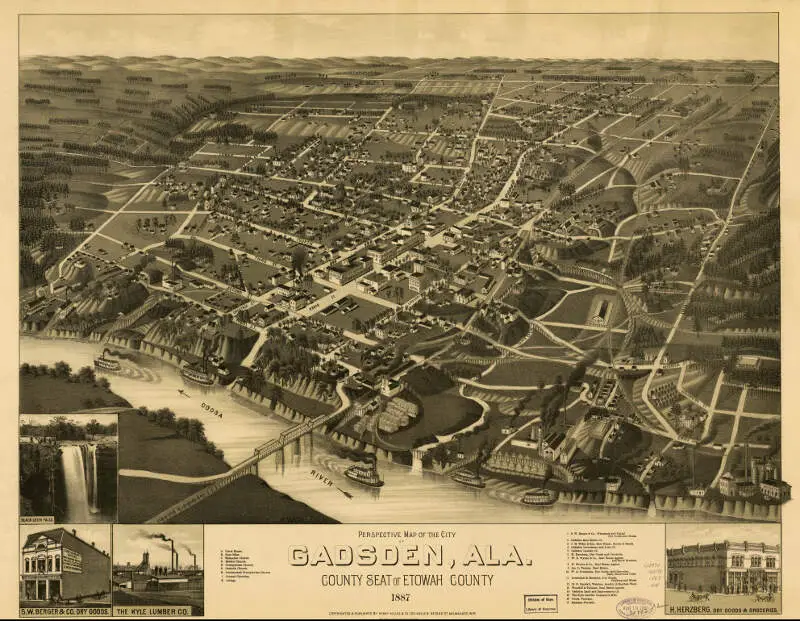
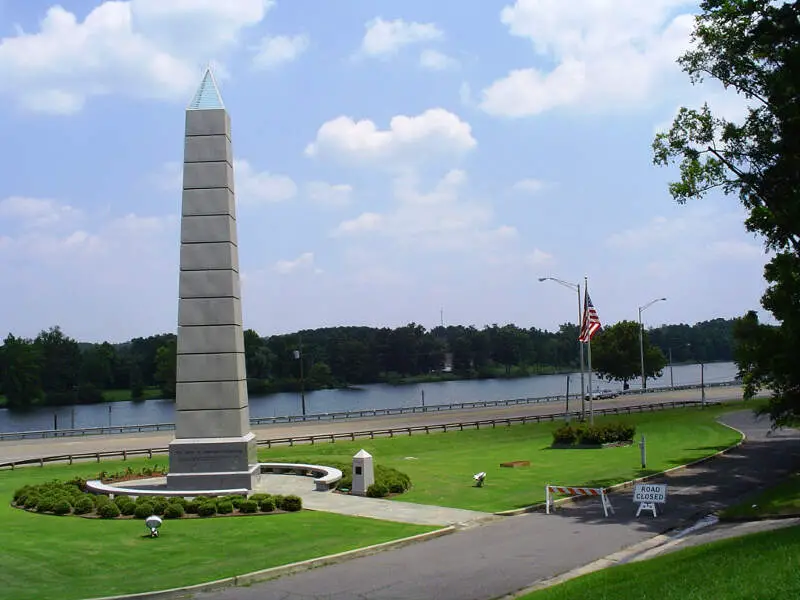
Gadsden, AL Photos
7 Reviews & Comments About Gadsden

I live in Gadsden....I actually love it here...well most of the time
I'm from Anniston and live in Gadsden, h**l Gadsden ain't the worst...
The crime in Gadsden is not at all likenyou have listed on your website as far as worse cities. Gadsden is a peaceful city and no you do not have to clinch your purse or valuables when visiting the city. I do not know how you calculate your scores or do I even care but what I do know is that you make cities look far worse than in reality. If I did not know any better and wanted to visit Gadsden and first checked your site, I would be afraid to travel to this city and would probably miss out of some of the most historical and most southern hospitality that one could or would ever endure. Please stop being so judgmental when it comes to cities and what you think of them! I would love to know what you would list as the best cities in Alabama to live. Let me guess, it would be the predominantly white neighborhoods where if you are a minority the sheriff or city police gets called because you may not look a certain way. Well I happen to live in one of those neighborhoods and I hate to be the bearer of bad news but crime happens there as well. Often times it is not reported or it is overlooked because some wealthy neighborhood mother or father paid their child's way out of the trouble. Drugs in the wealthy neighborhoods are far worse than what you would consider the "ghetto". M**h and heroine in these well to so neighborhoods is out of control!! So if you want to report on some factual claims, report on the truth! Furthermore, schools in the Gadsden area are magnet schools, which means that they have a high acedemic level to achieve and that they produce students with high merits. I made sure to mention that because you wanted information on the he schools on the area but I am sure that you already knew that as well.
This city is just as any other city. You should always watch your surrounds and be attentive to the people you come in contact with while visiting. What you bring to a person when visiting any city, is what you will get in return. If you greet people with a smile and be courteous and travel in groups you will be just fine. If you go out looking for trouble you can find that anywhere even in church.
There are a few neighborhoods that are not exactly the nicest but the schools are definitely good and it definitely has a relaxing atmosphere and shows off its southern charm
My favorite place to hang out at is the mall but there are a few things that you need too look out for like people who act out of place but you should always be fully alerted and aware of your surroundings
I live in this town. I have been a victim multiple times in this town. I love this town and the people that prey upon the weak it's where I love to call home.
Bad - no good paying jobs. Housing market is pitiful. Roads are horrible. A lot of schools are failing according to national reports. Very unsafe in all areas.
Good - we have a new venue event building, Buffalo Wild Wings is coming. Remodeled park in the high crime area. Plenty of shopping locations for mattresses and chicken.
WHERE DO YOU GET YOUR INFORMATION FROM- I have lived in Gadsden for almost 20 yrs. We have seen a difference in the traffic, population, jobs, businesses etc. The Crime, Drugs etc. are no worse here than anywhere else. We live near GRMC and our neighborhood has seen little change. I would welcome anyone traveling through or interested in relocating to Gadsden to slow down and spend some time here. Our city is trying to improve and is growing. We are like every other city with the WAR ON DRUGS!!! Our young people need things to do and guidance for a different direction. The current situation shows that there is a definite disconnect between morals, respect, discipline, accountability, responsibility and most importantly GOALS for the future! Everyone in this day and age needs to stand up, take notice and contribute to assist our fellow citizens to take back our Children and Families from this ADDICTION TO DRUGS!!!!!!!! Without this Gadsden and any other city has NO FUTURE.
WHERE DO YOU GET YOUR INFORMATION FROM- I have lived in Gadsden for almost 20 yrs. We have seen a difference in the traffic, population, jobs, businesses etc. The Crime, Drugs etc. are no worse here than anywhere else. We live near GRMC and our neighborhood has seen little change. I would welcome anyone traveling through or interested in relocating to Gadsden to slow down and spend some time here. Our city is trying to improve and is growing. We are like every other city with the WAR ON DRUGS!!! Our young people need things to do and guidance for a different direction. The current situation shows that there is a definite disconnect between morals, respect, discipline, accountability, responsibility and most importantly GOALS for the future! Everyone in this day and age needs to stand up, take notice and contribute to assist our fellow citizens to take back our Children and Families from this ADDICTION TO DRUGS!!!!!!!! Without this Gadsden and any other city has NO FUTURE.
I live in gadsden and I like it!!
Rankings & Articles For Gadsden


Locations Around Gadsden
Map Of Gadsden, AL
Best Places Around Gadsden
Cedartown, GA
Population 10,227
Anniston, AL
Population 21,271
Talladega, AL
Population 14,760
Fort Payne, AL
Population 14,927
Jacksonville, AL
Population 14,437
Scottsboro, AL
Population 15,712
Cullman, AL
Population 19,319
Saks, AL
Population 10,681
Irondale, AL
Population 13,464
Moody, AL
Population 13,488
Gadsden Demographics And Statistics
Population over time in Gadsden
The current population in Gadsden is 33,374. The population has decreased 10.2% from 2010.
| Year | Population | % Change |
|---|---|---|
| 2024 | 33,374 | -0.7% |
| 2023 | 33,617 | -0.8% |
| 2022 | 33,881 | -1.3% |
| 2021 | 34,317 | -2.6% |
| 2020 | 35,224 | -0.7% |
| 2019 | 35,486 | -0.4% |
| 2018 | 35,624 | -0.6% |
| 2017 | 35,832 | -1.1% |
| 2016 | 36,235 | -0.6% |
| 2015 | 36,455 | -0.5% |
| 2014 | 36,621 | -0.5% |
| 2013 | 36,794 | -0.3% |
| 2012 | 36,888 | -0.3% |
| 2011 | 37,014 | -0.4% |
| 2010 | 37,162 | - |
Race / Ethnicity in Gadsden
See the full breakdown
Gadsden is:
49.3% White with 16,438 White residents.
36.0% African American with 12,009 African American residents.
0.1% American Indian with 27 American Indian residents.
0.4% Asian with 137 Asian residents.
0.0% Hawaiian with 13 Hawaiian residents.
0.6% Other with 199 Other residents.
3.1% Two Or More with 1,044 Two Or More residents.
10.5% Hispanic with 3,507 Hispanic residents.
| Race | Gadsden | AL | USA |
|---|---|---|---|
| White | 49.3% | 63.4% | 57.4% |
| African American | 36.0% | 25.6% | 11.9% |
| American Indian | 0.1% | 0.3% | 0.5% |
| Asian | 0.4% | 1.4% | 5.9% |
| Hawaiian | 0.0% | 0.0% | 0.2% |
| Other | 0.6% | 0.4% | 0.6% |
| Two Or More | 3.1% | 3.3% | 4.3% |
| Hispanic | 10.5% | 5.6% | 19.3% |
Gender in Gadsden
See the full breakdown
Gadsden is 52.7% female with 17,585 female residents.
Gadsden is 47.3% male with 15,789 male residents.
| Gender | Gadsden | AL | USA |
|---|---|---|---|
| Female | 52.7% | 51.4% | 50.5% |
| Male | 47.3% | 48.6% | 49.5% |
Highest level of educational attainment in Gadsden for adults over 25
See the full breakdown
6.0% of adults in Gadsden completed < 9th grade.
12.0% of adults in Gadsden completed 9-12th grade.
34.0% of adults in Gadsden completed high school / ged.
24.0% of adults in Gadsden completed some college.
9.0% of adults in Gadsden completed associate's degree.
10.0% of adults in Gadsden completed bachelor's degree.
3.0% of adults in Gadsden completed master's degree.
1.0% of adults in Gadsden completed professional degree.
1.0% of adults in Gadsden completed doctorate degree.
| Education | Gadsden | AL | USA |
|---|---|---|---|
| < 9th Grade | 6.0% | 4.0% | 4.0% |
| 9-12th Grade | 12.0% | 8.0% | 6.0% |
| High School / GED | 34.0% | 30.0% | 26.0% |
| Some College | 24.0% | 21.0% | 19.0% |
| Associate's Degree | 9.0% | 9.0% | 9.0% |
| Bachelor's Degree | 10.0% | 17.0% | 22.0% |
| Master's Degree | 3.0% | 8.0% | 10.0% |
| Professional Degree | 1.0% | 2.0% | 2.0% |
| Doctorate Degree | 1.0% | 1.0% | 2.0% |
Household Income For Gadsden, Alabama
See the full breakdown
8.8% of households in Gadsden earn Less than $10,000.
9.4% of households in Gadsden earn $10,000 to $14,999.
15.9% of households in Gadsden earn $15,000 to $24,999.
9.8% of households in Gadsden earn $25,000 to $34,999.
15.5% of households in Gadsden earn $35,000 to $49,999.
18.6% of households in Gadsden earn $50,000 to $74,999.
9.4% of households in Gadsden earn $75,000 to $99,999.
7.4% of households in Gadsden earn $100,000 to $149,999.
2.9% of households in Gadsden earn $150,000 to $199,999.
2.2% of households in Gadsden earn $200,000 or more.
| Income | Gadsden | AL | USA |
|---|---|---|---|
| Less than $10,000 | 8.8% | 6.3% | 5.0% |
| $10,000 to $14,999 | 9.4% | 4.7% | 3.4% |
| $15,000 to $24,999 | 15.9% | 8.8% | 6.3% |
| $25,000 to $34,999 | 9.8% | 8.5% | 6.6% |
| $35,000 to $49,999 | 15.5% | 11.8% | 10.1% |
| $50,000 to $74,999 | 18.6% | 16.7% | 15.5% |
| $75,000 to $99,999 | 9.4% | 12.7% | 12.6% |
| $100,000 to $149,999 | 7.4% | 15.5% | 17.5% |
| $150,000 to $199,999 | 2.9% | 7.4% | 9.6% |
| $200,000 or more | 2.2% | 7.8% | 13.4% |
Source: U.S. Census ACS 5-year estimates (2024)


