Sylacauga SnackAbility
Overall SnackAbility
Crime in Sylacauga summary. We use data from the FBI to determine the crime rates in Sylacauga. Key points include:
There were 489 total crimes in Sylacauga in the last reporting year.
The overall crime rate per 100,000 people in Sylacauga is 4,038.3 / 100k people.
The violent crime rate per 100,000 people in Sylacauga is 561.6 / 100k people.
The property crime rate per 100,000 people in Sylacauga is 3,476.8 / 100k people.
Overall, crime in Sylacauga is 90.56% above the national average.
Total Crimes
Above National Average
Crime In Sylacauga Comparison Table
| Statistic | Count Raw |
Sylacauga / 100k People |
Alabama / 100k People |
National / 100k People |
|---|---|---|---|---|
| Total Crimes Per 100K | 489 | 4,038.3 | 1,924.9 | 2,119.2 |
| Violent Crime | 68 | 561.6 | 359.9 | 359.0 |
| Murder | 1 | 8.3 | 8.7 | 5.0 |
| Robbery | 4 | 33.0 | 34.0 | 61.0 |
| Aggravated Assault | 60 | 495.5 | 291.4 | 256.0 |
| Property Crime | 421 | 3,476.8 | 1,565.1 | 1,760.0 |
| Burglary | 106 | 875.4 | 243.5 | 229.0 |
| Larceny | 298 | 2,461.0 | 1,148.5 | 1,272.0 |
| Car Theft | 17 | 140.4 | 173.0 | 259.0 |
Source: FBI Uniform Crime Reporting (2024)
Cost of living in Sylacauga summary. We use data on the cost of living to determine how expensive it is to live in Sylacauga. Real estate prices drive most of the variance in cost of living around Alabama. Key points include:
The cost of living in Sylacauga is 86 with 100 being average.
The cost of living in Sylacauga is 0.9x lower than the national average.
The median home value in Sylacauga is $166,280.
The median income in Sylacauga is $50,017.
Sylacauga's Overall Cost Of Living
Lower Than The National Average
Cost Of Living In Sylacauga Comparison Table
| Living Expense | Sylacauga | Alabama | National Average |
|---|---|---|---|
| Overall | 86 | 91 | 100 |
| Services | 94 | 95 | 100 |
| Groceries | 95 | 96 | 100 |
| Health | 71 | 74 | 100 |
| Housing | 96 | 96 | 100 |
| Transportation | 100 | 95 | 100 |
| Utilities | 91 | 95 | 100 |
Source: Cost of living index, normalized to US average = 100
Sylacauga, AL Weather
The average high in Sylacauga is 74.5° and the average low is 49.8°.
There are 77.8 days of precipitation each year.
Expect an average of 53.7 inches of precipitation each year with 1.1 inches of snow.
| Stat | Sylacauga |
|---|---|
| Average Annual High | 74.5 |
| Average Annual Low | 49.8 |
| Annual Precipitation Days | 77.8 |
| Average Annual Precipitation | 53.7 |
| Average Annual Snowfall | 1.1 |
Average High
Days of Rain
Source: NOAA climate normals (30-year)
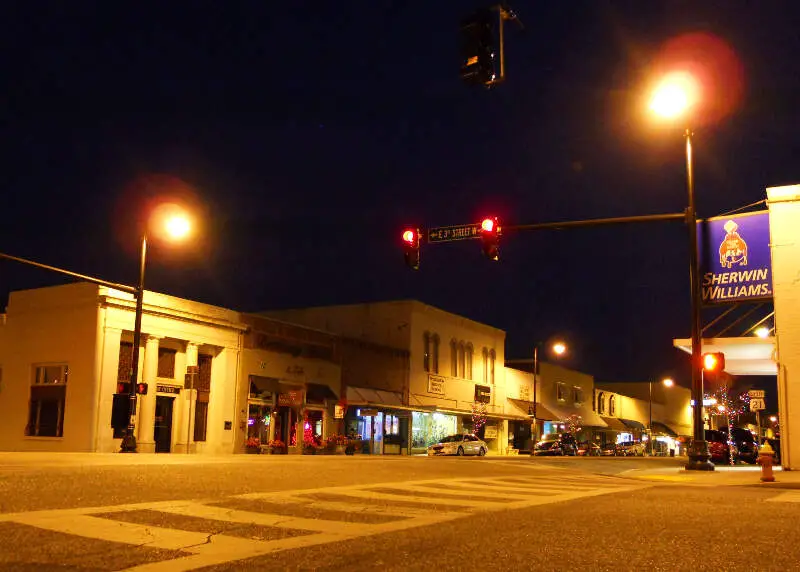
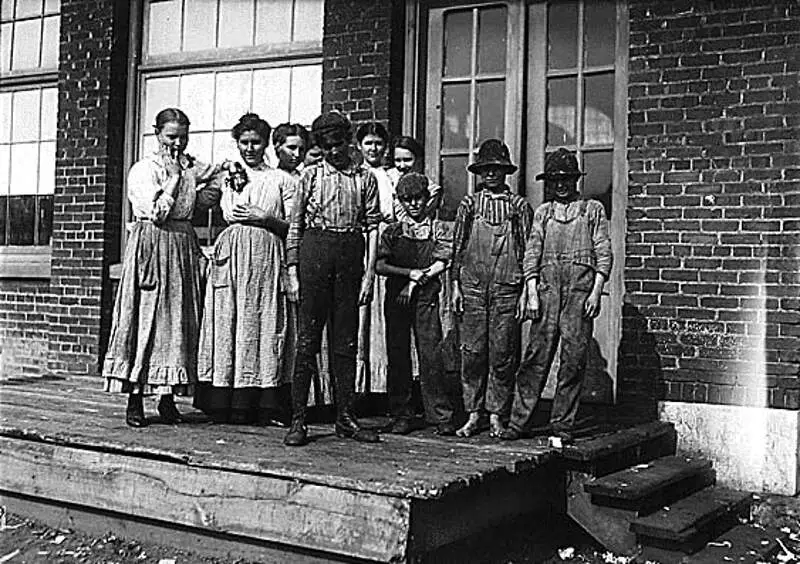
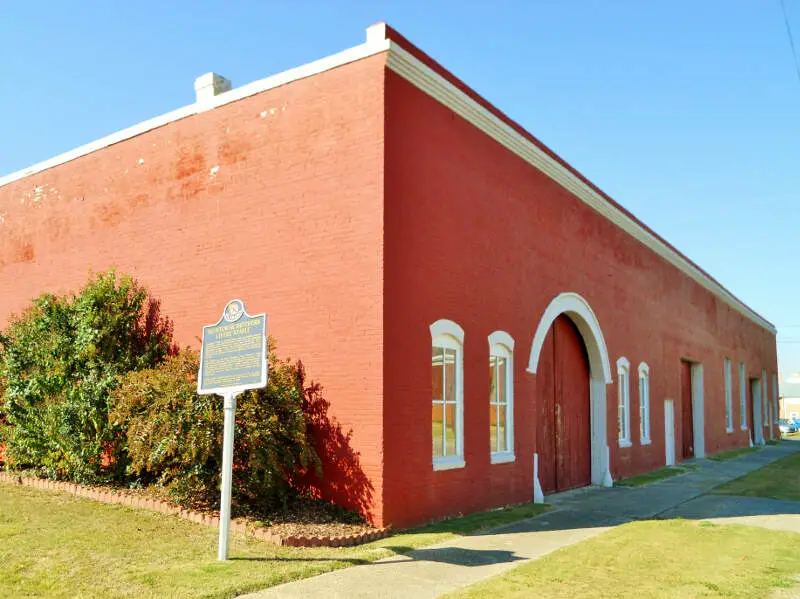
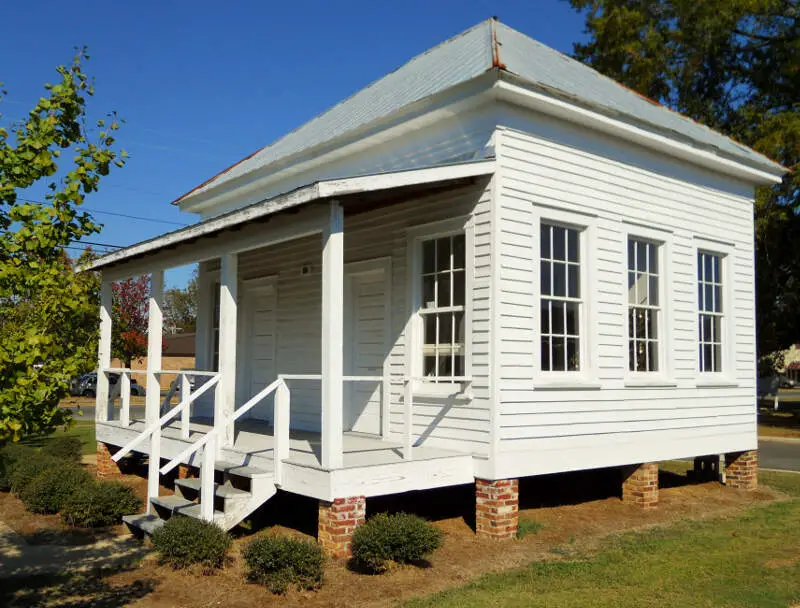
Sylacauga, AL Photos


1 Reviews & Comments About Sylacauga

i live in Alabama and our school system is great their even going for an award this and crime is bad but not as bad as other place's in america i think to many people not from Alabama or even the south give us a bad wrap
marble festival here in town lake martin mobile
Rankings & Articles For Sylacauga


Locations Around Sylacauga
Map Of Sylacauga, AL
Best Places Around Sylacauga
Bessemer, AL
Population 25,400
Anniston, AL
Population 21,271
Talladega, AL
Population 14,760
Birmingham, AL
Population 198,173
Fairfield, AL
Population 9,728
Calera, AL
Population 17,714
Saks, AL
Population 10,681
Millbrook, AL
Population 17,189
Irondale, AL
Population 13,464
Moody, AL
Population 13,488
Sylacauga Demographics And Statistics
Population over time in Sylacauga
The current population in Sylacauga is 12,309. The population has decreased 3.8% from 2010.
| Year | Population | % Change |
|---|---|---|
| 2024 | 12,309 | -0.6% |
| 2023 | 12,388 | -0.6% |
| 2022 | 12,465 | -0.4% |
| 2021 | 12,512 | 3.1% |
| 2020 | 12,132 | -0.8% |
| 2019 | 12,226 | -1.4% |
| 2018 | 12,397 | -0.8% |
| 2017 | 12,492 | -1.6% |
| 2016 | 12,696 | -0.4% |
| 2015 | 12,749 | -0.3% |
| 2014 | 12,786 | 0.1% |
| 2013 | 12,775 | -0.0% |
| 2012 | 12,778 | -0.0% |
| 2011 | 12,780 | -0.1% |
| 2010 | 12,789 | - |
Race / Ethnicity in Sylacauga
See the full breakdown
Sylacauga is:
61.3% White with 7,541 White residents.
33.7% African American with 4,142 African American residents.
0.6% American Indian with 76 American Indian residents.
0.0% Asian with 0 Asian residents.
0.0% Hawaiian with 1 Hawaiian residents.
0.0% Other with 0 Other residents.
3.0% Two Or More with 366 Two Or More residents.
1.5% Hispanic with 183 Hispanic residents.
| Race | Sylacauga | AL | USA |
|---|---|---|---|
| White | 61.3% | 63.4% | 57.4% |
| African American | 33.7% | 25.6% | 11.9% |
| American Indian | 0.6% | 0.3% | 0.5% |
| Asian | 0.0% | 1.4% | 5.9% |
| Hawaiian | 0.0% | 0.0% | 0.2% |
| Other | 0.0% | 0.4% | 0.6% |
| Two Or More | 3.0% | 3.3% | 4.3% |
| Hispanic | 1.5% | 5.6% | 19.3% |
Gender in Sylacauga
See the full breakdown
Sylacauga is 56.7% female with 6,978 female residents.
Sylacauga is 43.3% male with 5,330 male residents.
| Gender | Sylacauga | AL | USA |
|---|---|---|---|
| Female | 56.7% | 51.4% | 50.5% |
| Male | 43.3% | 48.6% | 49.5% |
Highest level of educational attainment in Sylacauga for adults over 25
See the full breakdown
4.0% of adults in Sylacauga completed < 9th grade.
10.0% of adults in Sylacauga completed 9-12th grade.
30.0% of adults in Sylacauga completed high school / ged.
28.0% of adults in Sylacauga completed some college.
10.0% of adults in Sylacauga completed associate's degree.
10.0% of adults in Sylacauga completed bachelor's degree.
4.0% of adults in Sylacauga completed master's degree.
3.0% of adults in Sylacauga completed professional degree.
1.0% of adults in Sylacauga completed doctorate degree.
| Education | Sylacauga | AL | USA |
|---|---|---|---|
| < 9th Grade | 4.0% | 4.0% | 4.0% |
| 9-12th Grade | 10.0% | 8.0% | 6.0% |
| High School / GED | 30.0% | 30.0% | 26.0% |
| Some College | 28.0% | 21.0% | 19.0% |
| Associate's Degree | 10.0% | 9.0% | 9.0% |
| Bachelor's Degree | 10.0% | 17.0% | 22.0% |
| Master's Degree | 4.0% | 8.0% | 10.0% |
| Professional Degree | 3.0% | 2.0% | 2.0% |
| Doctorate Degree | 1.0% | 1.0% | 2.0% |
Household Income For Sylacauga, Alabama
See the full breakdown
8.2% of households in Sylacauga earn Less than $10,000.
10.2% of households in Sylacauga earn $10,000 to $14,999.
10.1% of households in Sylacauga earn $15,000 to $24,999.
8.4% of households in Sylacauga earn $25,000 to $34,999.
13.1% of households in Sylacauga earn $35,000 to $49,999.
17.5% of households in Sylacauga earn $50,000 to $74,999.
16.1% of households in Sylacauga earn $75,000 to $99,999.
11.5% of households in Sylacauga earn $100,000 to $149,999.
3.8% of households in Sylacauga earn $150,000 to $199,999.
1.1% of households in Sylacauga earn $200,000 or more.
| Income | Sylacauga | AL | USA |
|---|---|---|---|
| Less than $10,000 | 8.2% | 6.3% | 5.0% |
| $10,000 to $14,999 | 10.2% | 4.7% | 3.4% |
| $15,000 to $24,999 | 10.1% | 8.8% | 6.3% |
| $25,000 to $34,999 | 8.4% | 8.5% | 6.6% |
| $35,000 to $49,999 | 13.1% | 11.8% | 10.1% |
| $50,000 to $74,999 | 17.5% | 16.7% | 15.5% |
| $75,000 to $99,999 | 16.1% | 12.7% | 12.6% |
| $100,000 to $149,999 | 11.5% | 15.5% | 17.5% |
| $150,000 to $199,999 | 3.8% | 7.4% | 9.6% |
| $200,000 or more | 1.1% | 7.8% | 13.4% |
Source: U.S. Census ACS 5-year estimates (2024)


