Cave Springs SnackAbility
Overall SnackAbility
Crime in Cave Springs summary. We use data from the FBI to determine the crime rates in Cave Springs. Key points include:
There were 22 total crimes in Cave Springs in the last reporting year.
The overall crime rate per 100,000 people in Cave Springs is 352.1 / 100k people.
The violent crime rate per 100,000 people in Cave Springs is 96.0 / 100k people.
The property crime rate per 100,000 people in Cave Springs is 256.1 / 100k people.
Overall, crime in Cave Springs is -83.38% below the national average.
Total Crimes
Below National Average
Crime In Cave Springs Comparison Table
| Statistic | Count Raw |
Cave Springs / 100k People |
Arkansas / 100k People |
National / 100k People |
|---|---|---|---|---|
| Total Crimes Per 100K | 22 | 352.1 | 2,508.9 | 2,119.2 |
| Violent Crime | 6 | 96.0 | 579.4 | 359.0 |
| Murder | 0 | 0.0 | 7.3 | 5.0 |
| Robbery | 0 | 0.0 | 38.6 | 61.0 |
| Aggravated Assault | 5 | 80.0 | 463.5 | 256.0 |
| Property Crime | 16 | 256.1 | 1,929.5 | 1,760.0 |
| Burglary | 5 | 80.0 | 352.7 | 229.0 |
| Larceny | 10 | 160.1 | 1,400.0 | 1,272.0 |
| Car Theft | 1 | 16.0 | 176.8 | 259.0 |
Source: FBI Uniform Crime Reporting (2024)
Cave Springs, AR Weather
The average high in Cave Springs is 68.7° and the average low is 46.4°.
There are 69.4 days of precipitation each year.
Expect an average of 47.0 inches of precipitation each year with 10.4 inches of snow.
| Stat | Cave Springs |
|---|---|
| Average Annual High | 68.7 |
| Average Annual Low | 46.4 |
| Annual Precipitation Days | 69.4 |
| Average Annual Precipitation | 47.0 |
| Average Annual Snowfall | 10.4 |
Average High
Days of Rain
Source: NOAA climate normals (30-year)
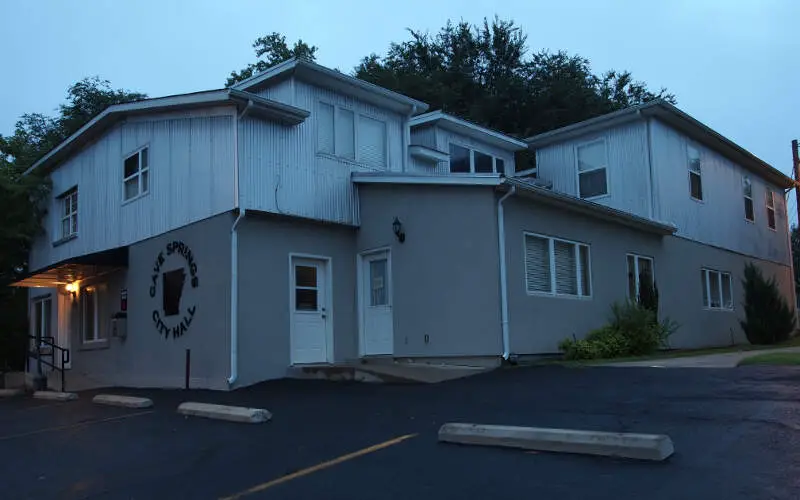
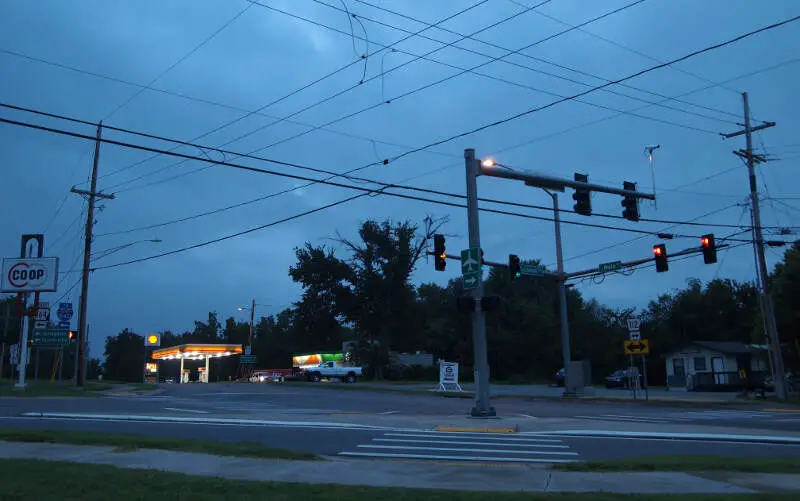
Cave Springs, AR Photos
Rankings & Articles For Cave Springs


Locations Around Cave Springs
Map Of Cave Springs, AR
Best Places Around Cave Springs
Springdale, AR
Population 88,160
Rogers, AR
Population 72,981
Bentonville, AR
Population 58,249
Fayetteville, AR
Population 99,319
Siloam Springs, AR
Population 18,699
Centerton, AR
Population 21,920
Lowell, AR
Population 10,849
Farmington, AR
Population 9,094
Cave Springs Demographics And Statistics
Population over time in Cave Springs
The current population in Cave Springs is 6,008. The population has increased 315.2% from 2010.
| Year | Population | % Change |
|---|---|---|
| 2024 | 6,008 | 4.0% |
| 2023 | 5,778 | 4.7% |
| 2022 | 5,521 | 5.7% |
| 2021 | 5,224 | 7.5% |
| 2020 | 4,859 | 11.5% |
| 2019 | 4,359 | 12.3% |
| 2018 | 3,881 | 16.9% |
| 2017 | 3,320 | 18.4% |
| 2016 | 2,803 | 13.3% |
| 2015 | 2,475 | 11.0% |
| 2014 | 2,230 | 7.8% |
| 2013 | 2,069 | 6.5% |
| 2012 | 1,942 | 8.4% |
| 2011 | 1,791 | 23.8% |
| 2010 | 1,447 | - |
Race / Ethnicity in Cave Springs
See the full breakdown
Cave Springs is:
68.3% White with 4,106 White residents.
0.3% African American with 21 African American residents.
0.0% American Indian with 0 American Indian residents.
0.8% Asian with 50 Asian residents.
0.0% Hawaiian with 0 Hawaiian residents.
0.5% Other with 33 Other residents.
23.4% Two Or More with 1,404 Two Or More residents.
6.6% Hispanic with 394 Hispanic residents.
| Race | Cave Springs | AR | USA |
|---|---|---|---|
| White | 68.3% | 67.4% | 57.4% |
| African American | 0.3% | 14.6% | 11.9% |
| American Indian | 0.0% | 0.3% | 0.5% |
| Asian | 0.8% | 1.6% | 5.9% |
| Hawaiian | 0.0% | 0.4% | 0.2% |
| Other | 0.5% | 0.3% | 0.6% |
| Two Or More | 23.4% | 6.3% | 4.3% |
| Hispanic | 6.6% | 9.0% | 19.3% |
Gender in Cave Springs
See the full breakdown
Cave Springs is 50.4% female with 3,031 female residents.
Cave Springs is 49.6% male with 2,977 male residents.
| Gender | Cave Springs | AR | USA |
|---|---|---|---|
| Female | 50.4% | 50.6% | 50.5% |
| Male | 49.6% | 49.4% | 49.5% |
Highest level of educational attainment in Cave Springs for adults over 25
See the full breakdown
3.0% of adults in Cave Springs completed < 9th grade.
1.0% of adults in Cave Springs completed 9-12th grade.
25.0% of adults in Cave Springs completed high school / ged.
13.0% of adults in Cave Springs completed some college.
5.0% of adults in Cave Springs completed associate's degree.
32.0% of adults in Cave Springs completed bachelor's degree.
15.0% of adults in Cave Springs completed master's degree.
4.0% of adults in Cave Springs completed professional degree.
2.0% of adults in Cave Springs completed doctorate degree.
| Education | Cave Springs | AR | USA |
|---|---|---|---|
| < 9th Grade | 3.0% | 5.0% | 4.0% |
| 9-12th Grade | 1.0% | 7.0% | 6.0% |
| High School / GED | 25.0% | 34.0% | 26.0% |
| Some College | 13.0% | 21.0% | 19.0% |
| Associate's Degree | 5.0% | 8.0% | 9.0% |
| Bachelor's Degree | 32.0% | 16.0% | 22.0% |
| Master's Degree | 15.0% | 7.0% | 10.0% |
| Professional Degree | 4.0% | 1.0% | 2.0% |
| Doctorate Degree | 2.0% | 1.0% | 2.0% |
Household Income For Cave Springs, Arkansas
See the full breakdown
1.0% of households in Cave Springs earn Less than $10,000.
1.2% of households in Cave Springs earn $10,000 to $14,999.
0.0% of households in Cave Springs earn $15,000 to $24,999.
5.9% of households in Cave Springs earn $25,000 to $34,999.
2.1% of households in Cave Springs earn $35,000 to $49,999.
8.8% of households in Cave Springs earn $50,000 to $74,999.
11.5% of households in Cave Springs earn $75,000 to $99,999.
20.7% of households in Cave Springs earn $100,000 to $149,999.
16.1% of households in Cave Springs earn $150,000 to $199,999.
32.6% of households in Cave Springs earn $200,000 or more.
| Income | Cave Springs | AR | USA |
|---|---|---|---|
| Less than $10,000 | 1.0% | 6.1% | 5.0% |
| $10,000 to $14,999 | 1.2% | 4.9% | 3.4% |
| $15,000 to $24,999 | 0.0% | 8.9% | 6.3% |
| $25,000 to $34,999 | 5.9% | 9.1% | 6.6% |
| $35,000 to $49,999 | 2.1% | 12.9% | 10.1% |
| $50,000 to $74,999 | 8.8% | 17.4% | 15.5% |
| $75,000 to $99,999 | 11.5% | 12.8% | 12.6% |
| $100,000 to $149,999 | 20.7% | 15.0% | 17.5% |
| $150,000 to $199,999 | 16.1% | 6.2% | 9.6% |
| $200,000 or more | 32.6% | 6.7% | 13.4% |
Source: U.S. Census ACS 5-year estimates (2024)


