Compare Scottsdale to…
Scottsdale SnackAbility
Overall SnackAbility
Crime in Scottsdale summary. We use data from the FBI to determine the crime rates in Scottsdale. Key points include:
There were 4,973 total crimes in Scottsdale in the last reporting year.
The overall crime rate per 100,000 people in Scottsdale is 2,027.8 / 100k people.
The violent crime rate per 100,000 people in Scottsdale is 152.5 / 100k people.
The property crime rate per 100,000 people in Scottsdale is 1,875.3 / 100k people.
Overall, crime in Scottsdale is -4.31% below the national average.
Total Crimes
Below National Average
Crime In Scottsdale Comparison Table
| Statistic | Count Raw |
Scottsdale / 100k People |
Arizona / 100k People |
National / 100k People |
|---|---|---|---|---|
| Total Crimes Per 100K | 4,973 | 2,027.8 | 2,214.0 | 2,119.2 |
| Violent Crime | 374 | 152.5 | 421.9 | 359.0 |
| Murder | 1 | 0.4 | 4.9 | 5.0 |
| Robbery | 54 | 22.0 | 64.6 | 61.0 |
| Aggravated Assault | 236 | 96.2 | 312.4 | 256.0 |
| Property Crime | 4,599 | 1,875.3 | 1,792.1 | 1,760.0 |
| Burglary | 447 | 182.3 | 217.8 | 229.0 |
| Larceny | 3,764 | 1,534.8 | 1,329.9 | 1,272.0 |
| Car Theft | 388 | 158.2 | 244.4 | 259.0 |
Source: FBI Uniform Crime Reporting (2024)
Cost of living in Scottsdale summary. We use data on the cost of living to determine how expensive it is to live in Scottsdale. Real estate prices drive most of the variance in cost of living around Arizona. Key points include:
The cost of living in Scottsdale is 144 with 100 being average.
The cost of living in Scottsdale is 1.4x higher than the national average.
The median home value in Scottsdale is $858,022.
The median income in Scottsdale is $110,886.
Scottsdale's Overall Cost Of Living
Higher Than The National Average
Cost Of Living In Scottsdale Comparison Table
| Living Expense | Scottsdale | Arizona | National Average |
|---|---|---|---|
| Overall | 144 | 100 | 100 |
| Services | 101 | 99 | 100 |
| Groceries | 103 | 99 | 100 |
| Health | 243 | 97 | 100 |
| Housing | 107 | 104 | 100 |
| Transportation | 112 | 113 | 100 |
| Utilities | 104 | 104 | 100 |
Source: Cost of living index, normalized to US average = 100
Scottsdale, AZ Weather
The average high in Scottsdale is 85.8° and the average low is 58.1°.
There are 20.6 days of precipitation each year.
Expect an average of 9.3 inches of precipitation each year with 0.0 inches of snow.
| Stat | Scottsdale |
|---|---|
| Average Annual High | 85.8 |
| Average Annual Low | 58.1 |
| Annual Precipitation Days | 20.6 |
| Average Annual Precipitation | 9.3 |
| Average Annual Snowfall | 0.0 |
Average High
Days of Rain
Source: NOAA climate normals (30-year)
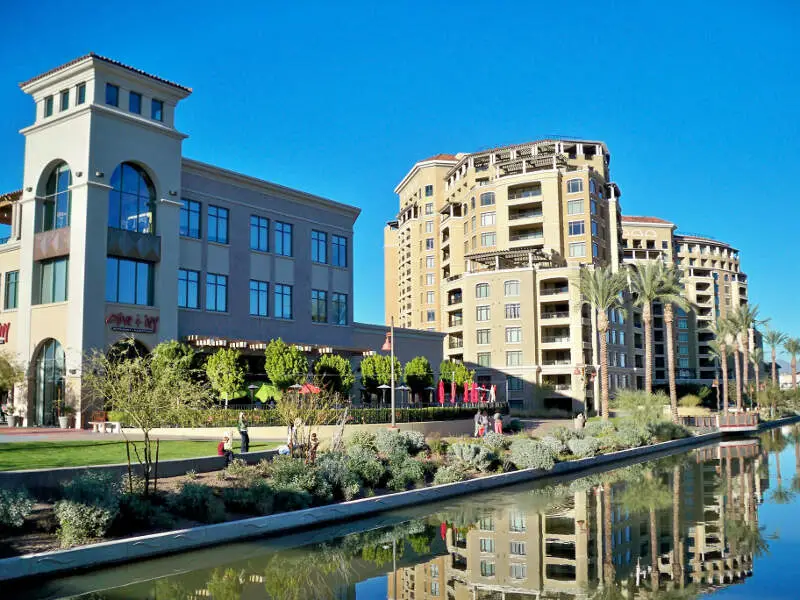
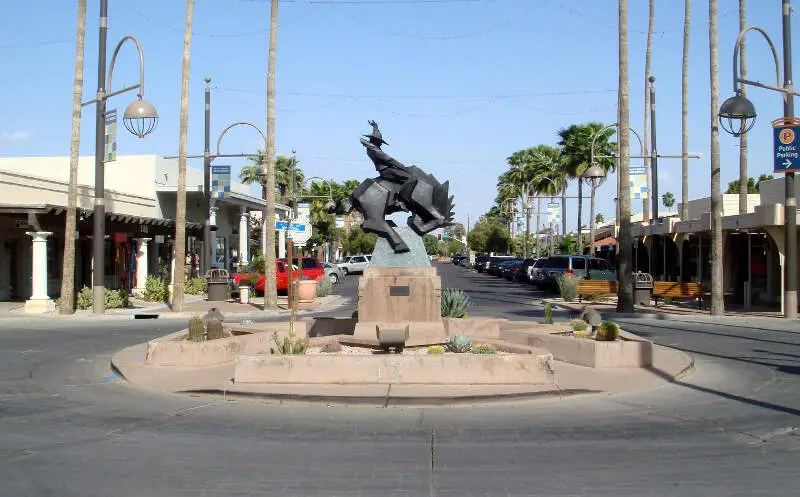
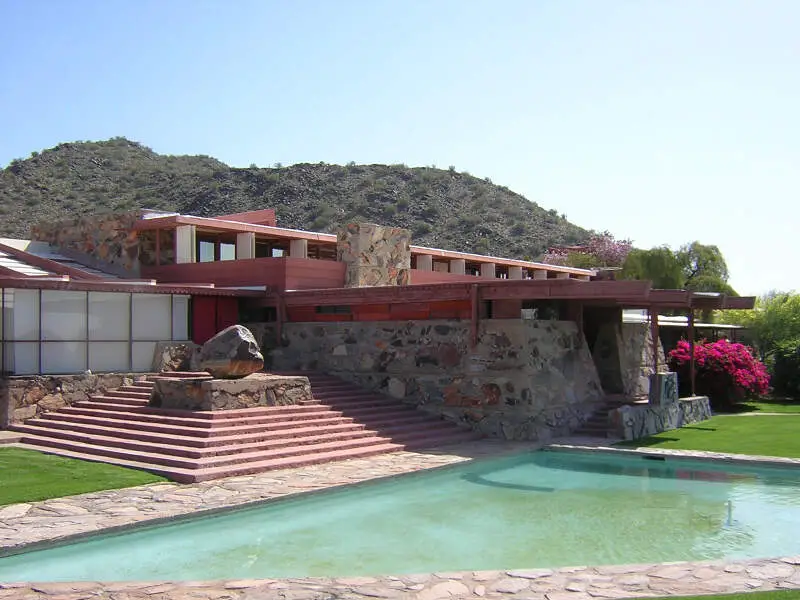
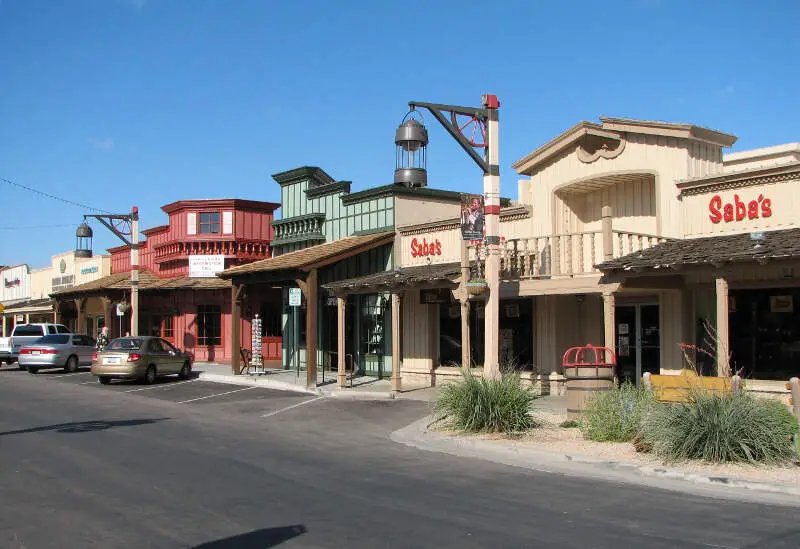
Scottsdale, AZ Photos


Rankings & Articles For Scottsdale


Locations Around Scottsdale
Map Of Scottsdale, AZ
Best Places Around Scottsdale
Fountain Hills, AZ
Population 23,789
New River, AZ
Population 18,240
Paradise Valley, AZ
Population 12,611
Cave Creek, AZ
Population 5,091
Phoenix, AZ
Population 1,642,323
Anthem, AZ
Population 22,584
Scottsdale Demographics And Statistics
Population over time in Scottsdale
The current population in Scottsdale is 243,821. The population has increased 11.5% from 2010.
| Year | Population | % Change |
|---|---|---|
| 2024 | 243,821 | 0.7% |
| 2023 | 242,169 | 0.7% |
| 2022 | 240,537 | 0.8% |
| 2021 | 238,685 | -6.4% |
| 2020 | 254,995 | 1.8% |
| 2019 | 250,602 | 1.9% |
| 2018 | 246,026 | 2.8% |
| 2017 | 239,283 | 2.0% |
| 2016 | 234,495 | 3.1% |
| 2015 | 227,471 | 1.8% |
| 2014 | 223,519 | 1.0% |
| 2013 | 221,283 | 0.6% |
| 2012 | 219,867 | 0.3% |
| 2011 | 219,311 | 0.2% |
| 2010 | 218,770 | - |
Race / Ethnicity in Scottsdale
See the full breakdown
Scottsdale is:
77.1% White with 188,087 White residents.
2.1% African American with 5,141 African American residents.
0.5% American Indian with 1,266 American Indian residents.
4.9% Asian with 11,946 Asian residents.
0.1% Hawaiian with 294 Hawaiian residents.
0.6% Other with 1,505 Other residents.
4.0% Two Or More with 9,795 Two Or More residents.
10.6% Hispanic with 25,787 Hispanic residents.
| Race | Scottsdale | AZ | USA |
|---|---|---|---|
| White | 77.1% | 52.6% | 57.4% |
| African American | 2.1% | 4.4% | 11.9% |
| American Indian | 0.5% | 3.2% | 0.5% |
| Asian | 4.9% | 3.5% | 5.9% |
| Hawaiian | 0.1% | 0.2% | 0.2% |
| Other | 0.6% | 0.5% | 0.6% |
| Two Or More | 4.0% | 4.4% | 4.3% |
| Hispanic | 10.6% | 31.4% | 19.3% |
Gender in Scottsdale
See the full breakdown
Scottsdale is 51.8% female with 126,332 female residents.
Scottsdale is 48.2% male with 117,488 male residents.
| Gender | Scottsdale | AZ | USA |
|---|---|---|---|
| Female | 51.8% | 50.1% | 50.5% |
| Male | 48.2% | 49.9% | 49.5% |
Highest level of educational attainment in Scottsdale for adults over 25
See the full breakdown
1.0% of adults in Scottsdale completed < 9th grade.
1.0% of adults in Scottsdale completed 9-12th grade.
11.0% of adults in Scottsdale completed high school / ged.
18.0% of adults in Scottsdale completed some college.
7.0% of adults in Scottsdale completed associate's degree.
37.0% of adults in Scottsdale completed bachelor's degree.
16.0% of adults in Scottsdale completed master's degree.
6.0% of adults in Scottsdale completed professional degree.
3.0% of adults in Scottsdale completed doctorate degree.
| Education | Scottsdale | AZ | USA |
|---|---|---|---|
| < 9th Grade | 1.0% | 6.0% | 4.0% |
| 9-12th Grade | 1.0% | 6.0% | 6.0% |
| High School / GED | 11.0% | 23.0% | 26.0% |
| Some College | 18.0% | 23.0% | 19.0% |
| Associate's Degree | 7.0% | 9.0% | 9.0% |
| Bachelor's Degree | 37.0% | 20.0% | 22.0% |
| Master's Degree | 16.0% | 9.0% | 10.0% |
| Professional Degree | 6.0% | 2.0% | 2.0% |
| Doctorate Degree | 3.0% | 2.0% | 2.0% |
Household Income For Scottsdale, Arizona
See the full breakdown
4.2% of households in Scottsdale earn Less than $10,000.
1.6% of households in Scottsdale earn $10,000 to $14,999.
3.7% of households in Scottsdale earn $15,000 to $24,999.
4.8% of households in Scottsdale earn $25,000 to $34,999.
7.3% of households in Scottsdale earn $35,000 to $49,999.
12.3% of households in Scottsdale earn $50,000 to $74,999.
11.7% of households in Scottsdale earn $75,000 to $99,999.
17.1% of households in Scottsdale earn $100,000 to $149,999.
11.6% of households in Scottsdale earn $150,000 to $199,999.
25.6% of households in Scottsdale earn $200,000 or more.
| Income | Scottsdale | AZ | USA |
|---|---|---|---|
| Less than $10,000 | 4.2% | 5.0% | 5.0% |
| $10,000 to $14,999 | 1.6% | 2.7% | 3.4% |
| $15,000 to $24,999 | 3.7% | 5.8% | 6.3% |
| $25,000 to $34,999 | 4.8% | 6.6% | 6.6% |
| $35,000 to $49,999 | 7.3% | 10.5% | 10.1% |
| $50,000 to $74,999 | 12.3% | 16.5% | 15.5% |
| $75,000 to $99,999 | 11.7% | 13.5% | 12.6% |
| $100,000 to $149,999 | 17.1% | 18.4% | 17.5% |
| $150,000 to $199,999 | 11.6% | 9.4% | 9.6% |
| $200,000 or more | 25.6% | 11.6% | 13.4% |
Source: U.S. Census ACS 5-year estimates (2024)


