Scottsdalevs.Phoenix Which City Is Right for You in 2026?
A head-to-head guide to cost of living, jobs, transportation, weather, crime, and quality of life — so you can decide where to live, work, or visit.
Updated 2026-05-26 · By HomeSnacks Editorial
Scottsdale vs. Phoenix at a glance
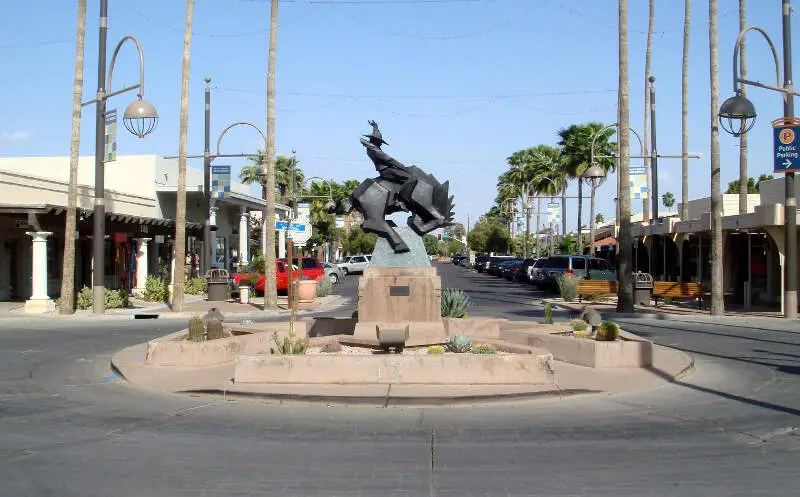
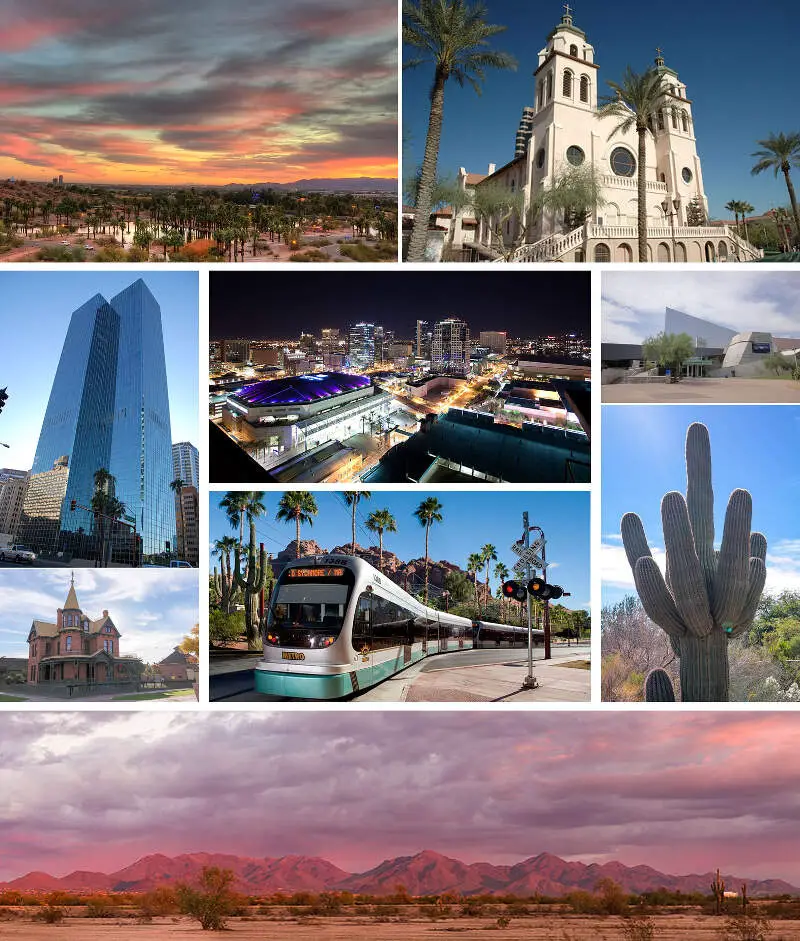
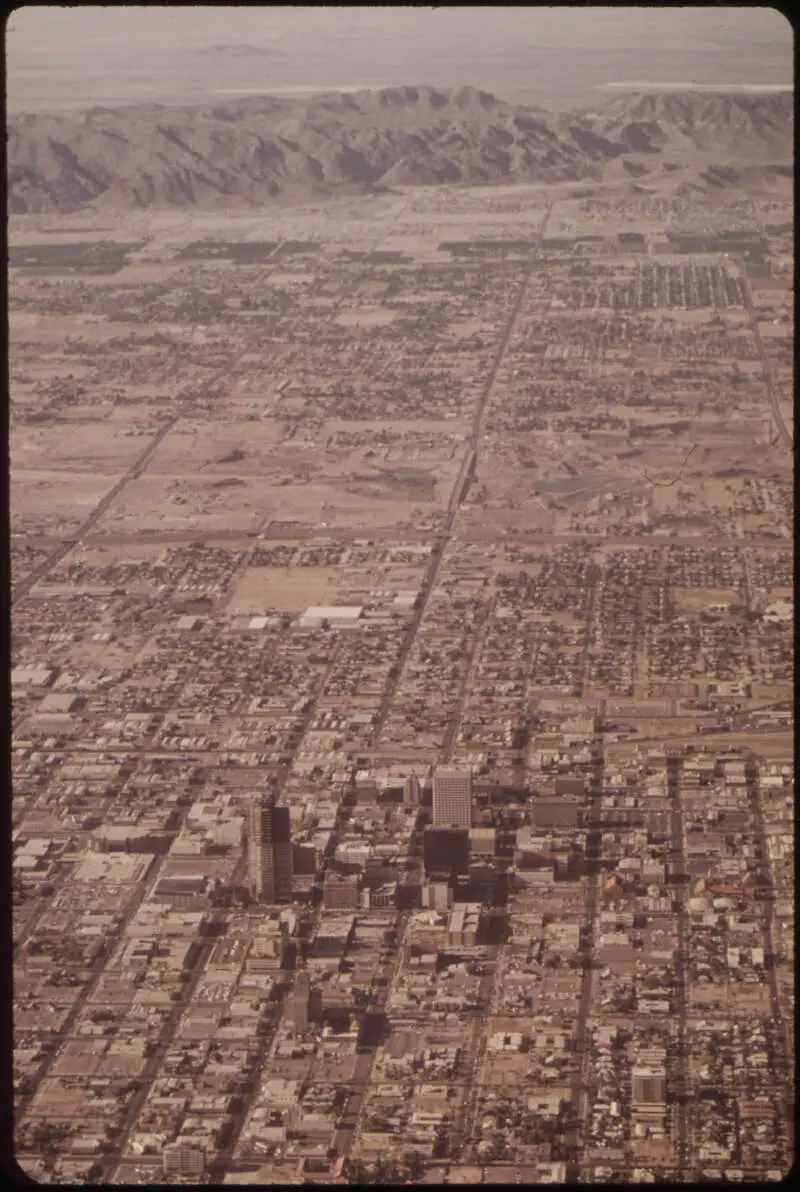
Choosing between Scottsdale, AZ and Phoenix, AZ comes down to which trade-offs you're willing to make. Scottsdale is a city in eastern Maricopa County, Arizona, United States, and is part of the Phoenix metropolitan area. Named Scottsdale in 1894 after its founder Winfield Scott, a retired U.S. Phoenix is the capital and most populous city of the U.S. state of Arizona. With over 1.6 million residents at the 2020 census, Phoenix is the fifth-most populous city in the United States and the most populous state capital.
On cost of living, Phoenix is the cheaper city: its overall index sits at 111 versus 144 in Scottsdale (100 = national average). Median home values run $858,022 in Scottsdale and $410,168 in Phoenix, with median rents at $2,013 and $1,582 respectively. That puts the home-value-to-income ratio at 7.7x in Scottsdale versus 5.0x in Phoenix.
Public safety is another point of divergence. Scottsdale reports 2,028 total crimes per 100,000 residents annually versus 3,125 in Phoenix. Phoenix is the more racially diverse of the two on a Herfindahl index basis — Scottsdale skews 77% White while Phoenix skews 42% Hispanic. On HomeSnacks' overall SnackAbility score, Scottsdale edges ahead at 9/10 versus 6/10 for Phoenix.
Scottsdale vs. Phoenix in photos
A side-by-side look at each city.


Cost of living
Phoenix is the cheaper city overall — 30% higher in Scottsdale than its rival. Index baseline: 100 = national average.
| Living expense | Scottsdale | Phoenix | US average |
|---|---|---|---|
| Overall | 144 | 111 | 100 |
| Services | 101 | 105 | 100 |
| Groceries | 103 | 104 | 100 |
| Health | 243 | 133 | 100 |
| Housing | 107 | 106 | 100 |
| Transportation | 112 | 112 | 100 |
| Utilities | 104 | 103 | 100 |
Lower index = cheaper. 100 = U.S. national average. Bar inside each cell scales relative to the highest value in the table.
Sources: HomeSnacks Cost of Living indices, normalized so 100 = U.S. national average. Drill in: Scottsdale cost of living, Phoenix cost of living, or the cheapest cities in America.
Housing breakdown
Home prices are higher in Scottsdale. Compare absolute price and price-to-income — a $500k home in a $100k-income city is very different from one in a $50k-income city.
| Metric | Scottsdale | Phoenix | United States |
|---|---|---|---|
| Median Home Value | $858,022 | $410,168 | $332,700 |
| Median Rent | $2,013 | $1,582 | $1,413 |
| Median Income | $110,886 | $81,332 | $80,734 |
| Home Value To Income | 7.7x | 5.0x | 4.1x |
| Rent To Monthly Income | 0.22x | 0.23x | 0.21x |
Source: U.S. Census Bureau ACS 2020-2024. See also states with the highest rent in America.
Crime
Scottsdale is the safer city — total crime rate of 2,028 per 100k people vs 3,125 for Phoenix. US average: 2,119.
| Crime (per 100k) | Scottsdale | Phoenix | US average |
|---|---|---|---|
| Total crime | 2,028 | 3,125 | 2,119 |
| Murder | 0 | 8 | 5 |
| Robbery | 22 | 182 | 61 |
| Aggravated Assault | 96 | 545 | 256 |
| Violent Crime | 153 | 800 | 359 |
| Burglary | 182 | 317 | 229 |
| Larceny | 1,535 | 1,582 | 1,272 |
| Car Theft | 158 | 426 | 259 |
| Property Crime | 1,875 | 2,325 | 1,760 |
Lower = safer. Bar inside each cell scales relative to the highest crime rate in the table.
Source: FBI Uniform Crime Reporting (2024). All rates are per 100,000 people. City pages: Scottsdale crime, Phoenix crime. See also: safest cities in America.
Diversity
Phoenix is more racially diverse — lower HHI (closer to 0) means a more even mix across groups.
| Group | Scottsdale | Phoenix | United States |
|---|---|---|---|
| White | 77.1% | 40.6% | 57.4% |
| African American | 2.1% | 7.4% | 11.9% |
| American Indian | 0.5% | 1.4% | 0.5% |
| Asian | 4.9% | 4.0% | 5.9% |
| Hawaiian | 0.1% | 0.2% | 0.2% |
| Other | 0.6% | 0.4% | 0.6% |
| Two Or More | 4.0% | 4.0% | 4.3% |
| Hispanic | 10.6% | 42.0% | 19.3% |
Source: U.S. Census ACS 2020-2024. Lower HHI = more even racial mix. See also: most diverse cities in America.
SnackAbility — overall quality of life
Scottsdale scores higher overall — 9/10 vs 6/10. SnackAbility is our 1–10 quality-of-life score; the median U.S. city scores a 7.
SnackAbility is a HomeSnacks proprietary 1–10 score blending jobs, housing, education, commute, amenities, affordability, crime, and diversity. Median U.S. city ≈ 7. Data: Census, BLS, FBI. See also: best places to live in America.
Getting around: Scottsdale vs. Phoenix
How each city handles commuting, transit, walkability, and car culture — the day-to-day reality that shapes where you'd actually want to live.
Both Scottsdale and Phoenix sit inside the sprawling Valley of the Sun, which means you will almost certainly own a car regardless of which city you choose. Phoenix has the stronger public-transit backbone: Valley Metro's light rail runs through Downtown, Midtown, and out toward Tempe and Mesa, and the bus network is genuinely usable for central-city commuters. Scottsdale, despite being the wealthier of the two, connects to the light rail only at its western edge near Old Town, and most of the city's 184 square miles is rail-free.
If you commute by car, expect the Loop 101 to be your constant companion in Scottsdale, while Phoenix commuters lean on the I-10, I-17, and SR-51. Traffic in both cities peaks hard during the October-through-April snowbird season. Biking is growing (the Indian Bend Wash Greenbelt gives Scottsdale a pleasant off-street corridor), but neither city is truly bike-commuter-friendly for most residents.
Jobs and careers in Scottsdale vs. Phoenix
The local job market, dominant industries, and which city to choose based on your career.
Scottsdale punches above its population weight on white-collar employment. Major employers include HonorHealth, the financial-services arms of Edward Jones and Voya Financial, and a growing cluster of fintech and cybersecurity firms that have set up regional headquarters along the Scottsdale Airpark corridor. That concentration of higher-paying work helps explain the median household income of $110,886, considerably above Phoenix's $81,332.
Phoenix offers far more sheer volume and sector diversity. Banner Health, Intel's Chandler-adjacent campuses, Amazon's fulfillment and tech operations, USAA, and a large state-government employment base all anchor the metro's job market. For early-career workers, Phoenix's lower cost of living (COL index 111 versus Scottsdale's 144) means a moderate starting salary stretches further.
If you're in finance, luxury hospitality, or healthcare leadership, Scottsdale's tighter job market often offers better pay; for tech, logistics, or public-sector careers, Phoenix's breadth is hard to match.
Weather and climate
What to expect day-to-day — sun, fog, heat, rain, and the seasonal extremes that shape the lifestyle.
Scottsdale and Phoenix share nearly identical climates in the Sonoran Desert: long, scorching summers and mild winters that attract seasonal residents from across the country. Summer highs regularly clear 110°F in both cities from June through early September. The monsoon season (roughly July through mid-September) brings dramatic afternoon thunderstorms that can briefly flood streets but also drop temperatures a few degrees.
The meaningful difference is subtle: Phoenix's denser urban core creates a stronger heat-island effect, so overnight lows in central Phoenix often run two to four degrees warmer than in north Scottsdale's lower-density desert neighborhoods. Winters in both cities are pleasant, with daytime highs in the mid-60s to low 70s from November through February, which is the primary reason the metro's population swells each fall. Neither city gets meaningful precipitation outside monsoon season.
Culture, nightlife, and entertainment
Food, music, neighborhoods, and the city vibe that gives each place its personality.
Scottsdale leans into a polished, resort-town identity. Old Town Scottsdale is the main cultural hub: galleries along Marshall Way, upscale restaurants on Scottsdale Road, and a dense nightlife strip that fills up on weekends year-round. The Scottsdale Museum of Contemporary Art and the annual Scottsdale Arts Festival give the city a genuine fine-arts presence, and Cactus League spring training (the San Francisco Giants play at Scottsdale Stadium) is a beloved local ritual every February and March.
Phoenix offers a rawer, more varied cultural scene. The Roosevelt Row arts district hosts First Fridays, one of the largest monthly art walks in the country, and the surrounding blocks have become a hub for independent restaurants, breweries, and live-music venues. The Phoenix Art Museum, Heard Museum (focused on Native American art), and Footprint Center (home of the Suns and Mercury) give Downtown Phoenix an urban cultural density that Scottsdale's resort corridors don't quite replicate.
Both cities have thriving dining scenes; Phoenix simply has more price-point variety.
Outdoor activities and day trips
Parks, beaches, hikes, and the weekend escapes that define life outside the city limits.
Scottsdale's most distinctive outdoor space is the McDowell Sonoran Preserve: more than 30,000 acres of protected desert inside city limits, with over 225 miles of hiking and mountain-biking trails. Pinnacle Peak and Tom's Thumb are local favorites for morning hikes before the heat sets in. Golf is practically a religion here, with TPC Scottsdale (host of the WM Phoenix Open) and dozens of resort courses available, though green fees reflect the city's cost of living.
Phoenix counters with South Mountain Park, one of the largest municipal parks in the country at roughly 16,000 acres, plus Camelback Mountain (shared with Scottsdale's border), Papago Park, and the Desert Botanical Garden. The Salt River runs along the metro's southern edge for tubing and kayaking. Day trips from either city are good: Sedona is about 90 minutes north, and the Grand Canyon's South Rim is under three hours.
For sheer trail mileage inside city limits, Scottsdale has the edge; for variety and accessibility across the full metro, Phoenix holds its own.
Bottom line: which city is right for you?
Based on the head-to-head data above, here's the short version — pick the city that lines up with what you actually care about.
Choose Scottsdale if you prioritize…
- lower crime — a safer place to live, work, and raise a family.
- more affordable housing relative to Phoenix.
- a higher overall SnackAbility quality-of-life score.
Choose Phoenix if you prioritize…
- a lower cost of living (cheaper groceries, services, and day-to-day expenses).
- a more racially diverse community (lower HHI on Census data).
Methodology: winners are picked from public data — U.S. Census Bureau ACS (income, home value, rent, race/HHI), FBI Uniform Crime Reporting (crime rates per 100k), and HomeSnacks' proprietary SnackAbility quality-of-life score, which blends Bureau of Labor Statistics data with the above.
More about Arizona

Best Places To Live In Arizona
Photo: Public domain
Cheapest Places To Live In Arizona
Photo: Public domain
Most Dangerous Cities In Arizona
Photo: Public domain
Best Places To Raise A Family In Arizona
Photo: Public domain
Best Places To Retire In Arizona
Photo: Public domain
Richest Cities In Arizona
Photo: Public domain
Safest Places In Arizona
Photo: Public domain
Worst Places To Live In Arizona
Photo: Public domain