Editor’s Note: This is not investment advice, and we are not financial advisers.
Suppose real estate is the most significant investment a majority of people make in their lifetime. In that case, it’s best to understand the places in Ohio with best potential return on investment.
After working in real estate adjacent roles for over a decade, I had the hypothesis that the best place to buy for a return on investment would be up-and-coming cities. Smaller cities where crime might be high now, but people still move to.
To test my hypothesis, we are going to look at places in Ohio that are growing faster than average, but where home prices are below average, and crime rates are higher than average.
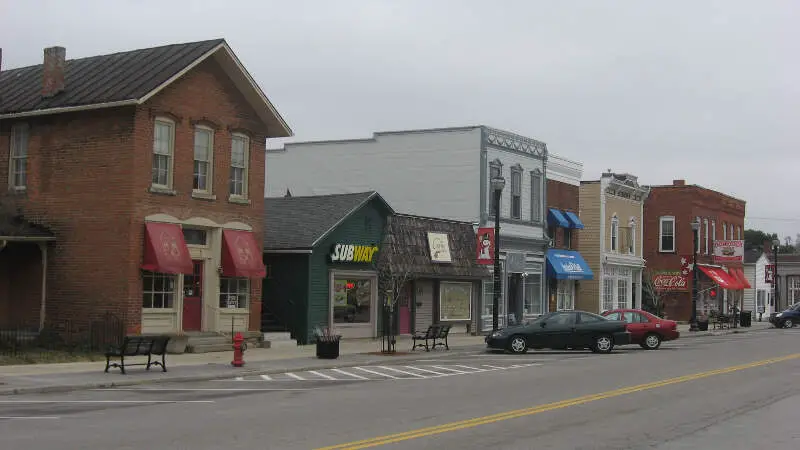
In everyday terms, these might be “deals”. The best deal in Ohio at the moment according to Saturday Night Science? That would be St. Clairsville.
-0.8% population growth · -2.7% home price growth
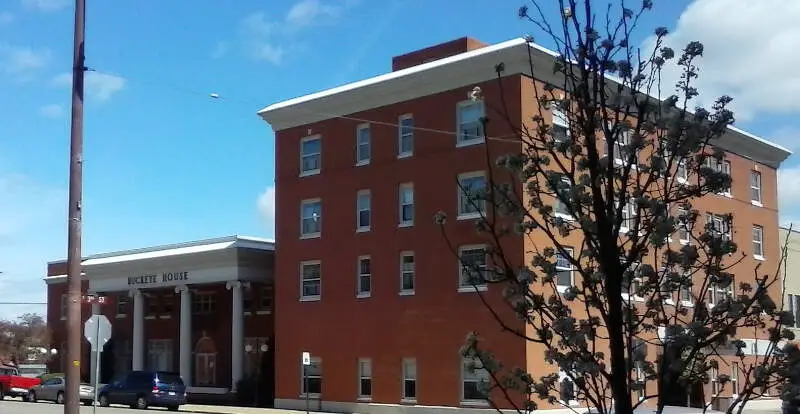
St. Clairsville is a city in and the county seat of Belmont County, Ohio, United States. Nicknamed “Paradise on the Hilltop”, it is part of the Wheeling, WV-OH Metropolitan Statistical Area. The population was 5,184 at the 2010 census.
Data | Crime | Cost of living | Movers
0.1% population growth · -0.2% home price growth
Chardon is a city in and the county seat of Geauga County, Ohio, United States. The population was 5,148 at the 2010 census. It is the only incorporated city in Geauga County, and includes land that was once part of Chardon, Hambden and Munson townships. It is located about 10 miles south of Lake Erie and within the “snow belt” of the Great Lakes.
Data | Crime | Cost of living | Movers
-0.6% population growth · -1.3% home price growth
Uhrichsville is a city in Tuscarawas County, Ohio, United States. The population was 5,413 at the 2010 census. Claymont City School District is the major education provider for the city of Uhrichsville and for the village of Dennison, Ohio. The Twin cities is a nickname used to describe Uhrichsville and Dennison because they are adjacent and similar.
Data | Crime | Cost of living | Movers
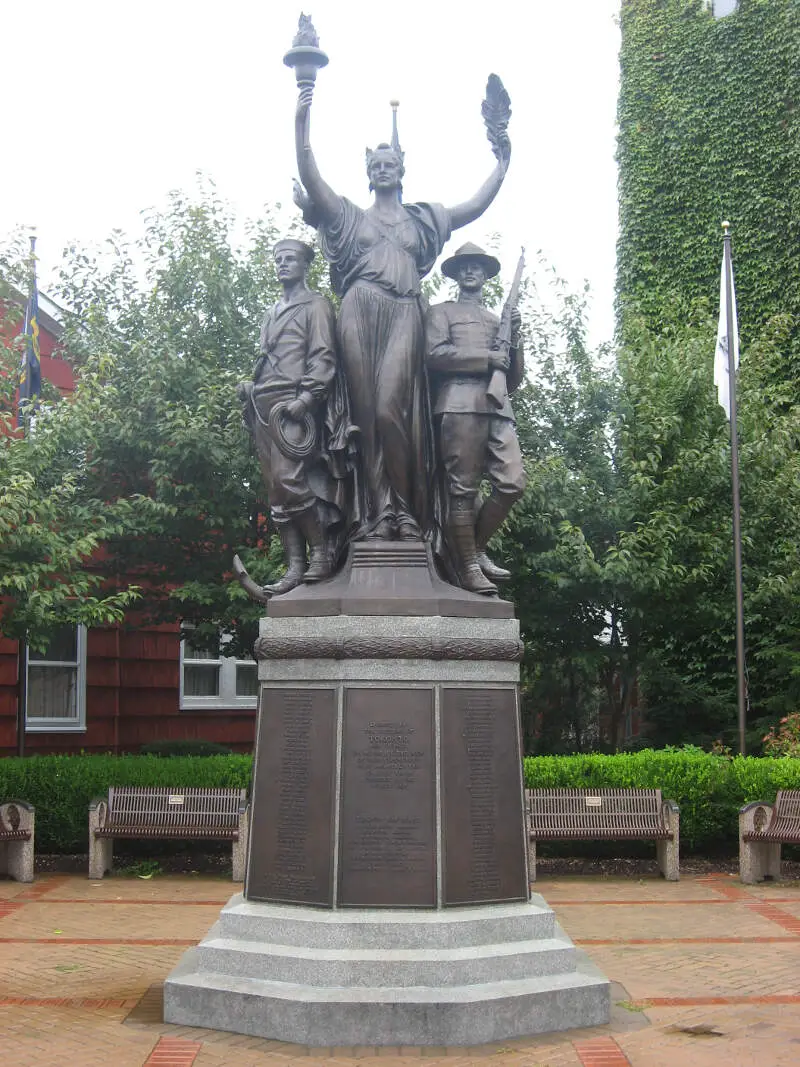
-2.9% population growth · 1.2% home price growth
Toronto is the second-largest city in Jefferson County, Ohio, United States, along the Ohio River. The population was 5,091 at the 2010 census. It is part of the Weirton-Steubenville, WV-OH Metropolitan Statistical Area.
Data | Crime | Cost of living | Movers
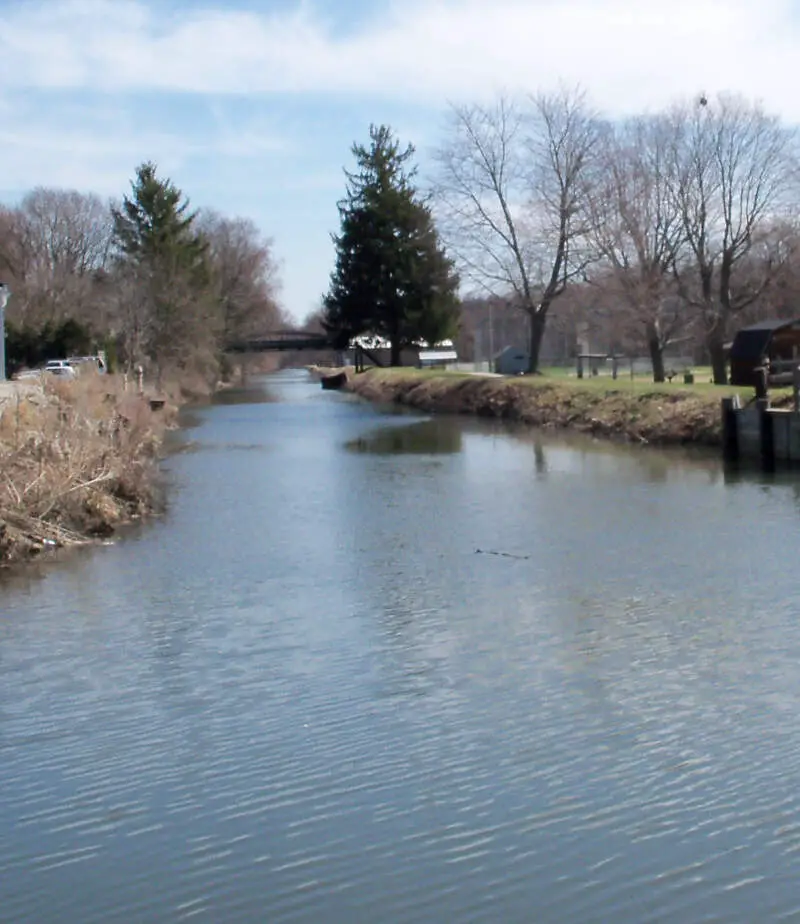
0.2% population growth · -0.0% home price growth
Canal Fulton is a city in Stark County in the U.S. state of Ohio. The population was 5,479 at the 2010 census. It is part of the Canton-Massillon, OH Metropolitan Statistical Area but serves equally as a suburb of Akron.
Data | Crime | Cost of living | Movers
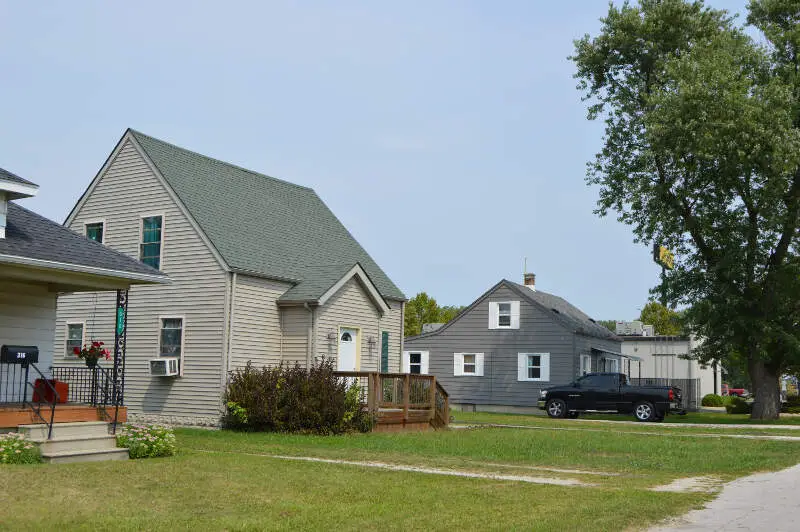
-0.0% population growth · 0.9% home price growth
Northwood is a city and eastern suburb in Wood County, Ohio, United States, within the Toledo metropolitan area. The population was 5,265 at the 2010 census.
Data | Crime | Cost of living | Movers
0.3% population growth · 1.2% home price growth
Waterville is a city in Lucas County, Ohio, United States, along the Maumee River, a suburb of Toledo. The population was 5,523 at the 2010 census.
Data | Crime | Cost of living | Movers
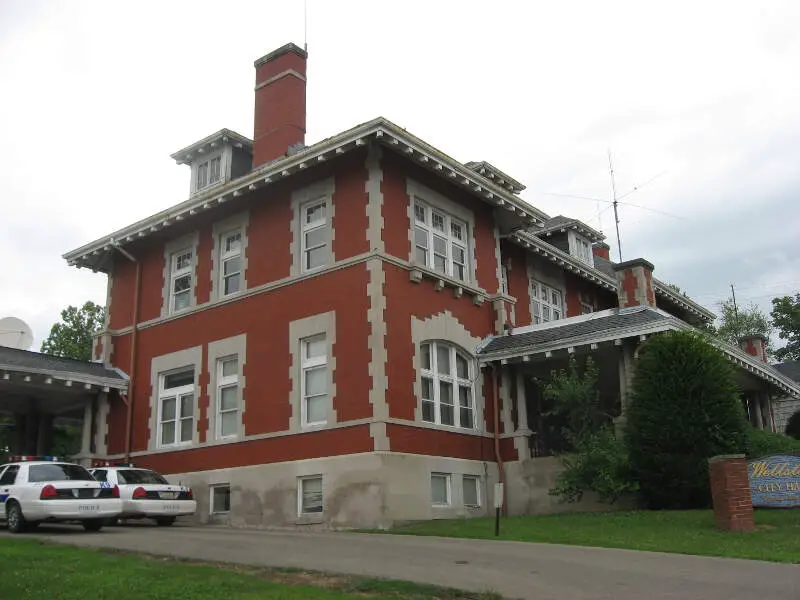
0.5% population growth · 3.9% home price growth
Wellston is a city in Jackson County, Ohio, United States, in the southeastern part of the state. The population was 5,663 at the 2010 census.
Data | Crime | Cost of living | Movers
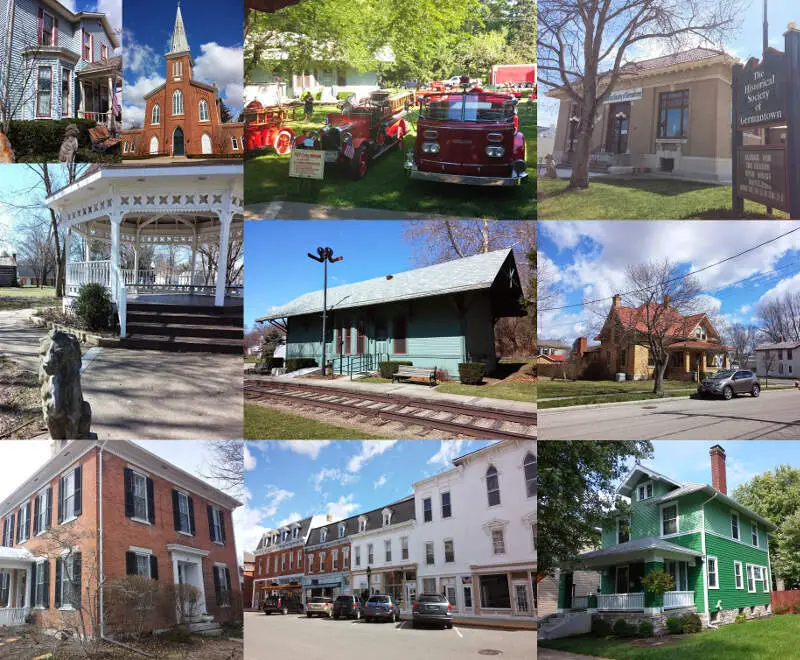
0.5% population growth · 1.4% home price growth
Germantown is a city in Montgomery County, Ohio, United States. The population was 5,547 at the 2010 census. It is part of the Dayton Metropolitan Statistical Area.
Data | Crime | Cost of living | Movers
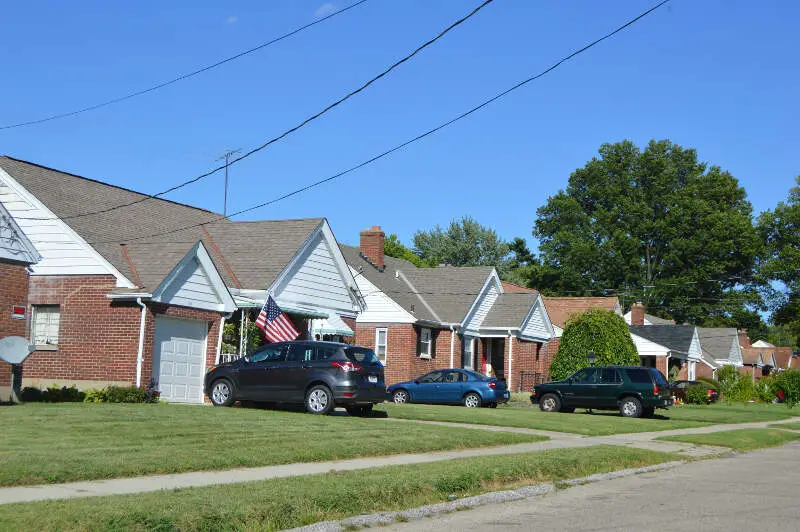
0.1% population growth · 1.8% home price growth
Deer Park is a city in Hamilton County, Ohio, United States. The population was 5,736 at the 2010 census.
Data | Crime | Cost of living | Movers
The receipts
Compare the top ten
Pick a metric. The bars rescale. The red line is Ohio’s statewide median.
Ohio statewide median: $242,141
On the map
Where Ohio’s best buys are
Saturday Night Science
Methodology: How do you determine the best places to buy a home in Ohio for 2026?
We were in real estate for almost five years and have worked on this site for over a decade. Suffice it to say we’ve put a lot of thought into finding an excellent place to buy a home.
So all that thinking has come to this moment where we get to spell out how we’d approach finding an up-and-coming place to live in Ohio. Put differently, the analysis will try to find places in Ohio with undervalued homes relative to pent-up demand using Saturday Night Science.
To do that, we looked at the most recent American Community Survey Census data for 2020-2024 and compared it to the previous vintage. Specifically, we used the following criteria:
- Y-o-Y Change In Population (People want to live here)
- Y-o-Y Change In Median Home Prices (People are willing to pay for it)
- Home Prices Relative To The State Average (It’s still kinda cheap)
We want places that are growing, have seen home prices increase in recent years, and are still “cheap” for Ohio, with these caveats: home prices had to be within 20% of the state average, home prices increased in the last year, and the city had above 5,000 people.
So of the 1203 cities and towns in Ohio, only 248 places made it through our initial filters to even be considered.
We then ranked each place from 1 to 248 for the above criteria, with 1 being the best. We averaged the rankings to create a “best place to buy” index, with the place having the lowest index being the best.
Turns out that St. Clairsville is the best potential gem in the not-so-rough in the Buckeye State. The median Ohio home is 55 years old — old enough that it pays to compare home warranty plans before something expensive breaks.
The full plate
Best Places To Buy A Home In Ohio
Click any column to sort. Search by city name.
| Rank | City | Population | Median Home Price | Population Change | Home Price Increase |
|---|---|---|---|---|---|
| 1 | St. Clairsville | 5,003 | $203,091 | -0.8% | -2.7% |
| 2 | Chardon | 5,249 | $363,602 | 0.1% | -0.2% |
| 3 | Uhrichsville | 5,189 | $138,742 | -0.6% | -1.3% |
| 4 | Toronto | 5,293 | $133,234 | -2.9% | 1.2% |
| 5 | Canal Fulton | 5,337 | $262,126 | 0.2% | -0.0% |
| 6 | Northwood | 5,193 | $177,941 | -0.0% | 0.9% |
| 7 | Waterville | 6,017 | $340,488 | 0.3% | 1.2% |
| 8 | Wellston | 5,452 | $117,953 | 0.5% | 3.9% |
| 9 | Germantown | 5,825 | $265,382 | 0.5% | 1.4% |
| 10 | Deer Park | 5,384 | $259,931 | 0.1% | 1.8% |
| 11 | New Carlisle | 5,544 | $251,584 | -0.1% | 2.1% |
| 12 | Groveport | 5,900 | $311,011 | -0.3% | 0.2% |
| 13 | The Village of Indian Hill | 6,052 | $1,625,644 | 0.1% | 1.1% |
| 14 | Granville | 5,999 | $507,108 | 1.4% | 0.6% |
| 15 | South Lebanon | 6,712 | $386,045 | 2.4% | -1.8% |
| 16 | Geneva | 5,886 | $203,227 | -0.4% | 0.6% |
| 17 | Grafton | 5,657 | $307,182 | -0.1% | -0.6% |
| 18 | Willard | 6,164 | $162,170 | -0.2% | -0.5% |
| 19 | Ontario | 6,667 | $235,343 | 0.3% | 1.6% |
| 20 | Clyde | 6,331 | $188,838 | 0.1% | -2.5% |
| 21 | Port Clinton | 5,970 | $272,320 | -0.5% | -2.0% |
| 22 | Jackson | 6,231 | $171,306 | 0.1% | 0.9% |
| 23 | Brookville | 5,779 | $265,951 | -7.3% | 1.9% |
| 24 | Pepper Pike | 6,840 | $696,160 | 0.5% | 0.9% |
| 25 | Belpre | 6,654 | $185,228 | -0.2% | 2.6% |
| 26 | Rittman | 6,044 | $199,067 | 0.2% | -1.1% |
| 27 | Moraine | 6,536 | $160,288 | 0.5% | -2.1% |
| 28 | Columbiana | 6,903 | $244,161 | 1.5% | 0.6% |
| 29 | Hillsboro | 6,527 | $207,888 | -0.2% | -0.7% |
| 30 | Rossford | 6,323 | $193,165 | 0.1% | 0.7% |
| 31 | Martins Ferry | 6,140 | $96,618 | -0.8% | 5.2% |
| 32 | Upper Sandusky | 6,558 | $205,346 | -0.3% | 0.3% |
| 33 | Logan | 6,993 | $262,041 | -1.2% | 1.1% |
| 34 | Union | 7,037 | $208,332 | 1.5% | 3.9% |
| 35 | Kirtland | 6,911 | $404,639 | -0.0% | 0.3% |
| 36 | Cortland | 7,080 | $225,250 | -0.2% | -0.1% |
| 37 | Milford | 6,497 | $331,272 | -0.4% | 1.6% |
| 38 | Mount Healthy | 6,919 | $190,028 | -0.2% | -0.5% |
| 39 | Huron | 6,757 | $298,446 | -1.0% | 0.4% |
| 40 | Delphos | 7,143 | $195,169 | 1.1% | 1.1% |
| 41 | Independence | 7,534 | $354,545 | -0.1% | -0.1% |
| 42 | Canfield | 7,649 | $319,365 | -0.0% | 0.1% |
| 43 | Wauseon | 7,505 | $223,917 | 1.6% | -1.4% |
| 44 | Bellbrook | 7,394 | $317,414 | 0.7% | 1.0% |
| 45 | Mentor-on-the-Lake | 7,111 | $212,494 | -0.1% | 2.9% |
| 46 | Hubbard | 7,598 | $164,705 | -0.0% | 0.5% |
| 47 | Fairlawn | 7,711 | $309,743 | 0.3% | 2.9% |
| 48 | Campbell | 7,784 | $106,436 | -0.4% | 1.3% |
| 49 | Bellevue | 8,187 | $184,462 | -0.2% | 1.1% |
| 50 | Eaton | 8,339 | $245,408 | -0.2% | 0.6% |
| 51 | St. Marys | 8,301 | $204,181 | -0.2% | 2.5% |
| 52 | Cheviot | 8,660 | $182,475 | 0.1% | 1.8% |
| 53 | Bryan | 8,631 | $190,323 | -0.4% | 0.6% |
| 54 | Oberlin | 8,329 | $238,965 | 3.4% | 2.6% |
| 55 | Grandview Heights | 8,647 | $554,974 | 2.7% | 0.8% |
| 56 | Orrville | 8,343 | $235,321 | -0.2% | -1.5% |
| 57 | Shelby | 8,865 | $184,566 | 1.8% | 2.6% |
| 58 | Napoleon | 8,802 | $209,535 | 2.8% | 1.4% |
| 59 | Highland Heights | 8,623 | $418,478 | 0.0% | 1.1% |
| 60 | Kenton | 7,663 | $174,694 | 0.7% | 0.4% |
| 61 | Wyoming | 8,723 | $483,221 | 0.1% | -0.2% |
| 62 | Olmsted Falls | 8,639 | $297,060 | -0.0% | -0.5% |
| 63 | Oakwood | 9,458 | $396,573 | -0.2% | 1.0% |
| 64 | Sheffield Lake | 8,966 | $203,339 | 0.2% | 0.6% |
| 65 | Canal Winchester | 10,170 | $415,360 | 5.3% | 1.0% |
| 66 | Madeira | 9,484 | $531,046 | 0.3% | 1.8% |
| 67 | Girard | 9,505 | $144,397 | -0.2% | 1.8% |
| 68 | North College Hill | 9,555 | $173,602 | -0.1% | 14.9% |
| 69 | Louisville | 9,602 | $240,230 | 0.4% | 0.3% |
| 70 | Willoughby Hills | 9,975 | $349,448 | -0.0% | -0.1% |
| 71 | Wapakoneta | 9,894 | $232,735 | 0.3% | 3.2% |
| 72 | Galion | 10,339 | $170,645 | -0.2% | 2.5% |
| 73 | Tipp City | 10,439 | $344,989 | 0.9% | 0.5% |
| 74 | Struthers | 9,923 | $132,301 | -0.7% | 1.5% |
| 75 | London | 10,484 | $280,969 | 0.8% | 2.3% |
| 76 | Reading | 10,502 | $231,958 | 0.1% | 0.8% |
| 77 | Richmond Heights | 10,626 | $239,479 | -0.5% | 1.2% |
| 78 | Cambridge | 10,060 | $167,595 | 0.1% | 1.6% |
| 79 | Celina | 10,903 | $234,400 | -1.0% | 2.7% |
| 80 | Bedford Heights | 10,847 | $190,891 | -0.3% | 0.8% |
| 81 | Van Wert | 10,790 | $179,630 | 0.7% | -0.6% |
| 82 | Vermilion | 10,343 | $260,645 | -1.0% | 1.5% |
| 83 | East Liverpool | 9,783 | $102,529 | -0.9% | -0.1% |
| 84 | Ironton | 10,768 | $119,423 | 1.7% | 2.5% |
| 85 | Brooklyn | 11,158 | $201,508 | -0.4% | 1.1% |
| 86 | Montgomery | 10,855 | $677,977 | 0.4% | 2.2% |
| 87 | Heath | 10,644 | $303,572 | 0.9% | 1.1% |
| 88 | Coshocton | 11,068 | $161,328 | 0.1% | 3.8% |
| 89 | New Albany | 10,896 | $632,192 | 3.5% | 3.9% |
| 90 | Springdale | 11,033 | $234,179 | 0.5% | -0.2% |
| 91 | Urbana | 11,204 | $201,188 | 0.5% | 0.4% |
| 92 | Ravenna | 11,274 | $215,181 | -0.1% | 0.6% |
| 93 | Seven Hills | 11,603 | $299,505 | -0.2% | 1.2% |
| 94 | Beachwood | 13,865 | $483,433 | 0.1% | 1.2% |
| 95 | Salem | 11,758 | $181,905 | -0.4% | -0.5% |
| 96 | Bucyrus | 11,594 | $158,594 | -0.2% | -0.8% |
| 97 | Franklin | 11,712 | $263,565 | 0.4% | 1.1% |
| 98 | Macedonia | 12,152 | $339,074 | 0.1% | 0.4% |
| 99 | Norton | 11,524 | $244,015 | -0.4% | 1.8% |
| 100 | Amherst | 12,906 | $274,430 | 0.9% | 0.1% |
Source: U.S. Census ACS 2020-2024 via Saturday Night Science. 248 Ohio cities cleared the filters.
Summary
Summary: The Best Places To Purchase A House In Ohio for 2026
There’s our analysis of the best places to buy a house in Ohio. And, to be clear, we aren’t necessarily saying these places are the best places to live, just that it looks like they might be in a couple of years based on the data.
In fact, every place in the following table meets our criteria, so even though it may not look super long, remember we started off with all 1203 places in the state.
The best cities to buy a house in Ohio are St. Clairsville, Chardon, Uhrichsville, Toronto, Canal Fulton, Northwood, Waterville, Wellston, Germantown, and Deer Park.
So if we could rent or buy in these cities, we’d definitely buy. Not sold on Ohio? Take the two-minute Find Your Place quiz and see which state actually fits you.
Questions and answers
Best Places To Buy A House In Ohio FAQs
What is the best city in Ohio to buy a house?
St. Clairsville is the best place to buy a house in Ohio for 2026. Its population is growing, home values are rising, and the median home still costs $203,091. Chardon and Uhrichsville are next on the list.
What are the best cities to buy a home in Ohio?
The best cities to buy a house in Ohio are St. Clairsville, Chardon, Uhrichsville, Toronto, Canal Fulton, Northwood, Waterville, Wellston, Germantown, and Deer Park. Only 248 of the 1203 places in Ohio cleared our filters on growth and home prices.
How much does a house cost in St. Clairsville?
The median home value in St. Clairsville is $203,091, versus $242,141 across Ohio. Across the full top ten, the median home runs $231,511.
How do you pick the best places to buy a home in Ohio?
We look for Ohio places where the population is growing, home prices are climbing, and homes are still cheap relative to the state average, using Census American Community Survey data. Cities that hit all three get the highest Buy Index scores.
Is this a guarantee home values will go up?
No. This is not investment advice — just where the data points to potential value. The Buy Index says these markets look healthier than most of Ohio, not that any single house is a good deal.