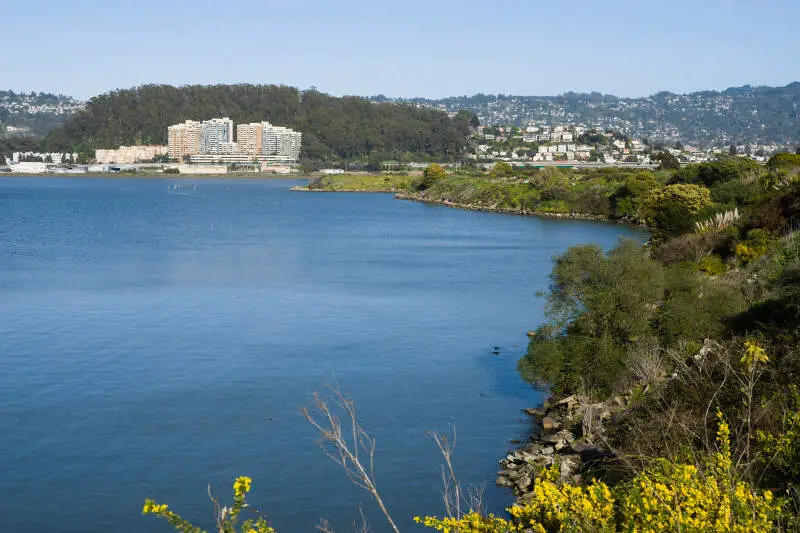
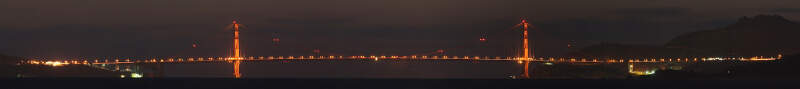
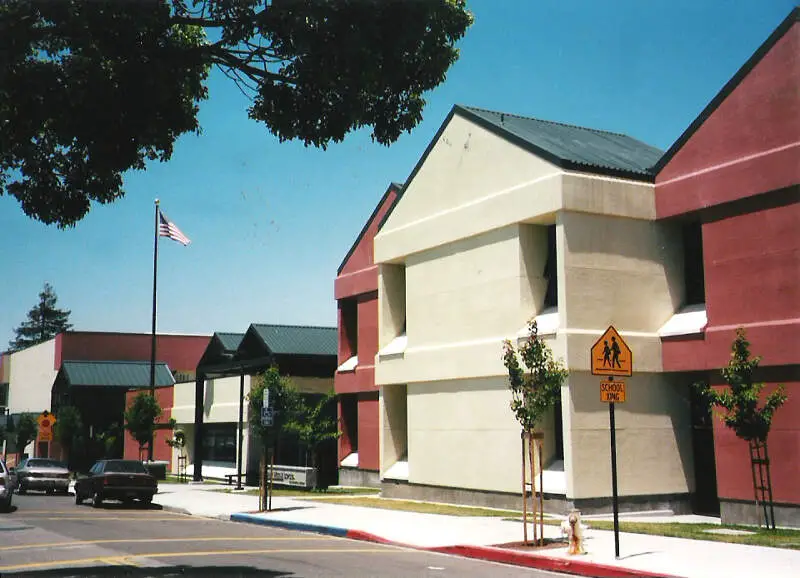
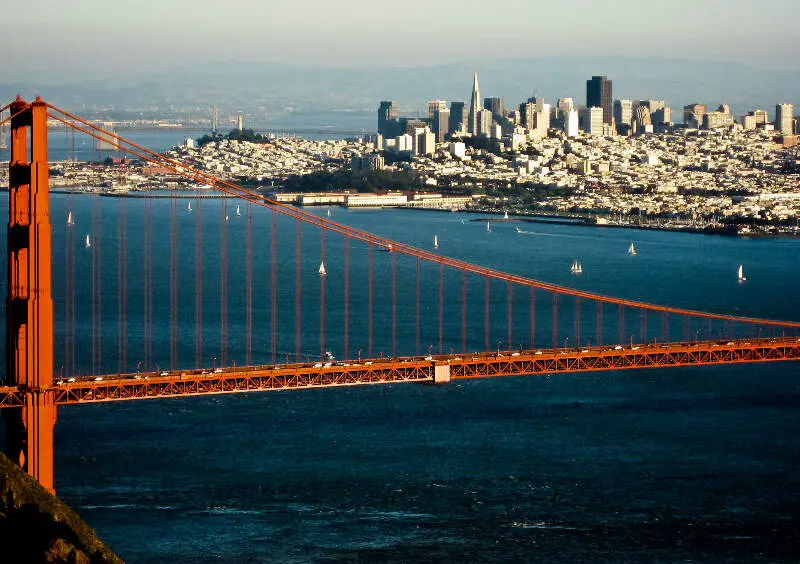
Albany, CA
Demographics And Statistics
Living In Albany, California Summary
Life in Albany research summary. HomeSnacks has been using Saturday Night Science to research the quality of life in Albany over the past nine years using Census, FBI, Zillow, and other primary data sources. Based on the most recently available data, we found the following about life in Albany:
The population in Albany is 19,768.
The median home value in Albany is $1,171,851.
The median income in Albany is $135,927.
The cost of living in Albany is 207 which is 2.1x higher than the national average.
The median rent in Albany is $2,389.
The unemployment rate in Albany is 3.4%.
The poverty rate in Albany is 8.2%.
The average high in Albany is 67.8° and the average low is 49.9°.
Albany SnackAbility
Overall SnackAbility
Albany, CA Crime Report
Crime in Albany summary. We use data from the FBI to determine the crime rates in Albany. Key points include:
There were 493 total crimes in Albany in the last reporting year.
The overall crime rate per 100,000 people in Albany is 2,631.4 / 100k people.
The violent crime rate per 100,000 people in Albany is 138.8 / 100k people.
The property crime rate per 100,000 people in Albany is 2,492.7 / 100k people.
Overall, crime in Albany is 24.17% above the national average.
Total Crimes
Above National Average
Crime In Albany Comparison Table
| Statistic | Count Raw |
Albany / 100k People |
California / 100k People |
National / 100k People |
|---|---|---|---|---|
| Total Crimes Per 100K | 493 | 2,631.4 | 2,564.5 | 2,119.2 |
| Violent Crime | 26 | 138.8 | 486.0 | 359.0 |
| Murder | 0 | 0.0 | 4.5 | 5.0 |
| Robbery | 10 | 53.4 | 119.1 | 61.0 |
| Aggravated Assault | 14 | 74.7 | 325.8 | 256.0 |
| Property Crime | 467 | 2,492.7 | 2,078.4 | 1,760.0 |
| Burglary | 56 | 298.9 | 305.8 | 229.0 |
| Larceny | 355 | 1,894.8 | 1,345.2 | 1,272.0 |
| Car Theft | 56 | 298.9 | 427.5 | 259.0 |
Albany, CA Cost Of Living
Cost of living in Albany summary. We use data on the cost of living to determine how expensive it is to live in Albany. Real estate prices drive most of the variance in cost of living around California. Key points include:
The cost of living in Albany is 207 with 100 being average.
The cost of living in Albany is 2.1x higher than the national average.
The median home value in Albany is $1,171,851.
The median income in Albany is $135,927.
Albany's Overall Cost Of Living
Higher Than The National Average
Cost Of Living In Albany Comparison Table
| Living Expense | Albany | California | National Average | |
|---|---|---|---|---|
| Overall | 207 | 141 | 100 | |
| Services | 116 | 110 | 100 | |
| Groceries | 119 | 112 | 100 | |
| Health | 123 | 110 | 100 | |
| Housing | 407 | 195 | 100 | |
| Transportation | 130 | 125 | 100 | |
| Utilities | 134 | 128 | 100 | |
Albany, CA Weather
The average high in Albany is 67.8° and the average low is 49.9°.
There are 42.8 days of precipitation each year.
Expect an average of 21.8 inches of precipitation each year with 0.0 inches of snow.
| Stat | Albany |
|---|---|
| Average Annual High | 67.8 |
| Average Annual Low | 49.9 |
| Annual Precipitation Days | 42.8 |
| Average Annual Precipitation | 21.8 |
| Average Annual Snowfall | 0.0 |
Average High
Days of Rain
Albany, CA Photos
Albany Articles

Rankings for Albany in California


Locations Around Albany
Map Of Albany, CA
Best Places Around Albany
Piedmont, CA
Population 11,012
San Lorenzo, CA
Population 29,453
San Bruno, CA
Population 42,612
Kensington, CA
Population 5,292
Lucas Valley-Marinwood, CA
Population 6,331
Fairfax, CA
Population 7,523
South San Francisco, CA
Population 64,487
Mountain View, CA
Population 82,363
Kentfield, CA
Population 7,128
Lafayette, CA
Population 25,277
Albany Demographics And Statistics
Population over time in Albany
The current population in Albany is 19,768. The population has increased 10.3% from 2010.
| Year | Population | % Change |
|---|---|---|
| 2023 | 19,768 | -1.3% |
| 2022 | 20,027 | 0.3% |
| 2021 | 19,958 | -0.9% |
| 2020 | 20,145 | 1.7% |
| 2019 | 19,804 | 0.2% |
| 2018 | 19,758 | 0.4% |
| 2017 | 19,682 | 1.3% |
| 2016 | 19,420 | 0.9% |
| 2015 | 19,249 | 1.2% |
| 2014 | 19,020 | 1.3% |
| 2013 | 18,769 | 1.5% |
| 2012 | 18,493 | 1.5% |
| 2011 | 18,217 | 1.7% |
| 2010 | 17,921 | - |
Race / Ethnicity in Albany
Albany is:
43.9% White with 8,688 White residents.
3.3% African American with 647 African American residents.
0.0% American Indian with 7 American Indian residents.
28.8% Asian with 5,690 Asian residents.
0.0% Hawaiian with 4 Hawaiian residents.
1.6% Other with 321 Other residents.
9.4% Two Or More with 1,849 Two Or More residents.
13.0% Hispanic with 2,562 Hispanic residents.
| Race | Albany | CA | USA |
|---|---|---|---|
| White | 43.9% | 34.6% | 58.2% |
| African American | 3.3% | 5.3% | 12.0% |
| American Indian | 0.0% | 0.3% | 0.5% |
| Asian | 28.8% | 15.1% | 5.7% |
| Hawaiian | 0.0% | 0.3% | 0.2% |
| Other | 1.6% | 0.5% | 0.5% |
| Two Or More | 9.4% | 4.1% | 3.9% |
| Hispanic | 13.0% | 39.8% | 19.0% |
Gender in Albany
Albany is 53.7% female with 10,608 female residents.
Albany is 46.3% male with 9,160 male residents.
| Gender | Albany | CA | USA |
|---|---|---|---|
| Female | 53.7% | 50.0% | 50.5% |
| Male | 46.3% | 50.0% | 49.5% |
Highest level of educational attainment in Albany for adults over 25
1.0% of adults in Albany completed < 9th grade.
1.0% of adults in Albany completed 9-12th grade.
9.0% of adults in Albany completed high school / ged.
8.0% of adults in Albany completed some college.
4.0% of adults in Albany completed associate's degree.
34.0% of adults in Albany completed bachelor's degree.
27.0% of adults in Albany completed master's degree.
5.0% of adults in Albany completed professional degree.
11.0% of adults in Albany completed doctorate degree.
| Education | Albany | CA | USA |
|---|---|---|---|
| < 9th Grade | 1.0% | 8.0% | 5.0% |
| 9-12th Grade | 1.0% | 7.0% | 6.0% |
| High School / GED | 9.0% | 20.0% | 26.0% |
| Some College | 8.0% | 20.0% | 19.0% |
| Associate's Degree | 4.0% | 8.0% | 9.0% |
| Bachelor's Degree | 34.0% | 22.0% | 21.0% |
| Master's Degree | 27.0% | 10.0% | 10.0% |
| Professional Degree | 5.0% | 3.0% | 2.0% |
| Doctorate Degree | 11.0% | 2.0% | 2.0% |
Household Income For Albany, California
3.4% of households in Albany earn Less than $10,000.
1.4% of households in Albany earn $10,000 to $14,999.
3.5% of households in Albany earn $15,000 to $24,999.
2.6% of households in Albany earn $25,000 to $34,999.
5.4% of households in Albany earn $35,000 to $49,999.
10.4% of households in Albany earn $50,000 to $74,999.
10.0% of households in Albany earn $75,000 to $99,999.
16.8% of households in Albany earn $100,000 to $149,999.
12.4% of households in Albany earn $150,000 to $199,999.
34.0% of households in Albany earn $200,000 or more.
| Income | Albany | CA | USA |
|---|---|---|---|
| Less than $10,000 | 3.4% | 4.4% | 4.9% |
| $10,000 to $14,999 | 1.4% | 3.0% | 3.6% |
| $15,000 to $24,999 | 3.5% | 5.2% | 6.6% |
| $25,000 to $34,999 | 2.6% | 5.5% | 6.8% |
| $35,000 to $49,999 | 5.4% | 8.4% | 10.4% |
| $50,000 to $74,999 | 10.4% | 13.3% | 15.7% |
| $75,000 to $99,999 | 10.0% | 11.8% | 12.7% |
| $100,000 to $149,999 | 16.8% | 17.9% | 17.4% |
| $150,000 to $199,999 | 12.4% | 11.1% | 9.3% |
| $200,000 or more | 34.0% | 19.4% | 12.6% |


