Arcata, CA
Demographics And Statistics
Living In Arcata, California Summary
Life in Arcata research summary. HomeSnacks has been using Saturday Night Science to research the quality of life in Arcata over the past nine years using Census, FBI, Zillow, and other primary data sources. Based on the most recently available data, we found the following about life in Arcata:
The population in Arcata is 18,578.
The median home value in Arcata is $491,340.
The median income in Arcata is $48,731.
The cost of living in Arcata is 126 which is 1.3x higher than the national average.
The median rent in Arcata is $1,287.
The unemployment rate in Arcata is 13.2%.
The poverty rate in Arcata is 29.6%.
The average high in Arcata is 64.7° and the average low is 44.7°.
Arcata SnackAbility
Overall SnackAbility
Arcata, CA Crime Report
Crime in Arcata summary. We use data from the FBI to determine the crime rates in Arcata. Key points include:
There were 434 total crimes in Arcata in the last reporting year.
The overall crime rate per 100,000 people in Arcata is 2,271.4 / 100k people.
The violent crime rate per 100,000 people in Arcata is 507.7 / 100k people.
The property crime rate per 100,000 people in Arcata is 1,763.8 / 100k people.
Overall, crime in Arcata is 7.18% above the national average.
Total Crimes
Above National Average
Crime In Arcata Comparison Table
| Statistic | Count Raw |
Arcata / 100k People |
California / 100k People |
National / 100k People |
|---|---|---|---|---|
| Total Crimes Per 100K | 434 | 2,271.4 | 2,564.5 | 2,119.2 |
| Violent Crime | 97 | 507.7 | 486.0 | 359.0 |
| Murder | 0 | 0.0 | 4.5 | 5.0 |
| Robbery | 23 | 120.4 | 119.1 | 61.0 |
| Aggravated Assault | 60 | 314.0 | 325.8 | 256.0 |
| Property Crime | 337 | 1,763.8 | 2,078.4 | 1,760.0 |
| Burglary | 37 | 193.6 | 305.8 | 229.0 |
| Larceny | 272 | 1,423.6 | 1,345.2 | 1,272.0 |
| Car Theft | 28 | 146.5 | 427.5 | 259.0 |
Arcata, CA Cost Of Living
Cost of living in Arcata summary. We use data on the cost of living to determine how expensive it is to live in Arcata. Real estate prices drive most of the variance in cost of living around California. Key points include:
The cost of living in Arcata is 126 with 100 being average.
The cost of living in Arcata is 1.3x higher than the national average.
The median home value in Arcata is $491,340.
The median income in Arcata is $48,731.
Arcata's Overall Cost Of Living
Higher Than The National Average
Cost Of Living In Arcata Comparison Table
| Living Expense | Arcata | California | National Average | |
|---|---|---|---|---|
| Overall | 126 | 141 | 100 | |
| Services | 110 | 110 | 100 | |
| Groceries | 109 | 112 | 100 | |
| Health | 111 | 110 | 100 | |
| Housing | 167 | 195 | 100 | |
| Transportation | 120 | 125 | 100 | |
| Utilities | 112 | 128 | 100 | |
Arcata, CA Weather
The average high in Arcata is 64.7° and the average low is 44.7°.
There are 80.2 days of precipitation each year.
Expect an average of 54.7 inches of precipitation each year with 3.0 inches of snow.
| Stat | Arcata |
|---|---|
| Average Annual High | 64.7 |
| Average Annual Low | 44.7 |
| Annual Precipitation Days | 80.2 |
| Average Annual Precipitation | 54.7 |
| Average Annual Snowfall | 3.0 |
Average High
Days of Rain
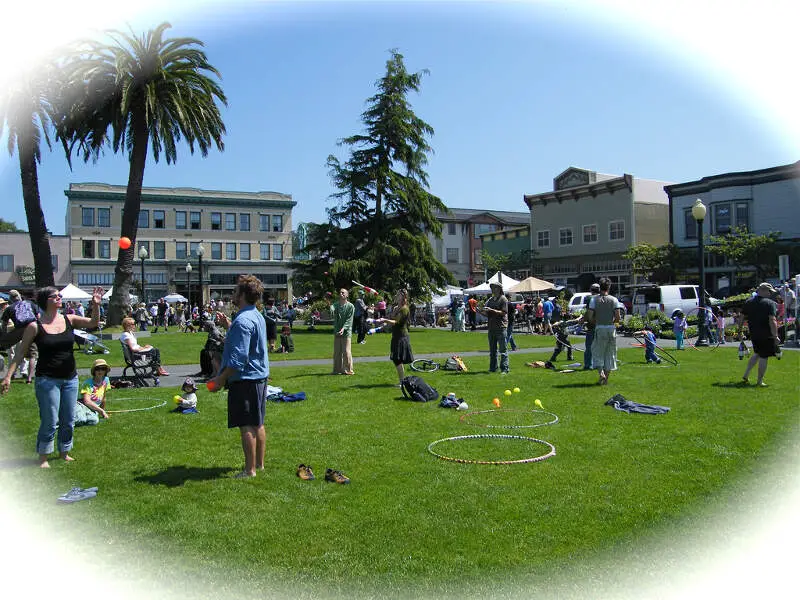
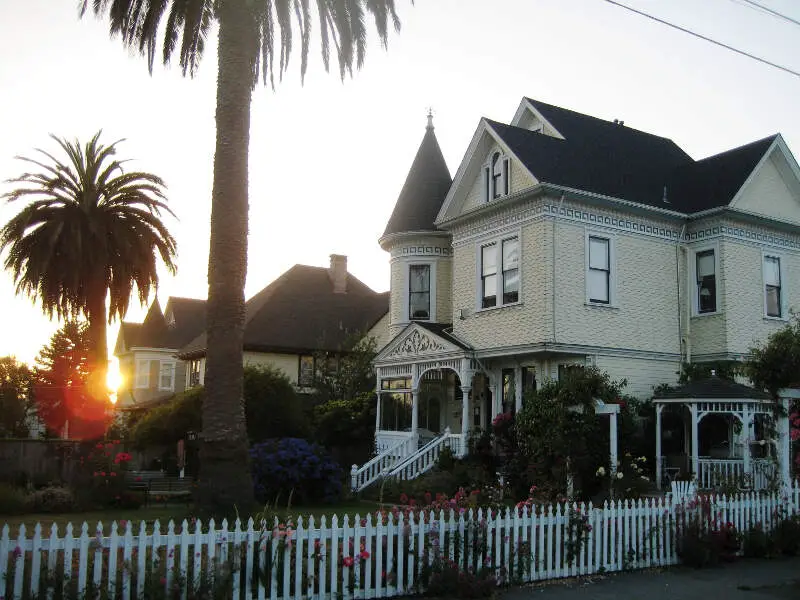
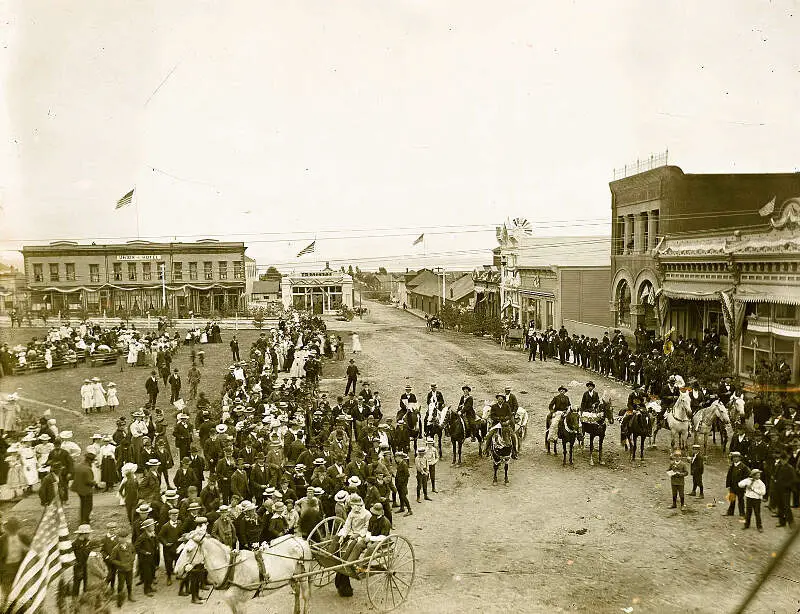
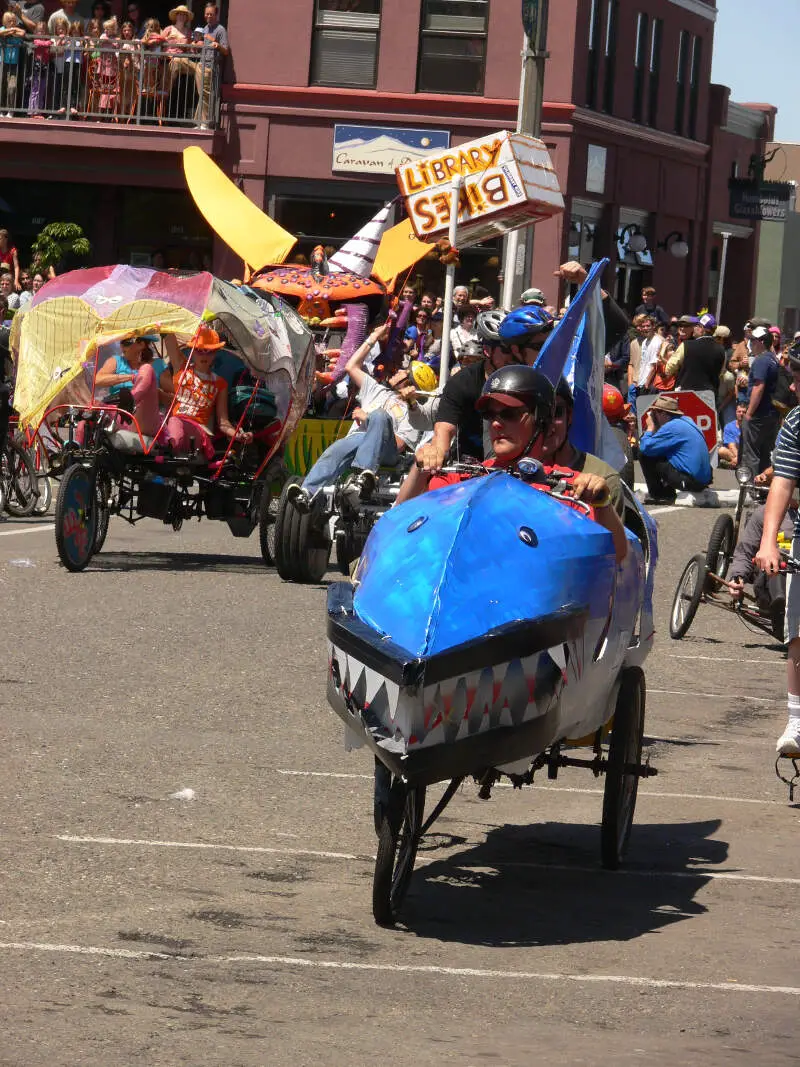
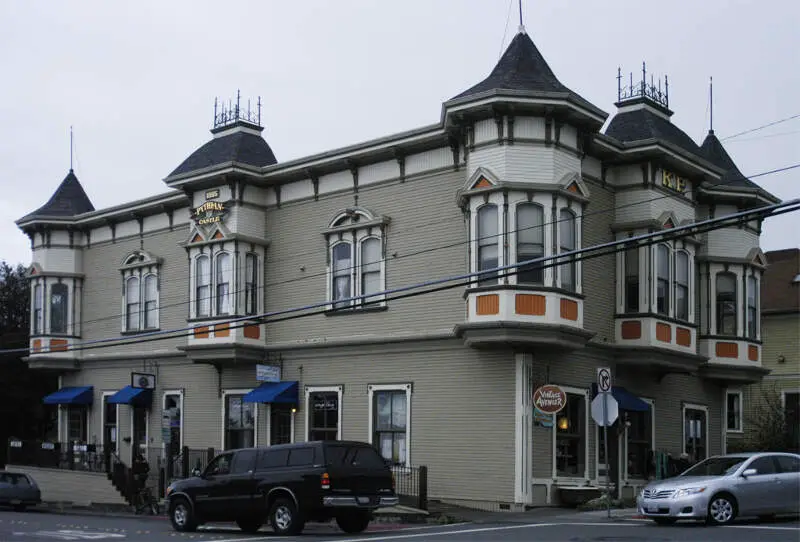
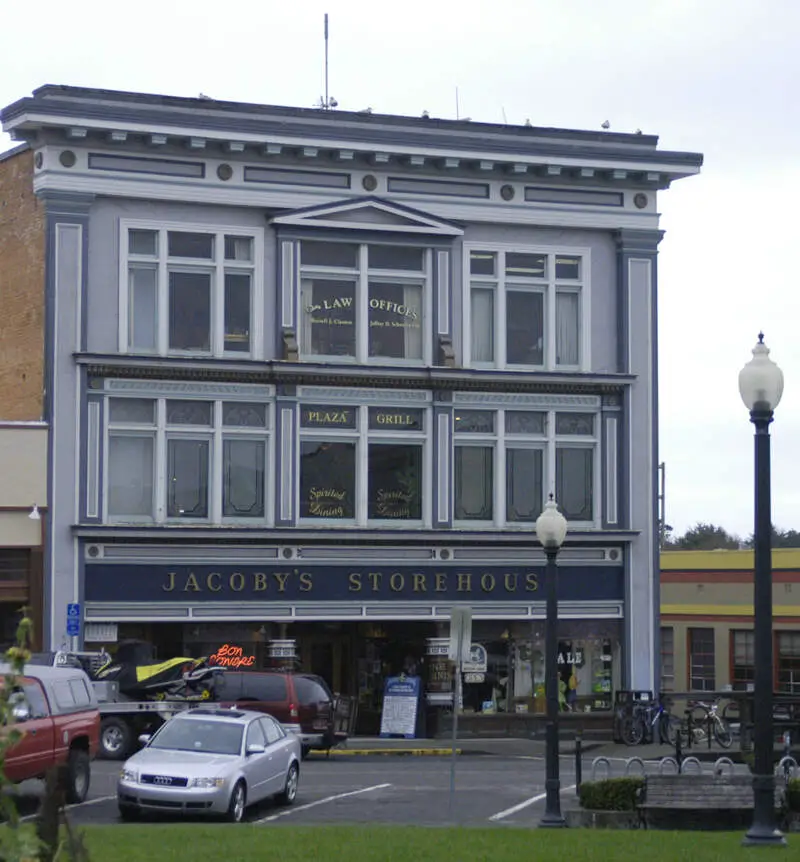
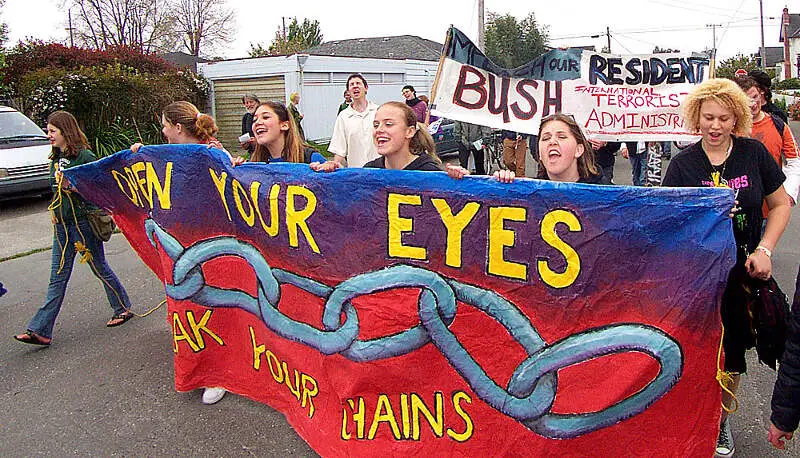
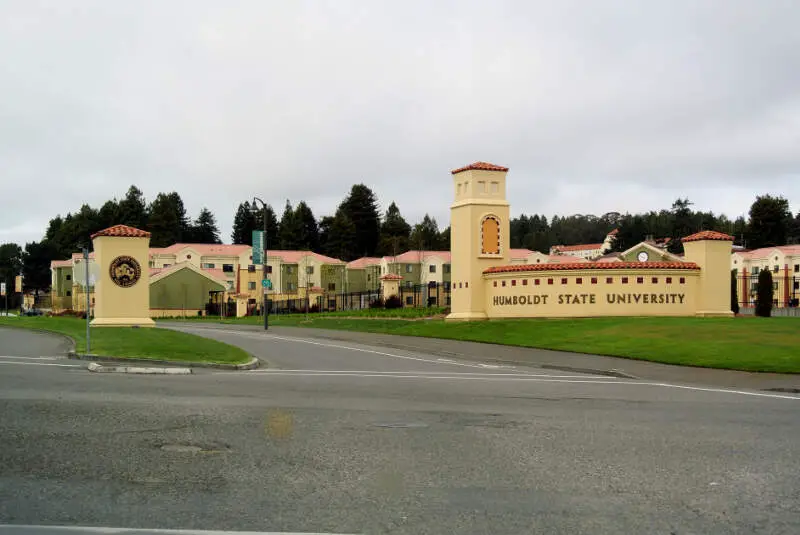
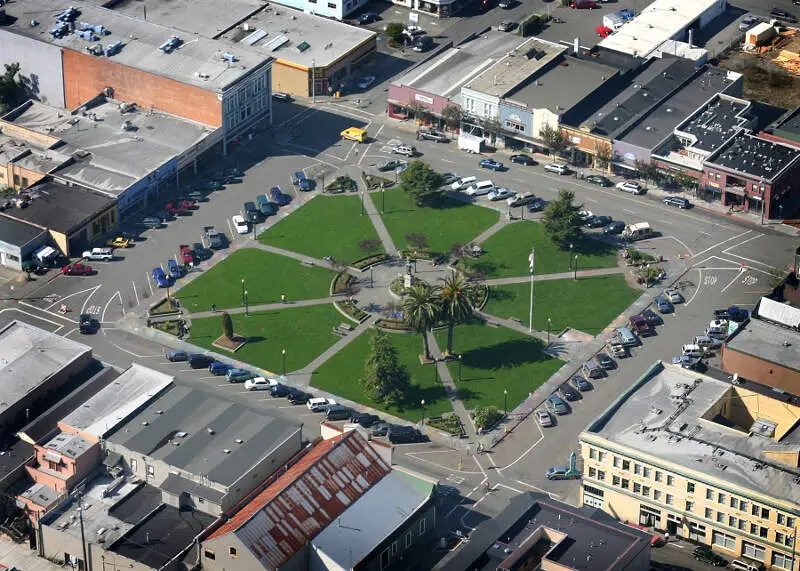
Arcata, CA Photos
Rankings for Arcata in California


Locations Around Arcata
Map Of Arcata, CA
Best Places Around Arcata
McKinleyville, CA
Population 17,152
Fortuna, CA
Population 12,413
Trinity, FL
Population 19,296
Eureka, CA
Population 26,302
Arcata Demographics And Statistics
Population over time in Arcata
The current population in Arcata is 18,578. The population has increased 8.6% from 2010.
| Year | Population | % Change |
|---|---|---|
| 2023 | 18,578 | 0.2% |
| 2022 | 18,536 | -2.6% |
| 2021 | 19,038 | 4.2% |
| 2020 | 18,266 | 0.5% |
| 2019 | 18,178 | 0.7% |
| 2018 | 18,050 | 1.3% |
| 2017 | 17,814 | 0.2% |
| 2016 | 17,775 | 0.1% |
| 2015 | 17,752 | 0.4% |
| 2014 | 17,679 | 0.7% |
| 2013 | 17,559 | 0.8% |
| 2012 | 17,421 | 1.8% |
| 2011 | 17,118 | 0.1% |
| 2010 | 17,100 | - |
Race / Ethnicity in Arcata
Arcata is:
70.9% White with 13,176 White residents.
2.1% African American with 386 African American residents.
0.6% American Indian with 109 American Indian residents.
2.2% Asian with 412 Asian residents.
0.5% Hawaiian with 84 Hawaiian residents.
1.5% Other with 279 Other residents.
6.8% Two Or More with 1,270 Two Or More residents.
15.4% Hispanic with 2,862 Hispanic residents.
| Race | Arcata | CA | USA |
|---|---|---|---|
| White | 70.9% | 34.6% | 58.2% |
| African American | 2.1% | 5.3% | 12.0% |
| American Indian | 0.6% | 0.3% | 0.5% |
| Asian | 2.2% | 15.1% | 5.7% |
| Hawaiian | 0.5% | 0.3% | 0.2% |
| Other | 1.5% | 0.5% | 0.5% |
| Two Or More | 6.8% | 4.1% | 3.9% |
| Hispanic | 15.4% | 39.8% | 19.0% |
Gender in Arcata
Arcata is 51.5% female with 9,560 female residents.
Arcata is 48.5% male with 9,018 male residents.
| Gender | Arcata | CA | USA |
|---|---|---|---|
| Female | 51.5% | 50.0% | 50.5% |
| Male | 48.5% | 50.0% | 49.5% |
Highest level of educational attainment in Arcata for adults over 25
2.0% of adults in Arcata completed < 9th grade.
4.0% of adults in Arcata completed 9-12th grade.
14.0% of adults in Arcata completed high school / ged.
25.0% of adults in Arcata completed some college.
10.0% of adults in Arcata completed associate's degree.
28.0% of adults in Arcata completed bachelor's degree.
12.0% of adults in Arcata completed master's degree.
3.0% of adults in Arcata completed professional degree.
2.0% of adults in Arcata completed doctorate degree.
| Education | Arcata | CA | USA |
|---|---|---|---|
| < 9th Grade | 2.0% | 8.0% | 5.0% |
| 9-12th Grade | 4.0% | 7.0% | 6.0% |
| High School / GED | 14.0% | 20.0% | 26.0% |
| Some College | 25.0% | 20.0% | 19.0% |
| Associate's Degree | 10.0% | 8.0% | 9.0% |
| Bachelor's Degree | 28.0% | 22.0% | 21.0% |
| Master's Degree | 12.0% | 10.0% | 10.0% |
| Professional Degree | 3.0% | 3.0% | 2.0% |
| Doctorate Degree | 2.0% | 2.0% | 2.0% |
Household Income For Arcata, California
10.8% of households in Arcata earn Less than $10,000.
5.6% of households in Arcata earn $10,000 to $14,999.
11.6% of households in Arcata earn $15,000 to $24,999.
11.5% of households in Arcata earn $25,000 to $34,999.
10.9% of households in Arcata earn $35,000 to $49,999.
15.3% of households in Arcata earn $50,000 to $74,999.
11.7% of households in Arcata earn $75,000 to $99,999.
11.7% of households in Arcata earn $100,000 to $149,999.
6.1% of households in Arcata earn $150,000 to $199,999.
4.8% of households in Arcata earn $200,000 or more.
| Income | Arcata | CA | USA |
|---|---|---|---|
| Less than $10,000 | 10.8% | 4.4% | 4.9% |
| $10,000 to $14,999 | 5.6% | 3.0% | 3.6% |
| $15,000 to $24,999 | 11.6% | 5.2% | 6.6% |
| $25,000 to $34,999 | 11.5% | 5.5% | 6.8% |
| $35,000 to $49,999 | 10.9% | 8.4% | 10.4% |
| $50,000 to $74,999 | 15.3% | 13.3% | 15.7% |
| $75,000 to $99,999 | 11.7% | 11.8% | 12.7% |
| $100,000 to $149,999 | 11.7% | 17.9% | 17.4% |
| $150,000 to $199,999 | 6.1% | 11.1% | 9.3% |
| $200,000 or more | 4.8% | 19.4% | 12.6% |


