Banning, CA
Demographics And Statistics
Living In Banning, California Summary
Life in Banning research summary. HomeSnacks has been using Saturday Night Science to research the quality of life in Banning over the past nine years using Census, FBI, Zillow, and other primary data sources. Based on the most recently available data, we found the following about life in Banning:
The population in Banning is 30,680.
The median home value in Banning is $409,433.
The median income in Banning is $57,699.
The cost of living in Banning is 115 which is 1.1x higher than the national average.
The median rent in Banning is $1,528.
The unemployment rate in Banning is 6.8%.
The poverty rate in Banning is 19.0%.
The average high in Banning is 81.2° and the average low is 52.0°.
Banning SnackAbility
Overall SnackAbility
Banning, CA Crime Report
Crime in Banning summary. We use data from the FBI to determine the crime rates in Banning. Key points include:
There were 450 total crimes in Banning in the last reporting year.
The overall crime rate per 100,000 people in Banning is 1,392.1 / 100k people.
The violent crime rate per 100,000 people in Banning is 467.1 / 100k people.
The property crime rate per 100,000 people in Banning is 925.0 / 100k people.
Overall, crime in Banning is -34.31% below the national average.
Total Crimes
Below National Average
Crime In Banning Comparison Table
| Statistic | Count Raw |
Banning / 100k People |
California / 100k People |
National / 100k People |
|---|---|---|---|---|
| Total Crimes Per 100K | 450 | 1,392.1 | 2,564.5 | 2,119.2 |
| Violent Crime | 151 | 467.1 | 486.0 | 359.0 |
| Murder | 5 | 15.5 | 4.5 | 5.0 |
| Robbery | 13 | 40.2 | 119.1 | 61.0 |
| Aggravated Assault | 122 | 377.4 | 325.8 | 256.0 |
| Property Crime | 299 | 925.0 | 2,078.4 | 1,760.0 |
| Burglary | 51 | 157.8 | 305.8 | 229.0 |
| Larceny | 180 | 556.8 | 1,345.2 | 1,272.0 |
| Car Theft | 68 | 210.4 | 427.5 | 259.0 |
Banning, CA Cost Of Living
Cost of living in Banning summary. We use data on the cost of living to determine how expensive it is to live in Banning. Real estate prices drive most of the variance in cost of living around California. Key points include:
The cost of living in Banning is 115 with 100 being average.
The cost of living in Banning is 1.1x higher than the national average.
The median home value in Banning is $409,433.
The median income in Banning is $57,699.
Banning's Overall Cost Of Living
Higher Than The National Average
Cost Of Living In Banning Comparison Table
| Living Expense | Banning | California | National Average | |
|---|---|---|---|---|
| Overall | 115 | 141 | 100 | |
| Services | 113 | 110 | 100 | |
| Groceries | 114 | 112 | 100 | |
| Health | 101 | 110 | 100 | |
| Housing | 124 | 195 | 100 | |
| Transportation | 124 | 125 | 100 | |
| Utilities | 92 | 128 | 100 | |
Banning, CA Weather
The average high in Banning is 81.2° and the average low is 52.0°.
There are 18.0 days of precipitation each year.
Expect an average of 10.0 inches of precipitation each year with 1.7 inches of snow.
| Stat | Banning |
|---|---|
| Average Annual High | 81.2 |
| Average Annual Low | 52.0 |
| Annual Precipitation Days | 18.0 |
| Average Annual Precipitation | 10.0 |
| Average Annual Snowfall | 1.7 |
Average High
Days of Rain
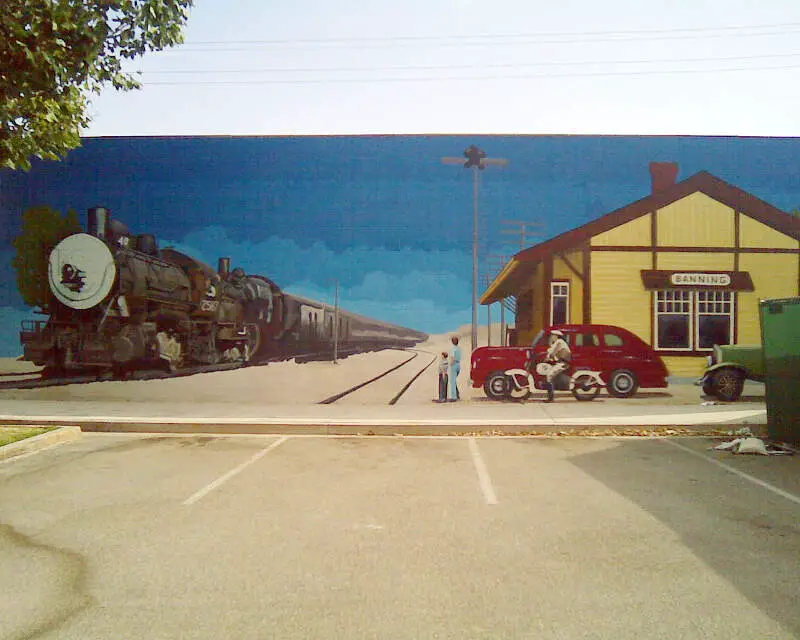
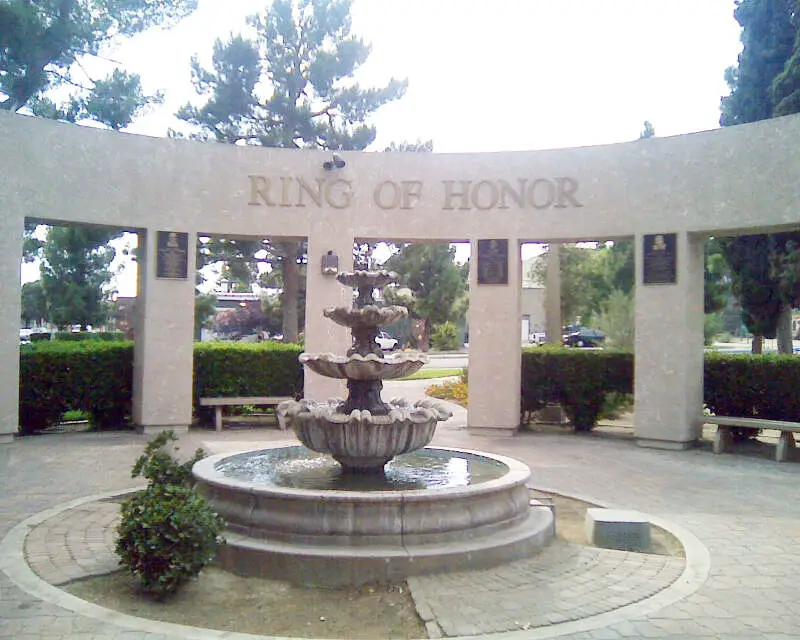
Banning, CA Photos
1 Reviews & Comments About Banning
/5

HomeSnacks User - 2018-07-14 04:47:24.527629
Not too much crime going on. The schools are okay and friendly people.
The good thing about Banning is the quietness and is quite nice if you like to relax or chill. The bad thing about Banning is that you have to go out of city to do some other fun stuff.
Rankings for Banning in California


Locations Around Banning
Map Of Banning, CA
Best Places Around Banning
Redlands, CA
Population 72,985
Highland, CA
Population 56,690
Yucaipa, CA
Population 54,348
Cherry Valley, CA
Population 7,302
Mentone, CA
Population 9,487
Nuevo, CA
Population 6,737
East Hemet, CA
Population 20,292
Moreno Valley, CA
Population 210,378
Beaumont, CA
Population 54,817
Valle Vista, CA
Population 19,263
Banning Demographics And Statistics
Population over time in Banning
The current population in Banning is 30,680. The population has increased 5.7% from 2010.
| Year | Population | % Change |
|---|---|---|
| 2023 | 30,680 | 2.5% |
| 2022 | 29,929 | 0.9% |
| 2021 | 29,664 | -2.0% |
| 2020 | 30,276 | -2.6% |
| 2019 | 31,072 | 0.4% |
| 2018 | 30,942 | 0.4% |
| 2017 | 30,824 | 0.6% |
| 2016 | 30,643 | 0.4% |
| 2015 | 30,515 | 0.8% |
| 2014 | 30,281 | 1.0% |
| 2013 | 29,968 | 1.0% |
| 2012 | 29,682 | 0.9% |
| 2011 | 29,414 | 1.3% |
| 2010 | 29,030 | - |
Race / Ethnicity in Banning
Banning is:
35.1% White with 10,778 White residents.
6.2% African American with 1,904 African American residents.
0.8% American Indian with 231 American Indian residents.
5.0% Asian with 1,534 Asian residents.
0.0% Hawaiian with 0 Hawaiian residents.
0.4% Other with 115 Other residents.
3.0% Two Or More with 921 Two Or More residents.
49.5% Hispanic with 15,197 Hispanic residents.
| Race | Banning | CA | USA |
|---|---|---|---|
| White | 35.1% | 34.6% | 58.2% |
| African American | 6.2% | 5.3% | 12.0% |
| American Indian | 0.8% | 0.3% | 0.5% |
| Asian | 5.0% | 15.1% | 5.7% |
| Hawaiian | 0.0% | 0.3% | 0.2% |
| Other | 0.4% | 0.5% | 0.5% |
| Two Or More | 3.0% | 4.1% | 3.9% |
| Hispanic | 49.5% | 39.8% | 19.0% |
Gender in Banning
Banning is 50.6% female with 15,532 female residents.
Banning is 49.4% male with 15,147 male residents.
| Gender | Banning | CA | USA |
|---|---|---|---|
| Female | 50.6% | 50.0% | 50.5% |
| Male | 49.4% | 50.0% | 49.5% |
Highest level of educational attainment in Banning for adults over 25
10.0% of adults in Banning completed < 9th grade.
9.0% of adults in Banning completed 9-12th grade.
29.0% of adults in Banning completed high school / ged.
26.0% of adults in Banning completed some college.
9.0% of adults in Banning completed associate's degree.
11.0% of adults in Banning completed bachelor's degree.
5.0% of adults in Banning completed master's degree.
1.0% of adults in Banning completed professional degree.
0.0% of adults in Banning completed doctorate degree.
| Education | Banning | CA | USA |
|---|---|---|---|
| < 9th Grade | 10.0% | 8.0% | 5.0% |
| 9-12th Grade | 9.0% | 7.0% | 6.0% |
| High School / GED | 29.0% | 20.0% | 26.0% |
| Some College | 26.0% | 20.0% | 19.0% |
| Associate's Degree | 9.0% | 8.0% | 9.0% |
| Bachelor's Degree | 11.0% | 22.0% | 21.0% |
| Master's Degree | 5.0% | 10.0% | 10.0% |
| Professional Degree | 1.0% | 3.0% | 2.0% |
| Doctorate Degree | 0.0% | 2.0% | 2.0% |
Household Income For Banning, California
5.4% of households in Banning earn Less than $10,000.
3.0% of households in Banning earn $10,000 to $14,999.
10.5% of households in Banning earn $15,000 to $24,999.
10.6% of households in Banning earn $25,000 to $34,999.
13.5% of households in Banning earn $35,000 to $49,999.
20.0% of households in Banning earn $50,000 to $74,999.
10.4% of households in Banning earn $75,000 to $99,999.
14.5% of households in Banning earn $100,000 to $149,999.
5.3% of households in Banning earn $150,000 to $199,999.
6.6% of households in Banning earn $200,000 or more.
| Income | Banning | CA | USA |
|---|---|---|---|
| Less than $10,000 | 5.4% | 4.4% | 4.9% |
| $10,000 to $14,999 | 3.0% | 3.0% | 3.6% |
| $15,000 to $24,999 | 10.5% | 5.2% | 6.6% |
| $25,000 to $34,999 | 10.6% | 5.5% | 6.8% |
| $35,000 to $49,999 | 13.5% | 8.4% | 10.4% |
| $50,000 to $74,999 | 20.0% | 13.3% | 15.7% |
| $75,000 to $99,999 | 10.4% | 11.8% | 12.7% |
| $100,000 to $149,999 | 14.5% | 17.9% | 17.4% |
| $150,000 to $199,999 | 5.3% | 11.1% | 9.3% |
| $200,000 or more | 6.6% | 19.4% | 12.6% |


