Fairfield, CA
Demographics And Statistics
Living In Fairfield, California Summary
Life in Fairfield research summary. HomeSnacks has been using Saturday Night Science to research the quality of life in Fairfield over the past nine years using Census, FBI, Zillow, and other primary data sources. Based on the most recently available data, we found the following about life in Fairfield:
The population in Fairfield is 119,985.
The median home value in Fairfield is $605,115.
The median income in Fairfield is $102,321.
The cost of living in Fairfield is 151 which is 1.5x higher than the national average.
The median rent in Fairfield is $2,191.
The unemployment rate in Fairfield is 5.3%.
The poverty rate in Fairfield is 10.5%.
The average high in Fairfield is 72.1° and the average low is 47.9°.
Fairfield SnackAbility
Overall SnackAbility
Fairfield, CA Crime Report
Crime in Fairfield summary. We use data from the FBI to determine the crime rates in Fairfield. Key points include:
There were 2,644 total crimes in Fairfield in the last reporting year.
The overall crime rate per 100,000 people in Fairfield is 2,183.6 / 100k people.
The violent crime rate per 100,000 people in Fairfield is 498.0 / 100k people.
The property crime rate per 100,000 people in Fairfield is 1,685.6 / 100k people.
Overall, crime in Fairfield is 3.04% above the national average.
Total Crimes
Above National Average
Crime In Fairfield Comparison Table
| Statistic | Count Raw |
Fairfield / 100k People |
California / 100k People |
National / 100k People |
|---|---|---|---|---|
| Total Crimes Per 100K | 2,644 | 2,183.6 | 2,564.5 | 2,119.2 |
| Violent Crime | 603 | 498.0 | 486.0 | 359.0 |
| Murder | 1 | 0.8 | 4.5 | 5.0 |
| Robbery | 142 | 117.3 | 119.1 | 61.0 |
| Aggravated Assault | 411 | 339.4 | 325.8 | 256.0 |
| Property Crime | 2,041 | 1,685.6 | 2,078.4 | 1,760.0 |
| Burglary | 259 | 213.9 | 305.8 | 229.0 |
| Larceny | 1,495 | 1,234.7 | 1,345.2 | 1,272.0 |
| Car Theft | 287 | 237.0 | 427.5 | 259.0 |
Fairfield, CA Cost Of Living
Cost of living in Fairfield summary. We use data on the cost of living to determine how expensive it is to live in Fairfield. Real estate prices drive most of the variance in cost of living around California. Key points include:
The cost of living in Fairfield is 151 with 100 being average.
The cost of living in Fairfield is 1.5x higher than the national average.
The median home value in Fairfield is $605,115.
The median income in Fairfield is $102,321.
Fairfield's Overall Cost Of Living
Higher Than The National Average
Cost Of Living In Fairfield Comparison Table
| Living Expense | Fairfield | California | National Average | |
|---|---|---|---|---|
| Overall | 151 | 141 | 100 | |
| Services | 113 | 110 | 100 | |
| Groceries | 118 | 112 | 100 | |
| Health | 121 | 110 | 100 | |
| Housing | 220 | 195 | 100 | |
| Transportation | 130 | 125 | 100 | |
| Utilities | 136 | 128 | 100 | |
Fairfield, CA Weather
The average high in Fairfield is 72.1° and the average low is 47.9°.
There are 40.3 days of precipitation each year.
Expect an average of 21.3 inches of precipitation each year with 0.1 inches of snow.
| Stat | Fairfield |
|---|---|
| Average Annual High | 72.1 |
| Average Annual Low | 47.9 |
| Annual Precipitation Days | 40.3 |
| Average Annual Precipitation | 21.3 |
| Average Annual Snowfall | 0.1 |
Average High
Days of Rain
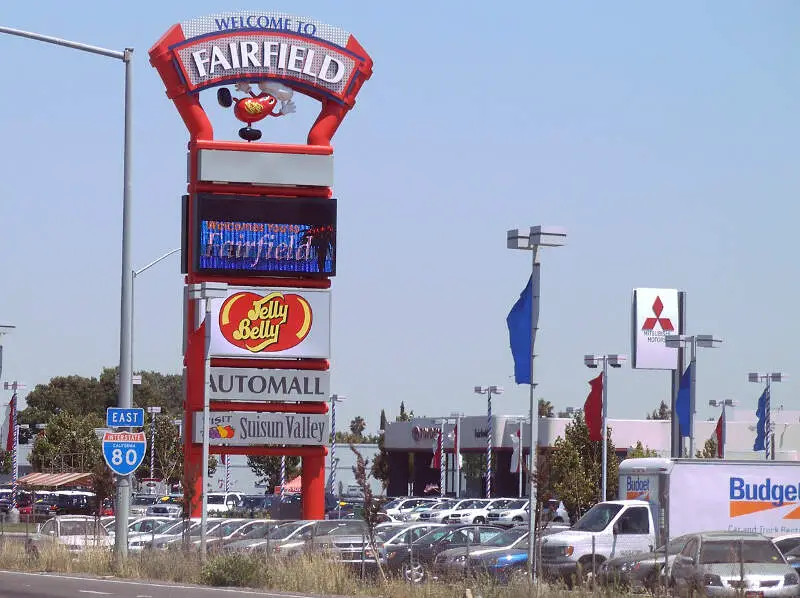
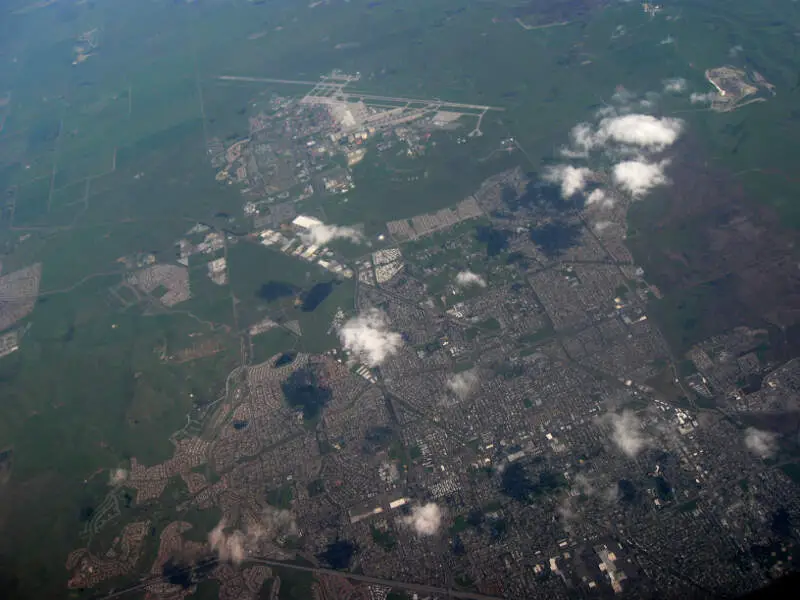
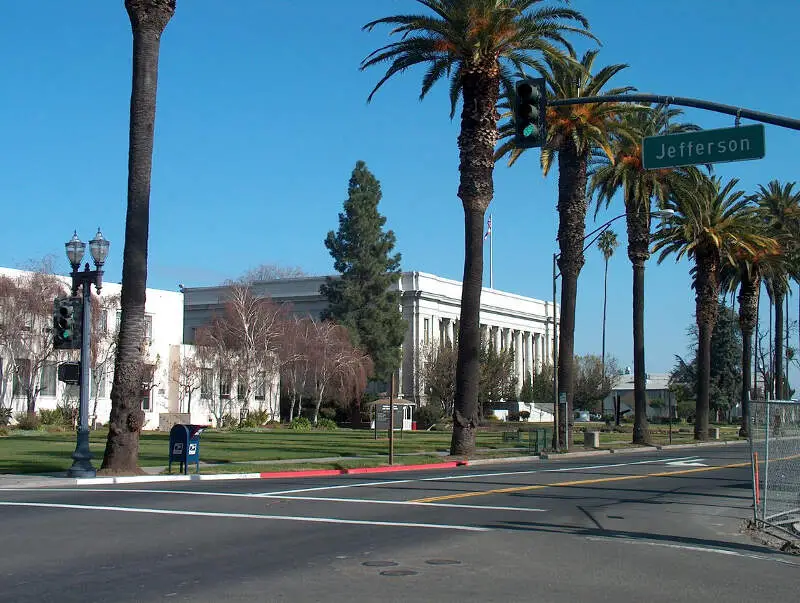
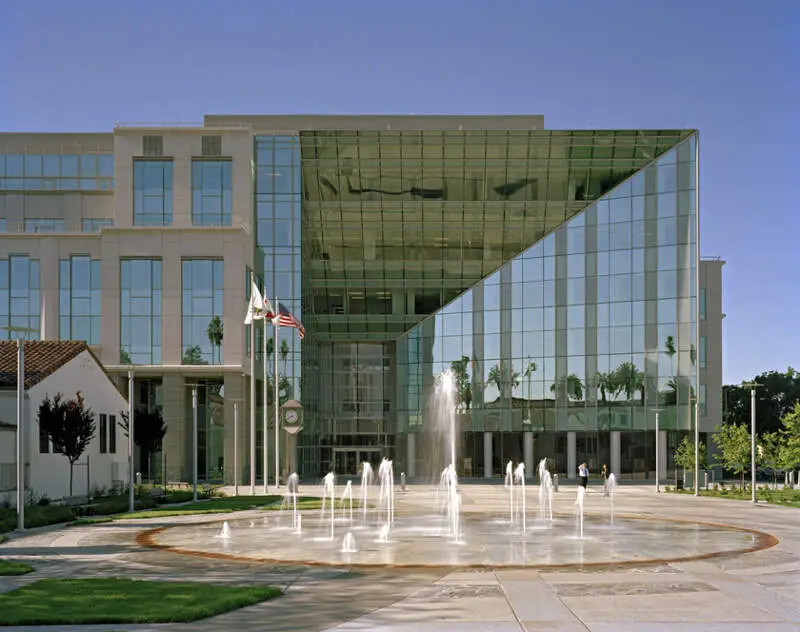
Fairfield, CA Photos

Rankings for Fairfield in California


Locations Around Fairfield
Map Of Fairfield, CA
Best Places Around Fairfield
Mountain View, CA
Population 82,363
American Canyon, CA
Population 21,698
Martinez, CA
Population 36,926
Winters, CA
Population 7,453
Napa, CA
Population 78,816
Vacaville, CA
Population 102,085
Dixon, CA
Population 19,158
Benicia, CA
Population 26,861
Rodeo, CA
Population 8,735
Concord, CA
Population 124,260
Fairfield Demographics And Statistics
Population over time in Fairfield
The current population in Fairfield is 119,985. The population has increased 15.7% from 2010.
| Year | Population | % Change |
|---|---|---|
| 2023 | 119,985 | 0.5% |
| 2022 | 119,420 | 0.4% |
| 2021 | 118,932 | 2.0% |
| 2020 | 116,544 | 1.1% |
| 2019 | 115,282 | 1.0% |
| 2018 | 114,101 | 1.2% |
| 2017 | 112,790 | 1.7% |
| 2016 | 110,953 | 1.4% |
| 2015 | 109,468 | 1.4% |
| 2014 | 107,983 | 1.4% |
| 2013 | 106,533 | 1.1% |
| 2012 | 105,407 | 1.0% |
| 2011 | 104,404 | 0.7% |
| 2010 | 103,698 | - |
Race / Ethnicity in Fairfield
Fairfield is:
27.6% White with 33,092 White residents.
15.0% African American with 17,988 African American residents.
0.2% American Indian with 277 American Indian residents.
17.2% Asian with 20,603 Asian residents.
1.1% Hawaiian with 1,306 Hawaiian residents.
0.7% Other with 810 Other residents.
6.5% Two Or More with 7,774 Two Or More residents.
31.8% Hispanic with 38,135 Hispanic residents.
| Race | Fairfield | CA | USA |
|---|---|---|---|
| White | 27.6% | 34.6% | 58.2% |
| African American | 15.0% | 5.3% | 12.0% |
| American Indian | 0.2% | 0.3% | 0.5% |
| Asian | 17.2% | 15.1% | 5.7% |
| Hawaiian | 1.1% | 0.3% | 0.2% |
| Other | 0.7% | 0.5% | 0.5% |
| Two Or More | 6.5% | 4.1% | 3.9% |
| Hispanic | 31.8% | 39.8% | 19.0% |
Gender in Fairfield
Fairfield is 50.5% female with 60,615 female residents.
Fairfield is 49.5% male with 59,369 male residents.
| Gender | Fairfield | CA | USA |
|---|---|---|---|
| Female | 50.5% | 50.0% | 50.5% |
| Male | 49.5% | 50.0% | 49.5% |
Highest level of educational attainment in Fairfield for adults over 25
6.0% of adults in Fairfield completed < 9th grade.
6.0% of adults in Fairfield completed 9-12th grade.
25.0% of adults in Fairfield completed high school / ged.
25.0% of adults in Fairfield completed some college.
11.0% of adults in Fairfield completed associate's degree.
18.0% of adults in Fairfield completed bachelor's degree.
6.0% of adults in Fairfield completed master's degree.
2.0% of adults in Fairfield completed professional degree.
1.0% of adults in Fairfield completed doctorate degree.
| Education | Fairfield | CA | USA |
|---|---|---|---|
| < 9th Grade | 6.0% | 8.0% | 5.0% |
| 9-12th Grade | 6.0% | 7.0% | 6.0% |
| High School / GED | 25.0% | 20.0% | 26.0% |
| Some College | 25.0% | 20.0% | 19.0% |
| Associate's Degree | 11.0% | 8.0% | 9.0% |
| Bachelor's Degree | 18.0% | 22.0% | 21.0% |
| Master's Degree | 6.0% | 10.0% | 10.0% |
| Professional Degree | 2.0% | 3.0% | 2.0% |
| Doctorate Degree | 1.0% | 2.0% | 2.0% |
Household Income For Fairfield, California
4.2% of households in Fairfield earn Less than $10,000.
2.0% of households in Fairfield earn $10,000 to $14,999.
2.8% of households in Fairfield earn $15,000 to $24,999.
5.8% of households in Fairfield earn $25,000 to $34,999.
7.1% of households in Fairfield earn $35,000 to $49,999.
14.2% of households in Fairfield earn $50,000 to $74,999.
12.9% of households in Fairfield earn $75,000 to $99,999.
21.6% of households in Fairfield earn $100,000 to $149,999.
12.3% of households in Fairfield earn $150,000 to $199,999.
17.0% of households in Fairfield earn $200,000 or more.
| Income | Fairfield | CA | USA |
|---|---|---|---|
| Less than $10,000 | 4.2% | 4.4% | 4.9% |
| $10,000 to $14,999 | 2.0% | 3.0% | 3.6% |
| $15,000 to $24,999 | 2.8% | 5.2% | 6.6% |
| $25,000 to $34,999 | 5.8% | 5.5% | 6.8% |
| $35,000 to $49,999 | 7.1% | 8.4% | 10.4% |
| $50,000 to $74,999 | 14.2% | 13.3% | 15.7% |
| $75,000 to $99,999 | 12.9% | 11.8% | 12.7% |
| $100,000 to $149,999 | 21.6% | 17.9% | 17.4% |
| $150,000 to $199,999 | 12.3% | 11.1% | 9.3% |
| $200,000 or more | 17.0% | 19.4% | 12.6% |


