Los Gatos, CA
Demographics And Statistics
Living In Los Gatos, California Summary
Life in Los Gatos research summary. HomeSnacks has been using Saturday Night Science to research the quality of life in Los Gatos over the past nine years using Census, FBI, Zillow, and other primary data sources. Based on the most recently available data, we found the following about life in Los Gatos:
The population in Los Gatos is 32,773.
The median home value in Los Gatos is $2,440,617.
The median income in Los Gatos is $207,891.
The cost of living in Los Gatos is 308 which is 3.1x higher than the national average.
The median rent in Los Gatos is $2,969.
The unemployment rate in Los Gatos is 4.3%.
The poverty rate in Los Gatos is 4.1%.
The average high in Los Gatos is 71.1° and the average low is 48.8°.
Los Gatos SnackAbility
Overall SnackAbility
Los Gatos, CA Crime Report
Crime in Los Gatos summary. We use data from the FBI to determine the crime rates in Los Gatos. Key points include:
There were 503 total crimes in Los Gatos in the last reporting year.
The overall crime rate per 100,000 people in Los Gatos is 1,580.4 / 100k people.
The violent crime rate per 100,000 people in Los Gatos is 147.7 / 100k people.
The property crime rate per 100,000 people in Los Gatos is 1,432.7 / 100k people.
Overall, crime in Los Gatos is -25.43% below the national average.
Total Crimes
Below National Average
Crime In Los Gatos Comparison Table
| Statistic | Count Raw |
Los Gatos / 100k People |
California / 100k People |
National / 100k People |
|---|---|---|---|---|
| Total Crimes Per 100K | 503 | 1,580.4 | 2,564.5 | 2,119.2 |
| Violent Crime | 47 | 147.7 | 486.0 | 359.0 |
| Murder | 0 | 0.0 | 4.5 | 5.0 |
| Robbery | 14 | 44.0 | 119.1 | 61.0 |
| Aggravated Assault | 26 | 81.7 | 325.8 | 256.0 |
| Property Crime | 456 | 1,432.7 | 2,078.4 | 1,760.0 |
| Burglary | 70 | 219.9 | 305.8 | 229.0 |
| Larceny | 358 | 1,124.8 | 1,345.2 | 1,272.0 |
| Car Theft | 28 | 88.0 | 427.5 | 259.0 |
Los Gatos, CA Cost Of Living
Cost of living in Los Gatos summary. We use data on the cost of living to determine how expensive it is to live in Los Gatos. Real estate prices drive most of the variance in cost of living around California. Key points include:
The cost of living in Los Gatos is 308 with 100 being average.
The cost of living in Los Gatos is 3.1x higher than the national average.
The median home value in Los Gatos is $2,440,617.
The median income in Los Gatos is $207,891.
Los Gatos's Overall Cost Of Living
Higher Than The National Average
Cost Of Living In Los Gatos Comparison Table
| Living Expense | Los Gatos | California | National Average | |
|---|---|---|---|---|
| Overall | 308 | 141 | 100 | |
| Services | 106 | 110 | 100 | |
| Groceries | 114 | 112 | 100 | |
| Health | 124 | 110 | 100 | |
| Housing | 750 | 195 | 100 | |
| Transportation | 128 | 125 | 100 | |
| Utilities | 134 | 128 | 100 | |
Los Gatos, CA Weather
The average high in Los Gatos is 71.1° and the average low is 48.8°.
There are 37.9 days of precipitation each year.
Expect an average of 17.4 inches of precipitation each year with 1.6 inches of snow.
| Stat | Los Gatos |
|---|---|
| Average Annual High | 71.1 |
| Average Annual Low | 48.8 |
| Annual Precipitation Days | 37.9 |
| Average Annual Precipitation | 17.4 |
| Average Annual Snowfall | 1.6 |
Average High
Days of Rain
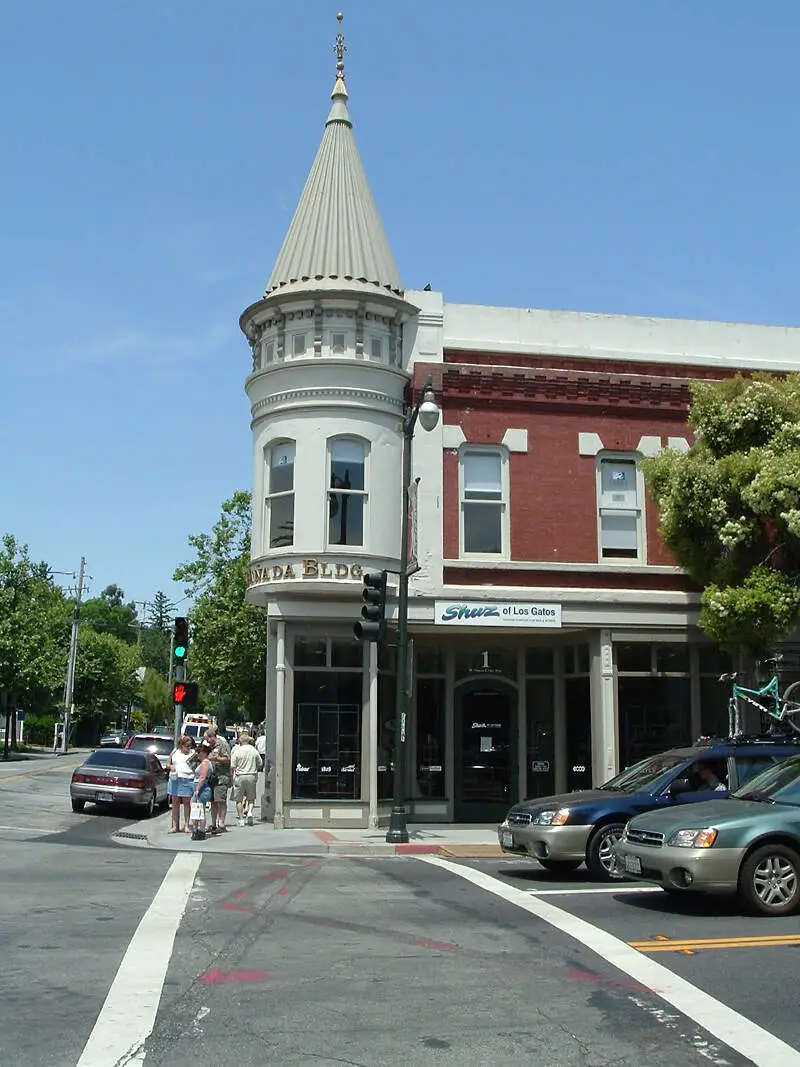
Los Gatos, CA Photos


1 Reviews & Comments About Los Gatos
/5

HomeSnacks User - None
Lived in Los Gatos for 15 years, and yes it's a desired community but because of the exceptional school system level, the photo is the high school which is the most beautiful one I've ever seen and I've lived all over the states, with the best teaching staff in the country, and its facilities are like a university...
I grew up in Ann Arbor, Mi. Which is a university town and gorgeous. I now live and have for 28 years on Catalina island, in Avalon which is the most mellow in the state, and beautiful... Location, location.
Rankings for Los Gatos in California


Locations Around Los Gatos
Map Of Los Gatos, CA
Best Places Around Los Gatos
East Foothills, CA
Population 8,630
Cupertino, CA
Population 58,886
Los Altos, CA
Population 30,736
Sunnyvale, CA
Population 153,455
Santa Clara, CA
Population 129,239
Mountain View, CA
Population 82,363
Saratoga, CA
Population 30,335
Campbell, CA
Population 42,848
Milpitas, CA
Population 78,216
Palo Alto, CA
Population 67,231
Los Gatos Demographics And Statistics
Population over time in Los Gatos
The current population in Los Gatos is 32,773. The population has increased 13.5% from 2010.
| Year | Population | % Change |
|---|---|---|
| 2023 | 32,773 | -1.0% |
| 2022 | 33,093 | -0.6% |
| 2021 | 33,309 | 4.3% |
| 2020 | 31,943 | 4.0% |
| 2019 | 30,729 | -0.6% |
| 2018 | 30,922 | 0.7% |
| 2017 | 30,709 | 0.7% |
| 2016 | 30,491 | 0.3% |
| 2015 | 30,398 | 0.8% |
| 2014 | 30,163 | 1.2% |
| 2013 | 29,809 | 1.0% |
| 2012 | 29,522 | 1.2% |
| 2011 | 29,165 | 1.0% |
| 2010 | 28,878 | - |
Race / Ethnicity in Los Gatos
Los Gatos is:
65.0% White with 21,298 White residents.
1.5% African American with 500 African American residents.
0.0% American Indian with 0 American Indian residents.
19.1% Asian with 6,273 Asian residents.
0.0% Hawaiian with 0 Hawaiian residents.
0.6% Other with 188 Other residents.
4.2% Two Or More with 1,367 Two Or More residents.
9.6% Hispanic with 3,147 Hispanic residents.
| Race | Los Gatos | CA | USA |
|---|---|---|---|
| White | 65.0% | 34.6% | 58.2% |
| African American | 1.5% | 5.3% | 12.0% |
| American Indian | 0.0% | 0.3% | 0.5% |
| Asian | 19.1% | 15.1% | 5.7% |
| Hawaiian | 0.0% | 0.3% | 0.2% |
| Other | 0.6% | 0.5% | 0.5% |
| Two Or More | 4.2% | 4.1% | 3.9% |
| Hispanic | 9.6% | 39.8% | 19.0% |
Gender in Los Gatos
Los Gatos is 50.9% female with 16,689 female residents.
Los Gatos is 49.1% male with 16,083 male residents.
| Gender | Los Gatos | CA | USA |
|---|---|---|---|
| Female | 50.9% | 50.0% | 50.5% |
| Male | 49.1% | 50.0% | 49.5% |
Highest level of educational attainment in Los Gatos for adults over 25
0.0% of adults in Los Gatos completed < 9th grade.
1.0% of adults in Los Gatos completed 9-12th grade.
6.0% of adults in Los Gatos completed high school / ged.
12.0% of adults in Los Gatos completed some college.
6.0% of adults in Los Gatos completed associate's degree.
38.0% of adults in Los Gatos completed bachelor's degree.
26.0% of adults in Los Gatos completed master's degree.
5.0% of adults in Los Gatos completed professional degree.
6.0% of adults in Los Gatos completed doctorate degree.
| Education | Los Gatos | CA | USA |
|---|---|---|---|
| < 9th Grade | 0.0% | 8.0% | 5.0% |
| 9-12th Grade | 1.0% | 7.0% | 6.0% |
| High School / GED | 6.0% | 20.0% | 26.0% |
| Some College | 12.0% | 20.0% | 19.0% |
| Associate's Degree | 6.0% | 8.0% | 9.0% |
| Bachelor's Degree | 38.0% | 22.0% | 21.0% |
| Master's Degree | 26.0% | 10.0% | 10.0% |
| Professional Degree | 5.0% | 3.0% | 2.0% |
| Doctorate Degree | 6.0% | 2.0% | 2.0% |
Household Income For Los Gatos, California
3.6% of households in Los Gatos earn Less than $10,000.
0.6% of households in Los Gatos earn $10,000 to $14,999.
1.9% of households in Los Gatos earn $15,000 to $24,999.
3.0% of households in Los Gatos earn $25,000 to $34,999.
1.9% of households in Los Gatos earn $35,000 to $49,999.
5.1% of households in Los Gatos earn $50,000 to $74,999.
8.0% of households in Los Gatos earn $75,000 to $99,999.
11.9% of households in Los Gatos earn $100,000 to $149,999.
13.0% of households in Los Gatos earn $150,000 to $199,999.
51.0% of households in Los Gatos earn $200,000 or more.
| Income | Los Gatos | CA | USA |
|---|---|---|---|
| Less than $10,000 | 3.6% | 4.4% | 4.9% |
| $10,000 to $14,999 | 0.6% | 3.0% | 3.6% |
| $15,000 to $24,999 | 1.9% | 5.2% | 6.6% |
| $25,000 to $34,999 | 3.0% | 5.5% | 6.8% |
| $35,000 to $49,999 | 1.9% | 8.4% | 10.4% |
| $50,000 to $74,999 | 5.1% | 13.3% | 15.7% |
| $75,000 to $99,999 | 8.0% | 11.8% | 12.7% |
| $100,000 to $149,999 | 11.9% | 17.9% | 17.4% |
| $150,000 to $199,999 | 13.0% | 11.1% | 9.3% |
| $200,000 or more | 51.0% | 19.4% | 12.6% |


