Ojai, CA
Demographics And Statistics
Living In Ojai, California Summary
Life in Ojai research summary. HomeSnacks has been using Saturday Night Science to research the quality of life in Ojai over the past nine years using Census, FBI, Zillow, and other primary data sources. Based on the most recently available data, we found the following about life in Ojai:
The population in Ojai is 7,576.
The median home value in Ojai is $1,142,397.
The median income in Ojai is $79,202.
The cost of living in Ojai is 182 which is 1.8x higher than the national average.
The median rent in Ojai is $1,913.
The unemployment rate in Ojai is 5.5%.
The poverty rate in Ojai is 11.0%.
The average high in Ojai is 72.0° and the average low is 51.7°.
Ojai SnackAbility
Overall SnackAbility
Ojai, CA Crime Report
Crime in Ojai summary. We use data from the FBI to determine the crime rates in Ojai. Key points include:
There were 77 total crimes in Ojai in the last reporting year.
The overall crime rate per 100,000 people in Ojai is 1,038.9 / 100k people.
The violent crime rate per 100,000 people in Ojai is 269.8 / 100k people.
The property crime rate per 100,000 people in Ojai is 769.0 / 100k people.
Overall, crime in Ojai is -50.98% below the national average.
Total Crimes
Below National Average
Crime In Ojai Comparison Table
| Statistic | Count Raw |
Ojai / 100k People |
California / 100k People |
National / 100k People |
|---|---|---|---|---|
| Total Crimes Per 100K | 77 | 1,038.9 | 2,564.5 | 2,119.2 |
| Violent Crime | 20 | 269.8 | 486.0 | 359.0 |
| Murder | 0 | 0.0 | 4.5 | 5.0 |
| Robbery | 2 | 27.0 | 119.1 | 61.0 |
| Aggravated Assault | 18 | 242.8 | 325.8 | 256.0 |
| Property Crime | 57 | 769.0 | 2,078.4 | 1,760.0 |
| Burglary | 5 | 67.5 | 305.8 | 229.0 |
| Larceny | 49 | 661.1 | 1,345.2 | 1,272.0 |
| Car Theft | 3 | 40.5 | 427.5 | 259.0 |
Ojai, CA Cost Of Living
Cost of living in Ojai summary. We use data on the cost of living to determine how expensive it is to live in Ojai. Real estate prices drive most of the variance in cost of living around California. Key points include:
The cost of living in Ojai is 182 with 100 being average.
The cost of living in Ojai is 1.8x higher than the national average.
The median home value in Ojai is $1,142,397.
The median income in Ojai is $79,202.
Ojai's Overall Cost Of Living
Higher Than The National Average
Cost Of Living In Ojai Comparison Table
| Living Expense | Ojai | California | National Average | |
|---|---|---|---|---|
| Overall | 182 | 141 | 100 | |
| Services | 116 | 110 | 100 | |
| Groceries | 111 | 112 | 100 | |
| Health | 106 | 110 | 100 | |
| Housing | 338 | 195 | 100 | |
| Transportation | 125 | 125 | 100 | |
| Utilities | 114 | 128 | 100 | |
Ojai, CA Weather
The average high in Ojai is 72.0° and the average low is 51.7°.
There are 24.0 days of precipitation each year.
Expect an average of 17.2 inches of precipitation each year with 0.0 inches of snow.
| Stat | Ojai |
|---|---|
| Average Annual High | 72.0 |
| Average Annual Low | 51.7 |
| Annual Precipitation Days | 24.0 |
| Average Annual Precipitation | 17.2 |
| Average Annual Snowfall | 0.0 |
Average High
Days of Rain
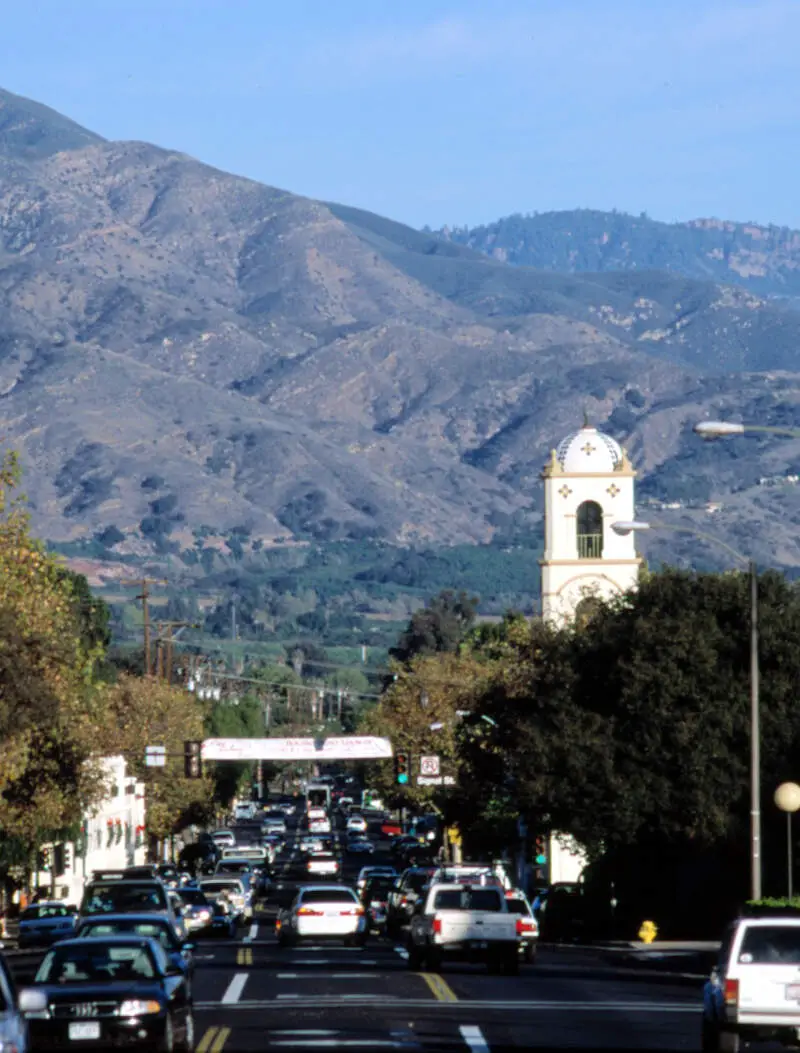
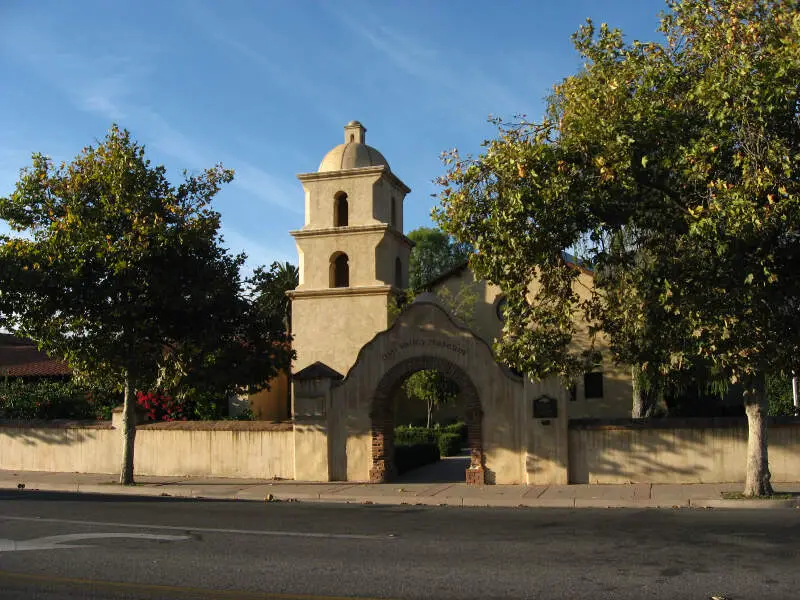
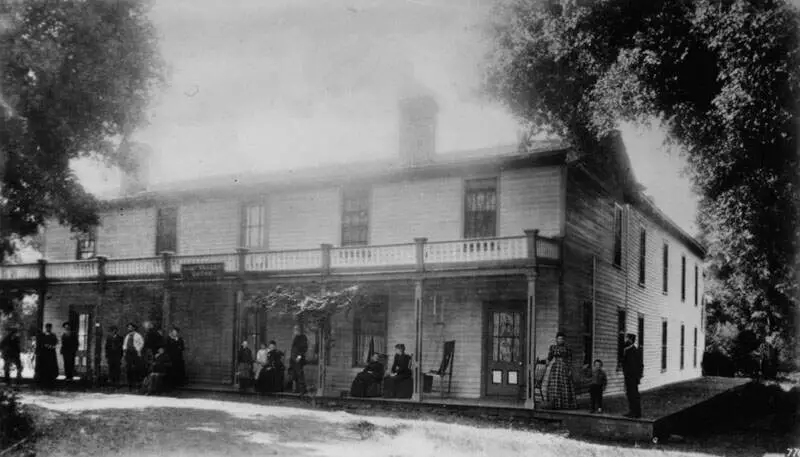
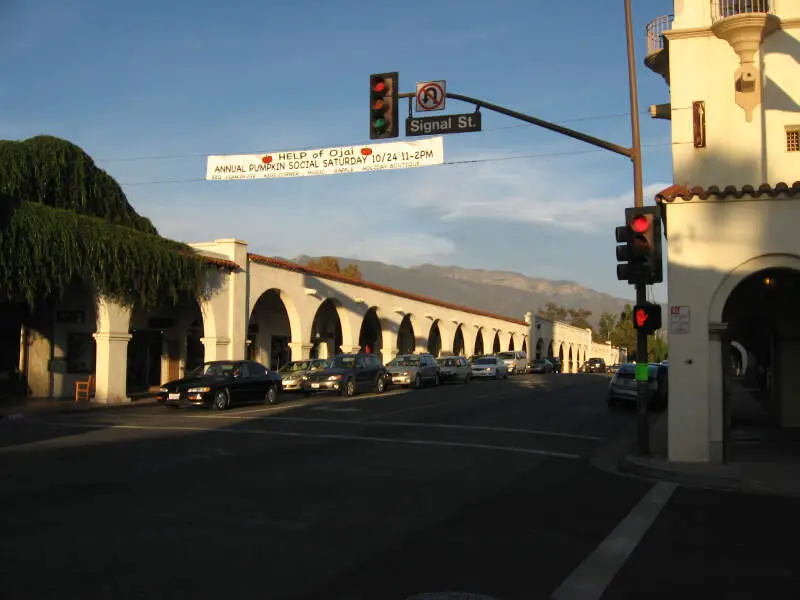
Ojai, CA Photos


Rankings for Ojai in California


Locations Around Ojai
Map Of Ojai, CA
Best Places Around Ojai
Camarillo, CA
Population 70,244
Carpinteria, CA
Population 13,100
Fillmore, CA
Population 16,665
Mira Monte, CA
Population 7,301
Oxnard, CA
Population 201,014
Port Hueneme, CA
Population 21,691
El Rio, CA
Population 6,343
Santa Paula, CA
Population 31,202
Ojai Demographics And Statistics
Population over time in Ojai
The current population in Ojai is 7,576. The population has increased 0.7% from 2010.
| Year | Population | % Change |
|---|---|---|
| 2023 | 7,576 | -0.4% |
| 2022 | 7,610 | -0.4% |
| 2021 | 7,640 | 0.4% |
| 2020 | 7,613 | 1.0% |
| 2019 | 7,534 | -0.3% |
| 2018 | 7,555 | -0.5% |
| 2017 | 7,594 | 0.2% |
| 2016 | 7,581 | -0.1% |
| 2015 | 7,587 | 0.4% |
| 2014 | 7,558 | 0.6% |
| 2013 | 7,514 | 0.2% |
| 2012 | 7,499 | 0.0% |
| 2011 | 7,496 | -0.4% |
| 2010 | 7,525 | - |
Race / Ethnicity in Ojai
Ojai is:
71.3% White with 5,404 White residents.
0.4% African American with 27 African American residents.
0.0% American Indian with 0 American Indian residents.
4.9% Asian with 372 Asian residents.
0.0% Hawaiian with 0 Hawaiian residents.
0.4% Other with 27 Other residents.
3.3% Two Or More with 247 Two Or More residents.
19.8% Hispanic with 1,499 Hispanic residents.
| Race | Ojai | CA | USA |
|---|---|---|---|
| White | 71.3% | 34.6% | 58.2% |
| African American | 0.4% | 5.3% | 12.0% |
| American Indian | 0.0% | 0.3% | 0.5% |
| Asian | 4.9% | 15.1% | 5.7% |
| Hawaiian | 0.0% | 0.3% | 0.2% |
| Other | 0.4% | 0.5% | 0.5% |
| Two Or More | 3.3% | 4.1% | 3.9% |
| Hispanic | 19.8% | 39.8% | 19.0% |
Gender in Ojai
Ojai is 54.4% female with 4,125 female residents.
Ojai is 45.6% male with 3,451 male residents.
| Gender | Ojai | CA | USA |
|---|---|---|---|
| Female | 54.4% | 50.0% | 50.5% |
| Male | 45.6% | 50.0% | 49.5% |
Highest level of educational attainment in Ojai for adults over 25
5.0% of adults in Ojai completed < 9th grade.
8.0% of adults in Ojai completed 9-12th grade.
15.0% of adults in Ojai completed high school / ged.
19.0% of adults in Ojai completed some college.
8.0% of adults in Ojai completed associate's degree.
23.0% of adults in Ojai completed bachelor's degree.
15.0% of adults in Ojai completed master's degree.
5.0% of adults in Ojai completed professional degree.
2.0% of adults in Ojai completed doctorate degree.
| Education | Ojai | CA | USA |
|---|---|---|---|
| < 9th Grade | 5.0% | 8.0% | 5.0% |
| 9-12th Grade | 8.0% | 7.0% | 6.0% |
| High School / GED | 15.0% | 20.0% | 26.0% |
| Some College | 19.0% | 20.0% | 19.0% |
| Associate's Degree | 8.0% | 8.0% | 9.0% |
| Bachelor's Degree | 23.0% | 22.0% | 21.0% |
| Master's Degree | 15.0% | 10.0% | 10.0% |
| Professional Degree | 5.0% | 3.0% | 2.0% |
| Doctorate Degree | 2.0% | 2.0% | 2.0% |
Household Income For Ojai, California
2.7% of households in Ojai earn Less than $10,000.
3.3% of households in Ojai earn $10,000 to $14,999.
3.1% of households in Ojai earn $15,000 to $24,999.
9.4% of households in Ojai earn $25,000 to $34,999.
11.5% of households in Ojai earn $35,000 to $49,999.
14.6% of households in Ojai earn $50,000 to $74,999.
13.8% of households in Ojai earn $75,000 to $99,999.
14.5% of households in Ojai earn $100,000 to $149,999.
7.5% of households in Ojai earn $150,000 to $199,999.
19.7% of households in Ojai earn $200,000 or more.
| Income | Ojai | CA | USA |
|---|---|---|---|
| Less than $10,000 | 2.7% | 4.4% | 4.9% |
| $10,000 to $14,999 | 3.3% | 3.0% | 3.6% |
| $15,000 to $24,999 | 3.1% | 5.2% | 6.6% |
| $25,000 to $34,999 | 9.4% | 5.5% | 6.8% |
| $35,000 to $49,999 | 11.5% | 8.4% | 10.4% |
| $50,000 to $74,999 | 14.6% | 13.3% | 15.7% |
| $75,000 to $99,999 | 13.8% | 11.8% | 12.7% |
| $100,000 to $149,999 | 14.5% | 17.9% | 17.4% |
| $150,000 to $199,999 | 7.5% | 11.1% | 9.3% |
| $200,000 or more | 19.7% | 19.4% | 12.6% |


