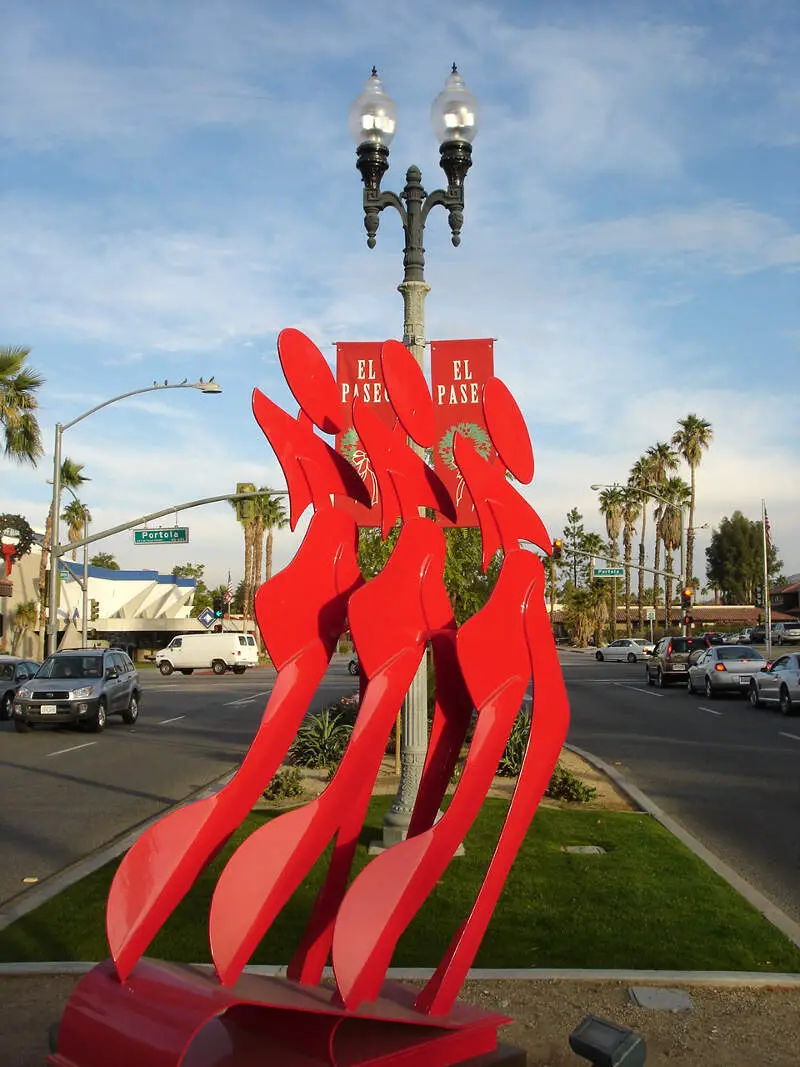
Palm Desert, CA
Demographics And Statistics
Living In Palm Desert, California Summary
Life in Palm Desert research summary. HomeSnacks has been using Saturday Night Science to research the quality of life in Palm Desert over the past nine years using Census, FBI, Zillow, and other primary data sources. Based on the most recently available data, we found the following about life in Palm Desert:
The population in Palm Desert is 51,551.
The median home value in Palm Desert is $546,961.
The median income in Palm Desert is $79,508.
The cost of living in Palm Desert is 134 which is 1.3x higher than the national average.
The median rent in Palm Desert is $1,717.
The unemployment rate in Palm Desert is 6.1%.
The poverty rate in Palm Desert is 11.3%.
The average high in Palm Desert is 81.2° and the average low is 52.0°.
Palm Desert SnackAbility
Overall SnackAbility
Palm Desert, CA Crime Report
Crime in Palm Desert summary. We use data from the FBI to determine the crime rates in Palm Desert. Key points include:
There were 1,645 total crimes in Palm Desert in the last reporting year.
The overall crime rate per 100,000 people in Palm Desert is 3,151.0 / 100k people.
The violent crime rate per 100,000 people in Palm Desert is 323.7 / 100k people.
The property crime rate per 100,000 people in Palm Desert is 2,827.3 / 100k people.
Overall, crime in Palm Desert is 48.69% above the national average.
Total Crimes
Above National Average
Crime In Palm Desert Comparison Table
| Statistic | Count Raw |
Palm Desert / 100k People |
California / 100k People |
National / 100k People |
|---|---|---|---|---|
| Total Crimes Per 100K | 1,645 | 3,151.0 | 2,564.5 | 2,119.2 |
| Violent Crime | 169 | 323.7 | 486.0 | 359.0 |
| Murder | 0 | 0.0 | 4.5 | 5.0 |
| Robbery | 41 | 78.5 | 119.1 | 61.0 |
| Aggravated Assault | 117 | 224.1 | 325.8 | 256.0 |
| Property Crime | 1,476 | 2,827.3 | 2,078.4 | 1,760.0 |
| Burglary | 233 | 446.3 | 305.8 | 229.0 |
| Larceny | 1,129 | 2,162.6 | 1,345.2 | 1,272.0 |
| Car Theft | 114 | 218.4 | 427.5 | 259.0 |
Palm Desert, CA Cost Of Living
Cost of living in Palm Desert summary. We use data on the cost of living to determine how expensive it is to live in Palm Desert. Real estate prices drive most of the variance in cost of living around California. Key points include:
The cost of living in Palm Desert is 134 with 100 being average.
The cost of living in Palm Desert is 1.3x higher than the national average.
The median home value in Palm Desert is $546,961.
The median income in Palm Desert is $79,508.
Palm Desert's Overall Cost Of Living
Higher Than The National Average
Cost Of Living In Palm Desert Comparison Table
| Living Expense | Palm Desert | California | National Average | |
|---|---|---|---|---|
| Overall | 134 | 141 | 100 | |
| Services | 111 | 110 | 100 | |
| Groceries | 117 | 112 | 100 | |
| Health | 106 | 110 | 100 | |
| Housing | 181 | 195 | 100 | |
| Transportation | 128 | 125 | 100 | |
| Utilities | 105 | 128 | 100 | |
Palm Desert, CA Weather
The average high in Palm Desert is 81.2° and the average low is 52.0°.
There are 18.0 days of precipitation each year.
Expect an average of 10.0 inches of precipitation each year with 1.7 inches of snow.
| Stat | Palm Desert |
|---|---|
| Average Annual High | 81.2 |
| Average Annual Low | 52.0 |
| Annual Precipitation Days | 18.0 |
| Average Annual Precipitation | 10.0 |
| Average Annual Snowfall | 1.7 |
Average High
Days of Rain
Palm Desert, CA Photos
Rankings for Palm Desert in California


Locations Around Palm Desert
Map Of Palm Desert, CA
Best Places Around Palm Desert
Desert Palms, CA
Population 6,522
La Quinta, CA
Population 38,299
Rancho Mirage, CA
Population 17,375
Bermuda Dunes, CA
Population 8,074
Thousand Palms, CA
Population 7,662
Indian Wells, CA
Population 4,830
Indio, CA
Population 90,669
Coachella, CA
Population 42,594
Palm Springs, CA
Population 44,998
Palm Desert Demographics And Statistics
Population over time in Palm Desert
The current population in Palm Desert is 51,551. The population has increased 6.2% from 2010.
| Year | Population | % Change |
|---|---|---|
| 2023 | 51,551 | 0.5% |
| 2022 | 51,290 | 0.4% |
| 2021 | 51,081 | -3.8% |
| 2020 | 53,087 | 1.0% |
| 2019 | 52,575 | 0.9% |
| 2018 | 52,124 | 0.9% |
| 2017 | 51,675 | 1.2% |
| 2016 | 51,045 | 0.9% |
| 2015 | 50,565 | 1.2% |
| 2014 | 49,953 | 1.3% |
| 2013 | 49,306 | 0.7% |
| 2012 | 48,959 | 0.4% |
| 2011 | 48,769 | 0.5% |
| 2010 | 48,534 | - |
Race / Ethnicity in Palm Desert
Palm Desert is:
64.3% White with 33,161 White residents.
2.1% African American with 1,067 African American residents.
0.1% American Indian with 73 American Indian residents.
4.1% Asian with 2,135 Asian residents.
0.1% Hawaiian with 43 Hawaiian residents.
0.2% Other with 94 Other residents.
3.0% Two Or More with 1,549 Two Or More residents.
26.0% Hispanic with 13,429 Hispanic residents.
| Race | Palm Desert | CA | USA |
|---|---|---|---|
| White | 64.3% | 34.6% | 58.2% |
| African American | 2.1% | 5.3% | 12.0% |
| American Indian | 0.1% | 0.3% | 0.5% |
| Asian | 4.1% | 15.1% | 5.7% |
| Hawaiian | 0.1% | 0.3% | 0.2% |
| Other | 0.2% | 0.5% | 0.5% |
| Two Or More | 3.0% | 4.1% | 3.9% |
| Hispanic | 26.0% | 39.8% | 19.0% |
Gender in Palm Desert
Palm Desert is 52.7% female with 27,144 female residents.
Palm Desert is 47.3% male with 24,406 male residents.
| Gender | Palm Desert | CA | USA |
|---|---|---|---|
| Female | 52.7% | 50.0% | 50.5% |
| Male | 47.3% | 50.0% | 49.5% |
Highest level of educational attainment in Palm Desert for adults over 25
2.0% of adults in Palm Desert completed < 9th grade.
5.0% of adults in Palm Desert completed 9-12th grade.
18.0% of adults in Palm Desert completed high school / ged.
26.0% of adults in Palm Desert completed some college.
9.0% of adults in Palm Desert completed associate's degree.
24.0% of adults in Palm Desert completed bachelor's degree.
10.0% of adults in Palm Desert completed master's degree.
4.0% of adults in Palm Desert completed professional degree.
2.0% of adults in Palm Desert completed doctorate degree.
| Education | Palm Desert | CA | USA |
|---|---|---|---|
| < 9th Grade | 2.0% | 8.0% | 5.0% |
| 9-12th Grade | 5.0% | 7.0% | 6.0% |
| High School / GED | 18.0% | 20.0% | 26.0% |
| Some College | 26.0% | 20.0% | 19.0% |
| Associate's Degree | 9.0% | 8.0% | 9.0% |
| Bachelor's Degree | 24.0% | 22.0% | 21.0% |
| Master's Degree | 10.0% | 10.0% | 10.0% |
| Professional Degree | 4.0% | 3.0% | 2.0% |
| Doctorate Degree | 2.0% | 2.0% | 2.0% |
Household Income For Palm Desert, California
5.2% of households in Palm Desert earn Less than $10,000.
4.2% of households in Palm Desert earn $10,000 to $14,999.
6.8% of households in Palm Desert earn $15,000 to $24,999.
7.1% of households in Palm Desert earn $25,000 to $34,999.
11.0% of households in Palm Desert earn $35,000 to $49,999.
14.1% of households in Palm Desert earn $50,000 to $74,999.
11.4% of households in Palm Desert earn $75,000 to $99,999.
15.2% of households in Palm Desert earn $100,000 to $149,999.
10.6% of households in Palm Desert earn $150,000 to $199,999.
14.5% of households in Palm Desert earn $200,000 or more.
| Income | Palm Desert | CA | USA |
|---|---|---|---|
| Less than $10,000 | 5.2% | 4.4% | 4.9% |
| $10,000 to $14,999 | 4.2% | 3.0% | 3.6% |
| $15,000 to $24,999 | 6.8% | 5.2% | 6.6% |
| $25,000 to $34,999 | 7.1% | 5.5% | 6.8% |
| $35,000 to $49,999 | 11.0% | 8.4% | 10.4% |
| $50,000 to $74,999 | 14.1% | 13.3% | 15.7% |
| $75,000 to $99,999 | 11.4% | 11.8% | 12.7% |
| $100,000 to $149,999 | 15.2% | 17.9% | 17.4% |
| $150,000 to $199,999 | 10.6% | 11.1% | 9.3% |
| $200,000 or more | 14.5% | 19.4% | 12.6% |


