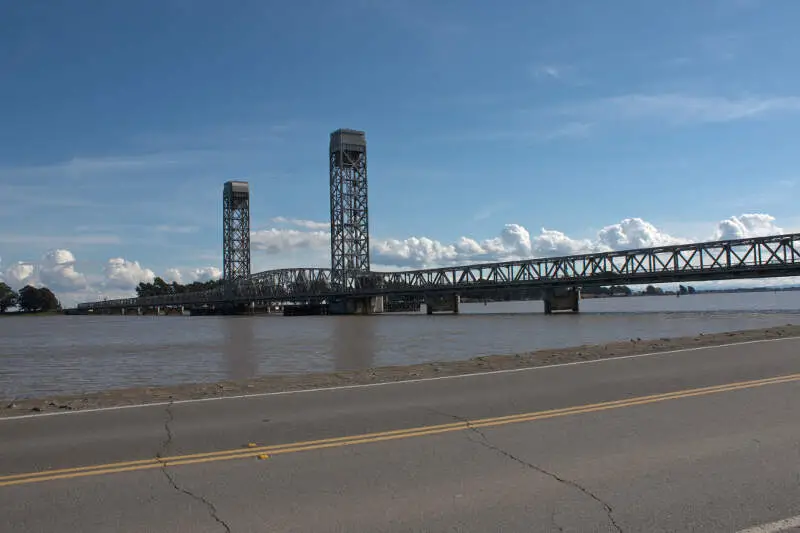
Rio Vista, CA
Demographics And Statistics
Living In Rio Vista, California Summary
Life in Rio Vista research summary. HomeSnacks has been using Saturday Night Science to research the quality of life in Rio Vista over the past nine years using Census, FBI, Zillow, and other primary data sources. Based on the most recently available data, we found the following about life in Rio Vista:
The population in Rio Vista is 10,002.
The median home value in Rio Vista is $464,243.
The median income in Rio Vista is $86,970.
The cost of living in Rio Vista is 136 which is 1.4x higher than the national average.
The median rent in Rio Vista is $1,624.
The unemployment rate in Rio Vista is 11.4%.
The poverty rate in Rio Vista is 8.0%.
The average high in Rio Vista is 72.1° and the average low is 47.9°.
Rio Vista SnackAbility
Overall SnackAbility
Rio Vista, CA Crime Report
Crime in Rio Vista summary. We use data from the FBI to determine the crime rates in Rio Vista. Key points include:
There were 64 total crimes in Rio Vista in the last reporting year.
The overall crime rate per 100,000 people in Rio Vista is 628.0 / 100k people.
The violent crime rate per 100,000 people in Rio Vista is 245.3 / 100k people.
The property crime rate per 100,000 people in Rio Vista is 382.7 / 100k people.
Overall, crime in Rio Vista is -70.37% below the national average.
Total Crimes
Below National Average
Crime In Rio Vista Comparison Table
| Statistic | Count Raw |
Rio Vista / 100k People |
California / 100k People |
National / 100k People |
|---|---|---|---|---|
| Total Crimes Per 100K | 64 | 628.0 | 2,564.5 | 2,119.2 |
| Violent Crime | 25 | 245.3 | 486.0 | 359.0 |
| Murder | 1 | 9.8 | 4.5 | 5.0 |
| Robbery | 0 | 0.0 | 119.1 | 61.0 |
| Aggravated Assault | 22 | 215.9 | 325.8 | 256.0 |
| Property Crime | 39 | 382.7 | 2,078.4 | 1,760.0 |
| Burglary | 7 | 68.7 | 305.8 | 229.0 |
| Larceny | 26 | 255.1 | 1,345.2 | 1,272.0 |
| Car Theft | 6 | 58.9 | 427.5 | 259.0 |
Rio Vista, CA Cost Of Living
Cost of living in Rio Vista summary. We use data on the cost of living to determine how expensive it is to live in Rio Vista. Real estate prices drive most of the variance in cost of living around California. Key points include:
The cost of living in Rio Vista is 136 with 100 being average.
The cost of living in Rio Vista is 1.4x higher than the national average.
The median home value in Rio Vista is $464,243.
The median income in Rio Vista is $86,970.
Rio Vista's Overall Cost Of Living
Higher Than The National Average
Cost Of Living In Rio Vista Comparison Table
| Living Expense | Rio Vista | California | National Average | |
|---|---|---|---|---|
| Overall | 136 | 141 | 100 | |
| Services | 107 | 110 | 100 | |
| Groceries | 109 | 112 | 100 | |
| Health | 103 | 110 | 100 | |
| Housing | 186 | 195 | 100 | |
| Transportation | 120 | 125 | 100 | |
| Utilities | 143 | 128 | 100 | |
Rio Vista, CA Weather
The average high in Rio Vista is 72.1° and the average low is 47.9°.
There are 40.3 days of precipitation each year.
Expect an average of 21.3 inches of precipitation each year with 0.1 inches of snow.
| Stat | Rio Vista |
|---|---|
| Average Annual High | 72.1 |
| Average Annual Low | 47.9 |
| Annual Precipitation Days | 40.3 |
| Average Annual Precipitation | 21.3 |
| Average Annual Snowfall | 0.1 |
Average High
Days of Rain
Rio Vista, CA Photos


Rankings for Rio Vista in California


Locations Around Rio Vista
Map Of Rio Vista, CA
Best Places Around Rio Vista
Oakley, CA
Population 44,311
Vacaville, CA
Population 102,085
Dixon, CA
Population 19,158
Brentwood, CA
Population 64,609
Discovery Bay, CA
Population 15,243
Pittsburg, CA
Population 75,868
Bay Point, CA
Population 24,065
Fairfield, CA
Population 119,985
Antioch, CA
Population 115,759
Rio Vista Demographics And Statistics
Population over time in Rio Vista
The current population in Rio Vista is 10,002. The population has increased 45.5% from 2010.
| Year | Population | % Change |
|---|---|---|
| 2023 | 10,002 | -0.7% |
| 2022 | 10,074 | 2.3% |
| 2021 | 9,850 | 4.7% |
| 2020 | 9,407 | 5.1% |
| 2019 | 8,947 | 3.8% |
| 2018 | 8,618 | 3.2% |
| 2017 | 8,350 | 3.7% |
| 2016 | 8,055 | 2.9% |
| 2015 | 7,826 | 2.4% |
| 2014 | 7,646 | 2.6% |
| 2013 | 7,451 | 2.5% |
| 2012 | 7,266 | 2.5% |
| 2011 | 7,088 | 3.1% |
| 2010 | 6,874 | - |
Race / Ethnicity in Rio Vista
Rio Vista is:
60.4% White with 6,039 White residents.
10.4% African American with 1,037 African American residents.
0.0% American Indian with 0 American Indian residents.
6.7% Asian with 675 Asian residents.
0.0% Hawaiian with 0 Hawaiian residents.
0.2% Other with 18 Other residents.
2.7% Two Or More with 273 Two Or More residents.
19.6% Hispanic with 1,960 Hispanic residents.
| Race | Rio Vista | CA | USA |
|---|---|---|---|
| White | 60.4% | 34.6% | 58.2% |
| African American | 10.4% | 5.3% | 12.0% |
| American Indian | 0.0% | 0.3% | 0.5% |
| Asian | 6.7% | 15.1% | 5.7% |
| Hawaiian | 0.0% | 0.3% | 0.2% |
| Other | 0.2% | 0.5% | 0.5% |
| Two Or More | 2.7% | 4.1% | 3.9% |
| Hispanic | 19.6% | 39.8% | 19.0% |
Gender in Rio Vista
Rio Vista is 54.4% female with 5,443 female residents.
Rio Vista is 45.6% male with 4,559 male residents.
| Gender | Rio Vista | CA | USA |
|---|---|---|---|
| Female | 54.4% | 50.0% | 50.5% |
| Male | 45.6% | 50.0% | 49.5% |
Highest level of educational attainment in Rio Vista for adults over 25
1.0% of adults in Rio Vista completed < 9th grade.
6.0% of adults in Rio Vista completed 9-12th grade.
15.0% of adults in Rio Vista completed high school / ged.
28.0% of adults in Rio Vista completed some college.
14.0% of adults in Rio Vista completed associate's degree.
23.0% of adults in Rio Vista completed bachelor's degree.
6.0% of adults in Rio Vista completed master's degree.
3.0% of adults in Rio Vista completed professional degree.
4.0% of adults in Rio Vista completed doctorate degree.
| Education | Rio Vista | CA | USA |
|---|---|---|---|
| < 9th Grade | 1.0% | 8.0% | 5.0% |
| 9-12th Grade | 6.0% | 7.0% | 6.0% |
| High School / GED | 15.0% | 20.0% | 26.0% |
| Some College | 28.0% | 20.0% | 19.0% |
| Associate's Degree | 14.0% | 8.0% | 9.0% |
| Bachelor's Degree | 23.0% | 22.0% | 21.0% |
| Master's Degree | 6.0% | 10.0% | 10.0% |
| Professional Degree | 3.0% | 3.0% | 2.0% |
| Doctorate Degree | 4.0% | 2.0% | 2.0% |
Household Income For Rio Vista, California
3.4% of households in Rio Vista earn Less than $10,000.
1.9% of households in Rio Vista earn $10,000 to $14,999.
2.9% of households in Rio Vista earn $15,000 to $24,999.
6.5% of households in Rio Vista earn $25,000 to $34,999.
10.4% of households in Rio Vista earn $35,000 to $49,999.
15.2% of households in Rio Vista earn $50,000 to $74,999.
19.8% of households in Rio Vista earn $75,000 to $99,999.
19.1% of households in Rio Vista earn $100,000 to $149,999.
12.9% of households in Rio Vista earn $150,000 to $199,999.
7.8% of households in Rio Vista earn $200,000 or more.
| Income | Rio Vista | CA | USA |
|---|---|---|---|
| Less than $10,000 | 3.4% | 4.4% | 4.9% |
| $10,000 to $14,999 | 1.9% | 3.0% | 3.6% |
| $15,000 to $24,999 | 2.9% | 5.2% | 6.6% |
| $25,000 to $34,999 | 6.5% | 5.5% | 6.8% |
| $35,000 to $49,999 | 10.4% | 8.4% | 10.4% |
| $50,000 to $74,999 | 15.2% | 13.3% | 15.7% |
| $75,000 to $99,999 | 19.8% | 11.8% | 12.7% |
| $100,000 to $149,999 | 19.1% | 17.9% | 17.4% |
| $150,000 to $199,999 | 12.9% | 11.1% | 9.3% |
| $200,000 or more | 7.8% | 19.4% | 12.6% |


