Compare Riverside to…
Riverside SnackAbility
Overall SnackAbility
Crime in Riverside summary. We use data from the FBI to determine the crime rates in Riverside. Key points include:
There were 10,955 total crimes in Riverside in the last reporting year.
The overall crime rate per 100,000 people in Riverside is 3,421.9 / 100k people.
The violent crime rate per 100,000 people in Riverside is 589.7 / 100k people.
The property crime rate per 100,000 people in Riverside is 2,832.1 / 100k people.
Overall, crime in Riverside is 61.47% above the national average.
Total Crimes
Above National Average
Crime In Riverside Comparison Table
| Statistic | Count Raw |
Riverside / 100k People |
California / 100k People |
National / 100k People |
|---|---|---|---|---|
| Total Crimes Per 100K | 10,955 | 3,421.9 | 2,564.5 | 2,119.2 |
| Violent Crime | 1,888 | 589.7 | 486.0 | 359.0 |
| Murder | 10 | 3.1 | 4.5 | 5.0 |
| Robbery | 385 | 120.3 | 119.1 | 61.0 |
| Aggravated Assault | 1,320 | 412.3 | 325.8 | 256.0 |
| Property Crime | 9,067 | 2,832.1 | 2,078.4 | 1,760.0 |
| Burglary | 1,268 | 396.1 | 305.8 | 229.0 |
| Larceny | 6,353 | 1,984.4 | 1,345.2 | 1,272.0 |
| Car Theft | 1,446 | 451.7 | 427.5 | 259.0 |
Source: FBI Uniform Crime Reporting (2024)
Cost of living in Riverside summary. We use data on the cost of living to determine how expensive it is to live in Riverside. Real estate prices drive most of the variance in cost of living around California. Key points include:
The cost of living in Riverside is 138 with 100 being average.
The cost of living in Riverside is 1.4x higher than the national average.
The median home value in Riverside is $646,784.
The median income in Riverside is $91,045.
Riverside's Overall Cost Of Living
Higher Than The National Average
Cost Of Living In Riverside Comparison Table
| Living Expense | Riverside | California | National Average |
|---|---|---|---|
| Overall | 138 | 142 | 100 |
| Services | 110 | 110 | 100 |
| Groceries | 119 | 118 | 100 |
| Health | 191 | 197 | 100 |
| Housing | 121 | 120 | 100 |
| Transportation | 124 | 121 | 100 |
| Utilities | 116 | 121 | 100 |
Source: Cost of living index, normalized to US average = 100
Riverside, CA Weather
The average high in Riverside is 81.2° and the average low is 52.0°.
There are 18.0 days of precipitation each year.
Expect an average of 10.0 inches of precipitation each year with 1.7 inches of snow.
| Stat | Riverside |
|---|---|
| Average Annual High | 81.2 |
| Average Annual Low | 52.0 |
| Annual Precipitation Days | 18.0 |
| Average Annual Precipitation | 10.0 |
| Average Annual Snowfall | 1.7 |
Average High
Days of Rain
Source: NOAA climate normals (30-year)
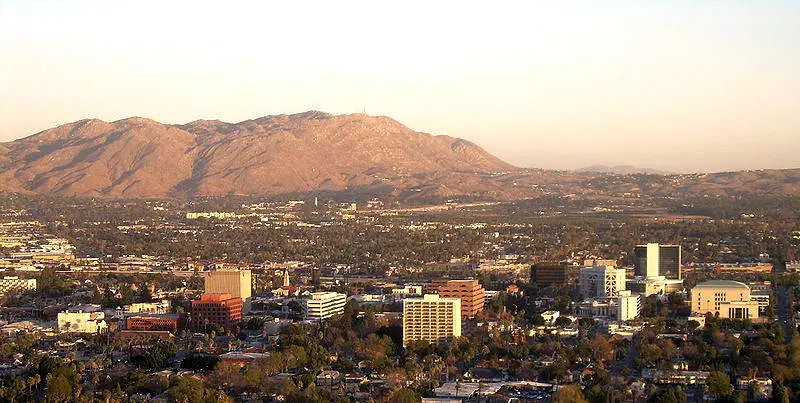
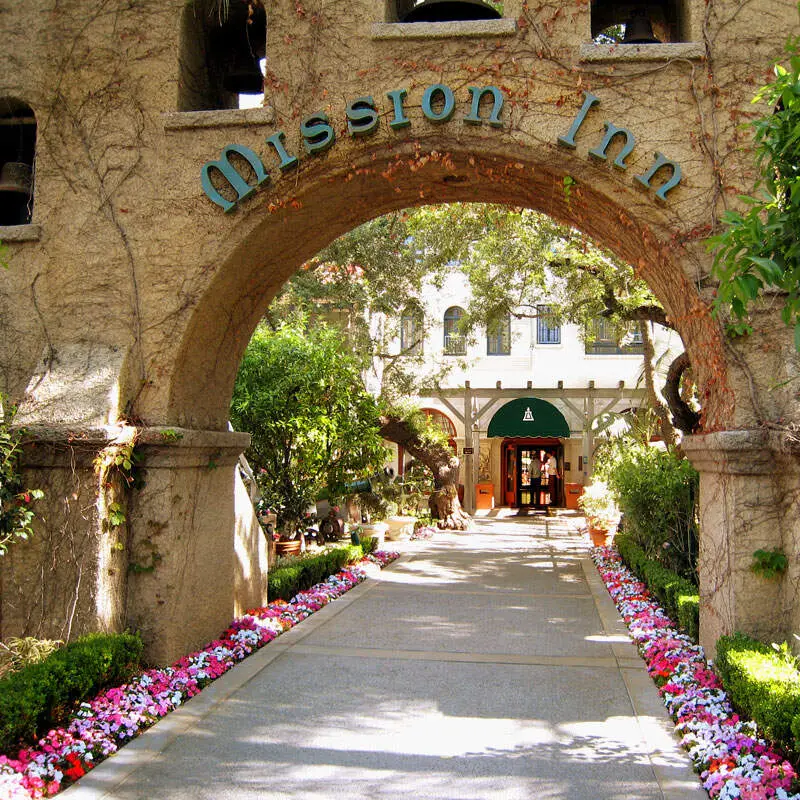
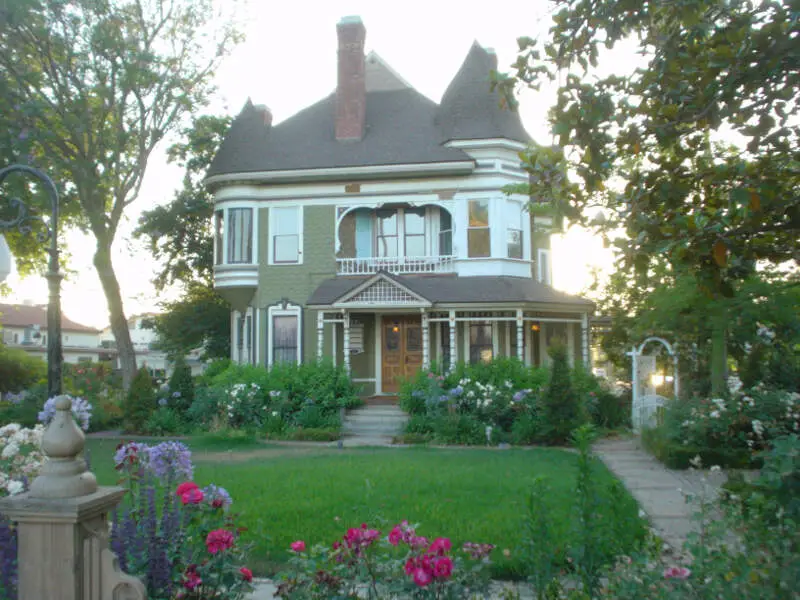
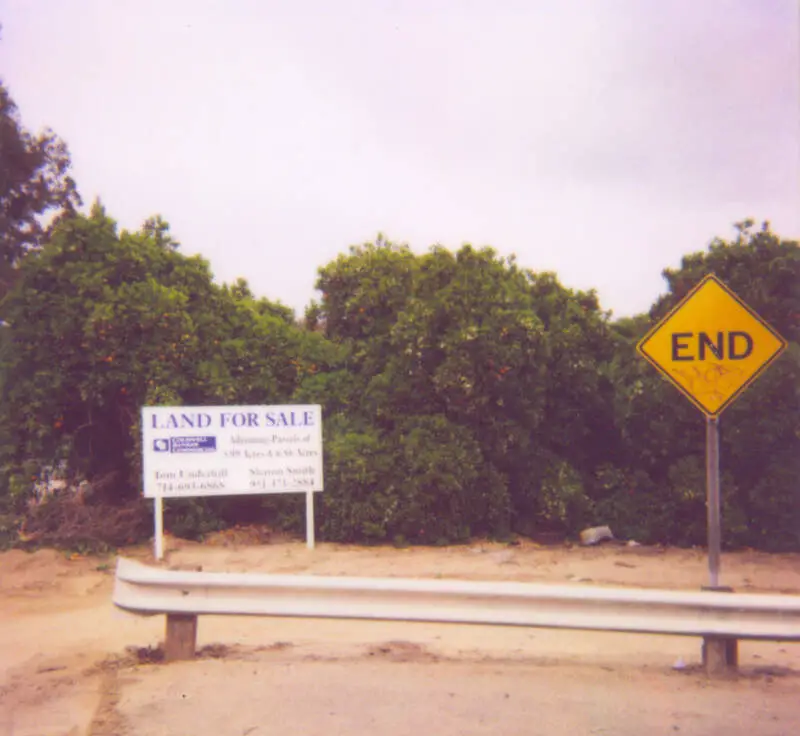
Riverside, CA Photos

2 Reviews & Comments About Riverside

I would say crime rate in Riverside is down and most crimes are low on the scale of severity. I love the school systems and houses. They have a mix of many things to do like parks, swimming, rock climbing, trampoline parks. Someone visiting can defiantly find something to do.
I love the trampoline parks. I love the parks and outdoor just site seeing. I would say sometimes they do not have toilet paper in park restrooms and here and there homeless people with be there but most friendly. trampoline parks can get crowded.
I've lived in Riverside most of my life and never once heard it refered to by anyone as wiggerside.
Of course I can't hear much of anything over the ranchero music...||But I promise you the acre of land I live on in Riverside is 100% more picturesque and beautiful then the shithole apartment your typing this clickbate from somewhere in Canoga Park."
Rankings & Articles For Riverside


Locations Around Riverside
Map Of Riverside, CA
Best Places Around Riverside
Rancho Cucamonga, CA
Population 175,411
Grand Terrace, CA
Population 13,078
Chino Hills, CA
Population 77,927
Eastvale, CA
Population 70,633
Corona, CA
Population 159,670
El Cerrito, CA
Population 25,994
Home Gardens, CA
Population 10,506
Woodcrest, CA
Population 17,368
Loma Linda, CA
Population 25,122
Upland, CA
Population 79,257
Riverside Demographics And Statistics
Population over time in Riverside
The current population in Riverside is 319,069. The population has increased 6.2% from 2010.
| Year | Population | % Change |
|---|---|---|
| 2024 | 319,069 | 0.9% |
| 2023 | 316,241 | 0.1% |
| 2022 | 316,076 | 0.4% |
| 2021 | 314,858 | -3.9% |
| 2020 | 327,569 | 0.4% |
| 2019 | 326,414 | 0.8% |
| 2018 | 323,935 | 0.7% |
| 2017 | 321,570 | 0.9% |
| 2016 | 318,678 | 0.7% |
| 2015 | 316,335 | 1.1% |
| 2014 | 313,041 | 1.3% |
| 2013 | 309,150 | 1.0% |
| 2012 | 306,128 | 0.8% |
| 2011 | 303,569 | 1.0% |
| 2010 | 300,553 | - |
Race / Ethnicity in Riverside
See the full breakdown
Riverside is:
26.1% White with 83,286 White residents.
5.9% African American with 18,872 African American residents.
0.2% American Indian with 508 American Indian residents.
8.0% Asian with 25,564 Asian residents.
0.3% Hawaiian with 894 Hawaiian residents.
0.4% Other with 1,368 Other residents.
3.5% Two Or More with 11,043 Two Or More residents.
55.6% Hispanic with 177,534 Hispanic residents.
| Race | Riverside | CA | USA |
|---|---|---|---|
| White | 26.1% | 33.8% | 57.4% |
| African American | 5.9% | 5.2% | 11.9% |
| American Indian | 0.2% | 0.3% | 0.5% |
| Asian | 8.0% | 15.3% | 5.9% |
| Hawaiian | 0.3% | 0.3% | 0.2% |
| Other | 0.4% | 0.6% | 0.6% |
| Two Or More | 3.5% | 4.4% | 4.3% |
| Hispanic | 55.6% | 40.2% | 19.3% |
Gender in Riverside
See the full breakdown
Riverside is 50.4% female with 160,795 female residents.
Riverside is 49.6% male with 158,274 male residents.
| Gender | Riverside | CA | USA |
|---|---|---|---|
| Female | 50.4% | 50.1% | 50.5% |
| Male | 49.6% | 49.9% | 49.5% |
Highest level of educational attainment in Riverside for adults over 25
See the full breakdown
8.0% of adults in Riverside completed < 9th grade.
8.0% of adults in Riverside completed 9-12th grade.
29.0% of adults in Riverside completed high school / ged.
21.0% of adults in Riverside completed some college.
8.0% of adults in Riverside completed associate's degree.
15.0% of adults in Riverside completed bachelor's degree.
7.0% of adults in Riverside completed master's degree.
2.0% of adults in Riverside completed professional degree.
2.0% of adults in Riverside completed doctorate degree.
| Education | Riverside | CA | USA |
|---|---|---|---|
| < 9th Grade | 8.0% | 8.0% | 4.0% |
| 9-12th Grade | 8.0% | 7.0% | 6.0% |
| High School / GED | 29.0% | 20.0% | 26.0% |
| Some College | 21.0% | 19.0% | 19.0% |
| Associate's Degree | 8.0% | 8.0% | 9.0% |
| Bachelor's Degree | 15.0% | 23.0% | 22.0% |
| Master's Degree | 7.0% | 10.0% | 10.0% |
| Professional Degree | 2.0% | 3.0% | 2.0% |
| Doctorate Degree | 2.0% | 2.0% | 2.0% |
Household Income For Riverside, California
See the full breakdown
4.7% of households in Riverside earn Less than $10,000.
2.5% of households in Riverside earn $10,000 to $14,999.
4.3% of households in Riverside earn $15,000 to $24,999.
5.0% of households in Riverside earn $25,000 to $34,999.
8.9% of households in Riverside earn $35,000 to $49,999.
15.6% of households in Riverside earn $50,000 to $74,999.
13.9% of households in Riverside earn $75,000 to $99,999.
20.1% of households in Riverside earn $100,000 to $149,999.
12.6% of households in Riverside earn $150,000 to $199,999.
12.5% of households in Riverside earn $200,000 or more.
| Income | Riverside | CA | USA |
|---|---|---|---|
| Less than $10,000 | 4.7% | 4.5% | 5.0% |
| $10,000 to $14,999 | 2.5% | 2.9% | 3.4% |
| $15,000 to $24,999 | 4.3% | 5.0% | 6.3% |
| $25,000 to $34,999 | 5.0% | 5.3% | 6.6% |
| $35,000 to $49,999 | 8.9% | 8.1% | 10.1% |
| $50,000 to $74,999 | 15.6% | 13.0% | 15.5% |
| $75,000 to $99,999 | 13.9% | 11.6% | 12.6% |
| $100,000 to $149,999 | 20.1% | 17.8% | 17.5% |
| $150,000 to $199,999 | 12.6% | 11.3% | 9.6% |
| $200,000 or more | 12.5% | 20.5% | 13.4% |
Source: U.S. Census ACS 5-year estimates (2024)


