Riversidevs.San Bernardino Which City Is Right for You in 2026?
A head-to-head guide to cost of living, jobs, transportation, weather, crime, and quality of life — so you can decide where to live, work, or visit.
Updated 2026-05-26 · By HomeSnacks Editorial
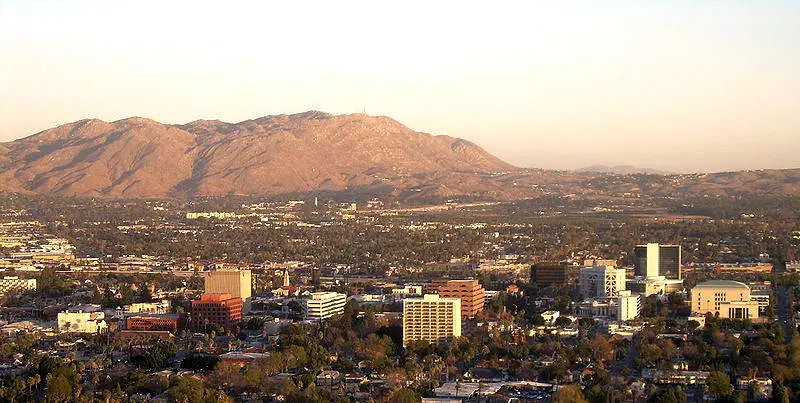
Riverside
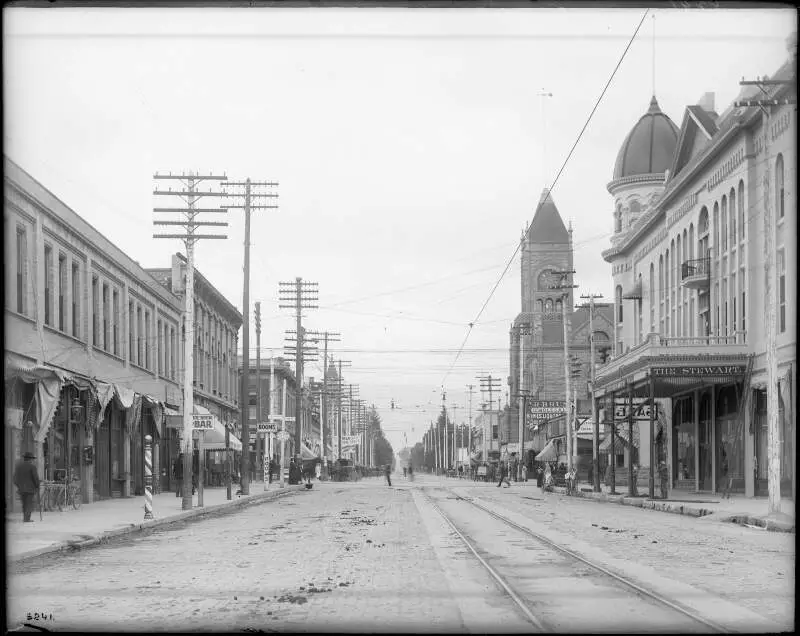
San Bernardino
Riverside vs. San Bernardino at a glance
Riverside, CA and San Bernardino, CA sit at very different points on the U.S. map — and the numbers reflect it. Riverside is a city in and the county seat of Riverside County, California, United States. It is named for its location beside the Santa Ana River in Southern California. San Bernardino is a city in and the county seat of San Bernardino County, California, United States.
On cost of living, San Bernardino is the cheaper city: its overall index sits at 125 versus 138 in Riverside (100 = national average). Median home values run $646,784 in Riverside and $487,988 in San Bernardino, with median rents at $1,914 and $1,508 respectively. That puts the home-value-to-income ratio at 7.1x in Riverside versus 7.2x in San Bernardino.
Safety is where the comparison sharpens. Riverside reports 3,422 total crimes per 100,000 residents annually versus 3,795 in San Bernardino. Riverside is the more racially diverse of the two on a Herfindahl index basis — Riverside skews 56% Hispanic while San Bernardino skews 70% Hispanic. On HomeSnacks' overall SnackAbility score, Riverside edges ahead at 7/10 versus 4/10 for San Bernardino.
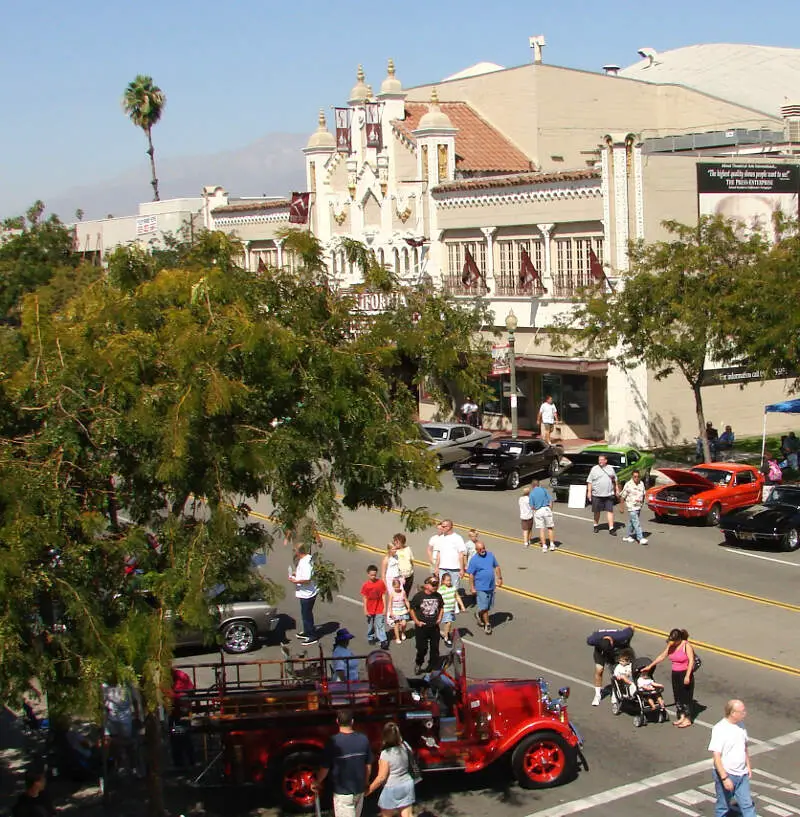
Riverside vs. San Bernardino in photos
A side-by-side look at each city.

Cost of living
San Bernardino is the cheaper city overall — 10% higher in Riverside than its rival. Index baseline: 100 = national average.
| Living expense | Riverside | San Bernardino | US average |
|---|---|---|---|
| Overall | 138 | 125 | 100 |
| Services | 110 | 108 | 100 |
| Groceries | 119 | 119 | 100 |
| Health | 191 | 135 | 100 |
| Housing | 121 | 120 | 100 |
| Transportation | 124 | 118 | 100 |
| Utilities | 116 | 124 | 100 |
Lower index = cheaper. 100 = U.S. national average. Bar inside each cell scales relative to the highest value in the table.
Sources: HomeSnacks Cost of Living indices, normalized so 100 = U.S. national average. Drill in: Riverside cost of living, San Bernardino cost of living, or the cheapest cities in America.
Housing breakdown
Home prices are higher in Riverside. Compare absolute price and price-to-income — a $500k home in a $100k-income city is very different from one in a $50k-income city.
| Metric | Riverside | San Bernardino | United States |
|---|---|---|---|
| Median Home Value | $646,784 | $487,988 | $332,700 |
| Median Rent | $1,914 | $1,508 | $1,413 |
| Median Income | $91,045 | $67,415 | $80,734 |
| Home Value To Income | 7.1x | 7.2x | 4.1x |
| Rent To Monthly Income | 0.25x | 0.27x | 0.21x |
Source: U.S. Census Bureau ACS 2020-2024. See also states with the highest rent in America.
Crime
Riverside is the safer city — total crime rate of 3,422 per 100k people vs 3,795 for San Bernardino. US average: 2,119.
| Crime (per 100k) | Riverside | San Bernardino | US average |
|---|---|---|---|
| Total crime | 3,422 | 3,795 | 2,119 |
| Murder | 3 | 11 | 5 |
| Robbery | 120 | 241 | 61 |
| Aggravated Assault | 412 | 595 | 256 |
| Violent Crime | 590 | 897 | 359 |
| Burglary | 396 | 455 | 229 |
| Larceny | 1,984 | 1,677 | 1,272 |
| Car Theft | 452 | 765 | 259 |
| Property Crime | 2,832 | 2,898 | 1,760 |
Lower = safer. Bar inside each cell scales relative to the highest crime rate in the table.
Source: FBI Uniform Crime Reporting (2024). All rates are per 100,000 people. City pages: Riverside crime, San Bernardino crime. See also: safest cities in America.
Diversity
Riverside is more racially diverse — lower HHI (closer to 0) means a more even mix across groups.
| Group | Riverside | San Bernardino | United States |
|---|---|---|---|
| White | 26.1% | 11.9% | 57.4% |
| African American | 5.9% | 10.6% | 11.9% |
| American Indian | 0.2% | 0.2% | 0.5% |
| Asian | 8.0% | 3.6% | 5.9% |
| Hawaiian | 0.3% | 0.4% | 0.2% |
| Other | 0.4% | 0.5% | 0.6% |
| Two Or More | 3.5% | 2.6% | 4.3% |
| Hispanic | 55.6% | 70.2% | 19.3% |
Source: U.S. Census ACS 2020-2024. Lower HHI = more even racial mix. See also: most diverse cities in America.
SnackAbility — overall quality of life
Riverside scores higher overall — 7/10 vs 4/10. SnackAbility is our 1–10 quality-of-life score; the median U.S. city scores a 7.
SnackAbility is a HomeSnacks proprietary 1–10 score blending jobs, housing, education, commute, amenities, affordability, crime, and diversity. Median U.S. city ≈ 7. Data: Census, BLS, FBI. See also: best places to live in America.
Getting around: Riverside vs. San Bernardino
How each city handles commuting, transit, walkability, and car culture — the day-to-day reality that shapes where you'd actually want to live.
Both Riverside and San Bernardino sit deep in the Inland Empire, so a car is your default for getting around either city. Riverside has a slight edge in commuter rail: the Metrolink 91/Perris Valley Line connects downtown Riverside to Los Angeles Union Station, a long but workable option for LA-bound commuters. San Bernardino anchors the Metrolink San Bernardino Line, which also runs to Union Station, though the full trip can push 90 minutes each way.
Local bus coverage in Riverside runs through the Riverside Transit Agency. San Bernardino is served by Omnitrans, with less frequent routes overall.
For drivers, both cities share the same congested corridors: the 10, 215, and 91 freeways, and rush-hour slowdowns toward the LA Basin are a daily reality. San Bernardino's position at the base of Cajon Pass puts it on a major freight route, adding truck traffic to the mix. If transit access matters to your commute, Riverside's slightly denser network and more walkable downtown give it a modest advantage over San Bernardino.
Jobs and careers in Riverside vs. San Bernardino
The local job market, dominant industries, and which city to choose based on your career.
The gap in median household income tells the story: $91,045 in Riverside versus $67,415 in San Bernardino. Riverside has a more diversified professional economy, with UC Riverside drawing academic, research, and healthcare jobs and Riverside University Health System anchoring a sizable medical sector. The city also has professional services and government workers tied to Riverside County administration.
If you're in education, healthcare, or white-collar services, Riverside has more options.
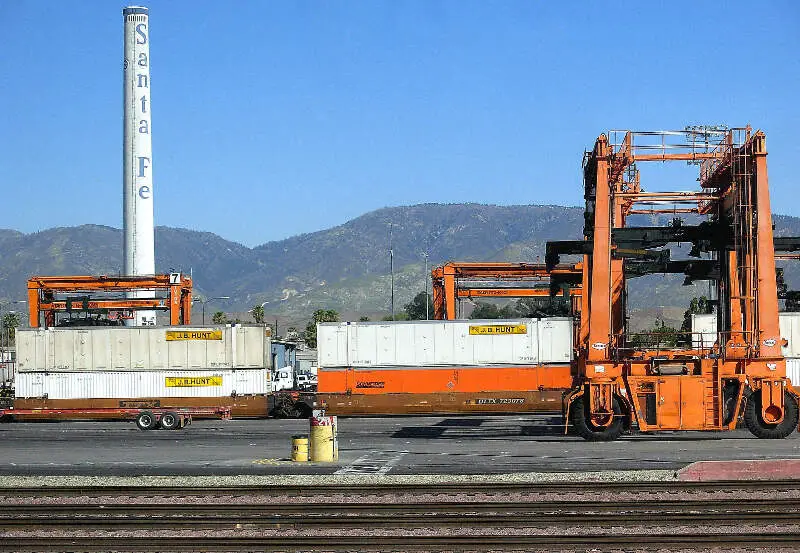
San Bernardino leans heavily on logistics, warehousing, and public-sector work. Amazon, UPS, and a wave of Inland Empire distribution centers have made the region a national e-commerce hub, and San Bernardino County, headquartered in the city, is one of the largest employers in the area. Cal State San Bernardino adds some higher-ed jobs.
Trade and transport roles are plentiful and often well-compensated, but the professional job market is narrower, which partly explains the income spread between the two cities.
Weather and climate
What to expect day-to-day — sun, fog, heat, rain, and the seasonal extremes that shape the lifestyle.
Summers are hot in both cities. Plan for stretches above 100°F from late June through September, and Santa Ana wind events can spike temperatures even higher in fall. Neither city is forgiving if you're heat-sensitive.
Winters are mild: lows rarely dip below freezing, and daytime highs in the 60s are typical from December through February. Rain is infrequent and concentrated in winter months.
The subtle difference comes down to elevation and local geography. San Bernardino sits closer to the base of the San Bernardino Mountains, which can funnel cooler air down the valley at night but also intensifies heat when downslope winds reverse. Riverside, farther west in the basin, tends to catch slightly more marine influence on summer evenings, shaving a degree or two off overnight lows.
Neither city gets fog the way coastal Southern California does. Snow isn't a factor in either city proper, though Big Bear Lake, less than an hour's drive from both, reliably delivers a ski season from late November through March.
Culture, nightlife, and entertainment
Food, music, neighborhoods, and the city vibe that gives each place its personality.
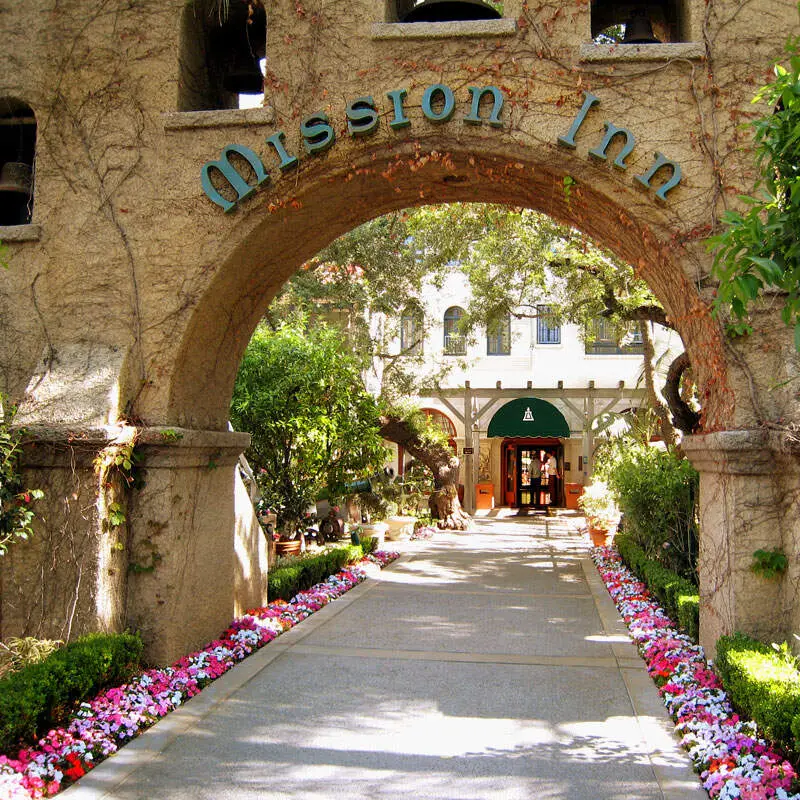
Riverside has the more developed cultural scene. The Mission Inn Hotel and Spa is a genuine architectural landmark and social anchor for downtown, with the surrounding blocks holding an active restaurant and bar strip, the Fox Performing Arts Center for concerts and theater, and the Riverside Art Museum. The UC Riverside presence keeps the city younger and more eclectic than its size might suggest.
Neighborhoods like the Wood Streets have a walkable, neighborhood-pub feel that's hard to find elsewhere in the Inland Empire.
San Bernardino's cultural life is thinner but not absent. The city has strong roots in Route 66 history: the original McDonald's site is here, and the California Theater of Performing Arts hosts touring shows in a beautifully restored 1928 venue. The National Orange Show Events Center draws regional crowds for concerts and fairs.
Nightlife options are more limited and spread out than in Riverside. Median rent of $1,508 versus Riverside's $1,914 reflects the trade-off: you pay less to live in San Bernardino, but you'll drive to Riverside or even Ontario for a wider night out.
Outdoor activities and day trips
Parks, beaches, hikes, and the weekend escapes that define life outside the city limits.
Big Bear Lake and Lake Arrowhead are roughly an hour's drive from both cities, with hiking, skiing, kayaking, and mountain biking across the San Bernardino National Forest. Joshua Tree National Park is about 90 minutes out and draws climbers, hikers, and stargazers year-round. San Bernardino's position closer to the mountain base can trim a few minutes off that drive.
Within city limits, Riverside has more developed green space. Mount Rubidoux Regional Park offers a signature sunrise hike with views across the valley, Box Springs Mountain Reserve has miles of trail above the city, and the UC Riverside Botanic Garden is a quiet spot for an afternoon. The Santa Ana River Trail connects both cities for cyclists.
San Bernardino's Perris Hill Park and nearby Yucaipa Regional Park, a short drive east, provide solid outdoor options. If walkable within-city outdoor recreation matters to your daily routine, Riverside's parks infrastructure is the stronger choice.
Bottom line: which city is right for you?
Based on the head-to-head data above, here's the short version — pick the city that lines up with what you actually care about.
Choose Riverside if you prioritize…
- lower crime — a safer place to live, work, and raise a family.
- more affordable housing relative to San Bernardino.
- a more racially diverse community (lower HHI on Census data).
- a higher overall SnackAbility quality-of-life score.
Choose San Bernardino if you prioritize…
- a lower cost of living (cheaper groceries, services, and day-to-day expenses).
Methodology: winners are picked from public data — U.S. Census Bureau ACS (income, home value, rent, race/HHI), FBI Uniform Crime Reporting (crime rates per 100k), and HomeSnacks' proprietary SnackAbility quality-of-life score, which blends Bureau of Labor Statistics data with the above.
More about California

Best Places To Live In California
Photo: Public domain
Cheapest Places To Live In California
Photo: Public domain
Most Dangerous Cities In California
Photo: Public domain
Best Places To Raise A Family In California
Photo: Public domain
Best Places To Retire In California
Photo: Public domain
Richest Cities In California
Photo: Public domain
Safest Places In California
Photo: Public domain
Worst Places To Live In California
Photo: Public domain