Bakersfieldvs.San Diego Which City Is Right for You in 2026?
A head-to-head guide to cost of living, jobs, transportation, weather, crime, and quality of life — so you can decide where to live, work, or visit.
Updated 2026-05-26 · By HomeSnacks Editorial
Bakersfield vs. San Diego at a glance
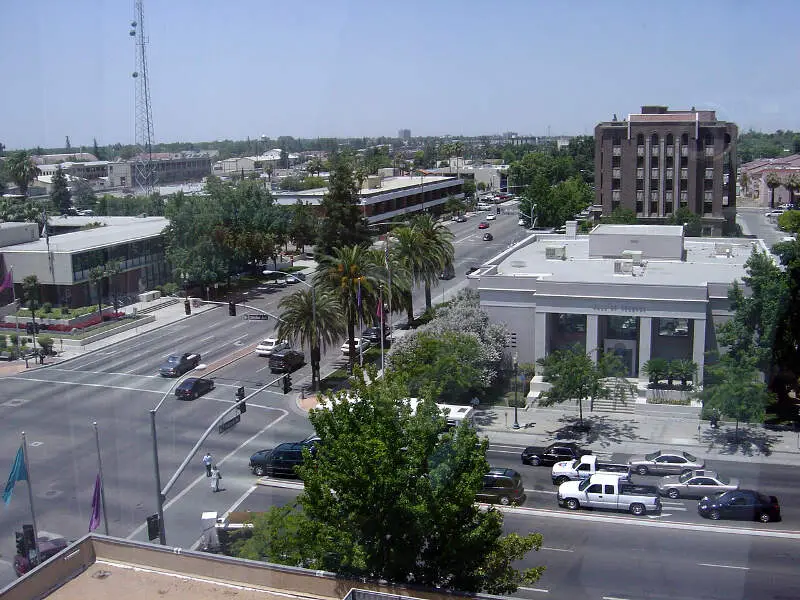
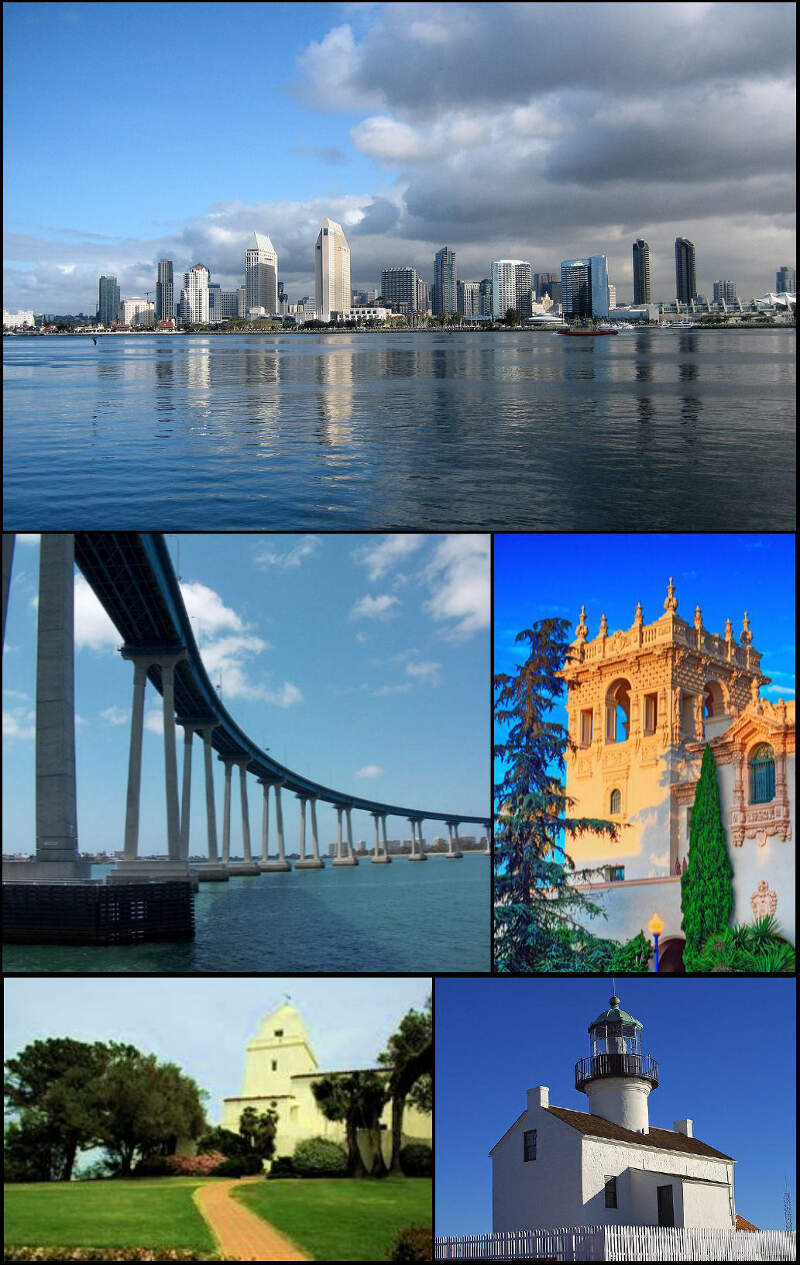
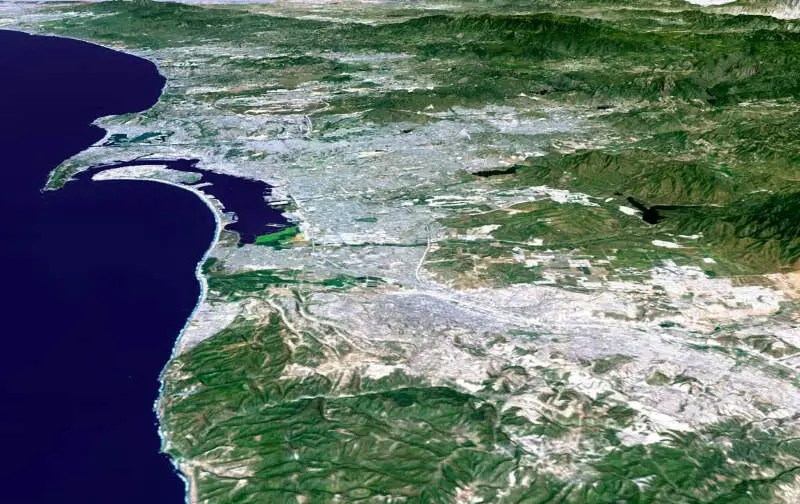
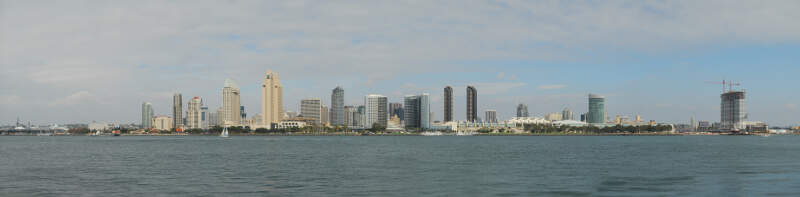
Bakersfield, CA and San Diego, CA sit at very different points on the U.S. map — and the numbers reflect it. Bakersfield is a city in and the county seat of Kern County, California, United States. The city covers about 151 sq mi (390 km2) near the southern end of the San Joaquin Valley, which is located in the Central Valley region. San Diego is a city on the Pacific coast of Southern California, adjacent to the Mexico–United States border. It is the eighth-most populous city in the U.S.
On cost of living, Bakersfield is the cheaper city: its overall index sits at 124 versus 175 in San Diego (100 = national average). Median home values run $396,047 in Bakersfield and $1,001,264 in San Diego, with median rents at $1,472 and $2,313 respectively. That puts the home-value-to-income ratio at 4.9x in Bakersfield versus 9.3x in San Diego.
FBI crime data adds another wrinkle. San Diego reports 2,082 total crimes per 100,000 residents annually versus 3,024 in Bakersfield. San Diego is the more racially diverse of the two on a Herfindahl index basis — Bakersfield skews 55% Hispanic while San Diego skews 41% White. On HomeSnacks' overall SnackAbility score, San Diego edges ahead at 8/10 versus 6/10 for Bakersfield.
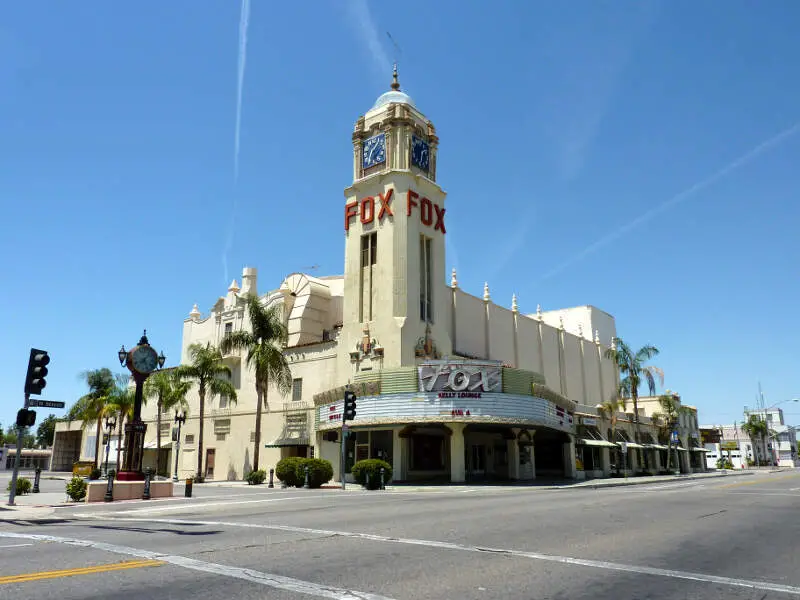
Bakersfield vs. San Diego in photos
A side-by-side look at each city.
Cost of living
Bakersfield is the cheaper city overall — 29% higher in San Diego than its rival. Index baseline: 100 = national average.
| Living expense | Bakersfield | San Diego | US average |
|---|---|---|---|
| Overall | 124 | 175 | 100 |
| Services | 113 | 121 | 100 |
| Groceries | 117 | 121 | 100 |
| Health | 137 | 296 | 100 |
| Housing | 121 | 127 | 100 |
| Transportation | 118 | 131 | 100 |
| Utilities | 122 | 135 | 100 |
Lower index = cheaper. 100 = U.S. national average. Bar inside each cell scales relative to the highest value in the table.
Sources: HomeSnacks Cost of Living indices, normalized so 100 = U.S. national average. Drill in: Bakersfield cost of living, San Diego cost of living, or the cheapest cities in America.
Housing breakdown
Home prices are higher in Bakersfield. Compare absolute price and price-to-income — a $500k home in a $100k-income city is very different from one in a $50k-income city.
| Metric | Bakersfield | San Diego | United States |
|---|---|---|---|
| Median Home Value | $396,047 | $1,001,264 | $332,700 |
| Median Rent | $1,472 | $2,313 | $1,413 |
| Median Income | $80,540 | $108,077 | $80,734 |
| Home Value To Income | 4.9x | 9.3x | 4.1x |
| Rent To Monthly Income | 0.22x | 0.26x | 0.21x |
Source: U.S. Census Bureau ACS 2020-2024. See also states with the highest rent in America.
Crime
San Diego is the safer city — total crime rate of 2,082 per 100k people vs 3,024 for Bakersfield. US average: 2,119.
| Crime (per 100k) | Bakersfield | San Diego | US average |
|---|---|---|---|
| Total crime | 3,024 | 2,082 | 2,119 |
| Murder | 7 | 3 | 5 |
| Robbery | 126 | 77 | 61 |
| Aggravated Assault | 381 | 311 | 256 |
| Violent Crime | 555 | 412 | 359 |
| Burglary | 538 | 187 | 229 |
| Larceny | 1,259 | 1,087 | 1,272 |
| Car Theft | 673 | 396 | 259 |
| Property Crime | 2,470 | 1,670 | 1,760 |
Lower = safer. Bar inside each cell scales relative to the highest crime rate in the table.
Source: FBI Uniform Crime Reporting (2024). All rates are per 100,000 people. City pages: Bakersfield crime, San Diego crime. See also: safest cities in America.
Diversity
San Diego is more racially diverse — lower HHI (closer to 0) means a more even mix across groups.
| Group | Bakersfield | San Diego | United States |
|---|---|---|---|
| White | 27.6% | 40.9% | 57.4% |
| African American | 5.7% | 5.3% | 11.9% |
| American Indian | 0.4% | 0.2% | 0.5% |
| Asian | 7.8% | 17.3% | 5.9% |
| Hawaiian | 0.1% | 0.4% | 0.2% |
| Other | 0.7% | 0.7% | 0.6% |
| Two Or More | 3.1% | 5.5% | 4.3% |
| Hispanic | 54.7% | 29.8% | 19.3% |
Source: U.S. Census ACS 2020-2024. Lower HHI = more even racial mix. See also: most diverse cities in America.
SnackAbility — overall quality of life
San Diego scores higher overall — 8/10 vs 6/10. SnackAbility is our 1–10 quality-of-life score; the median U.S. city scores a 7.
SnackAbility is a HomeSnacks proprietary 1–10 score blending jobs, housing, education, commute, amenities, affordability, crime, and diversity. Median U.S. city ≈ 7. Data: Census, BLS, FBI. See also: best places to live in America.
Getting around: Bakersfield vs. San Diego
How each city handles commuting, transit, walkability, and car culture — the day-to-day reality that shapes where you'd actually want to live.
Both cities are car-first, but the gap in alternatives is real. In Bakersfield, Golden Empire Transit (GET) runs a bus network that covers the basics. Most residents drive SR-99 or SR-58 for daily errands, and the city's sprawling layout makes transit feel like a last resort.
Congestion is real but rarely the gridlock you'd face in a major metro.
San Diego gives you more options. The MTS Trolley (Blue, Orange, and Green Lines) connects Downtown to Mission Valley, El Cajon, and the US-Mexico border. The COASTER commuter rail links North County coastal communities like Oceanside and Encinitas to the city center.
Even so, I-5 and I-15 back up hard during rush hour, and most neighborhoods outside of Downtown and North Park remain car-dependent. If you commute by car, San Diego's traffic will cost you more time and patience.
Jobs and careers in Bakersfield vs. San Diego
The local job market, dominant industries, and which city to choose based on your career.
Bakersfield's economy runs on oil, agriculture, and logistics. Chevron and Berry Petroleum are major local employers, and the region's position in the San Joaquin Valley keeps warehousing and food processing robust. Healthcare anchors another large slice, with Kern Medical and Dignity Health Mercy hospitals among the bigger names.
With a median household income of $80,540 and a cost of living index of 124, paychecks stretch reasonably well, though wage growth in the energy sector can swing with commodity prices.
San Diego's economy skews toward higher-paying industries. Defense contracting (NAVWAR, General Atomics) and biotech along Torrey Pines Mesa drive the median household income to $108,077, with the UC San Diego research ecosystem adding weight. Tourism and the military round it out.
The catch is a cost of living index of 175, nearly half again the US average, which erodes purchasing power faster than the income gap suggests.
Weather and climate
What to expect day-to-day — sun, fog, heat, rain, and the seasonal extremes that shape the lifestyle.
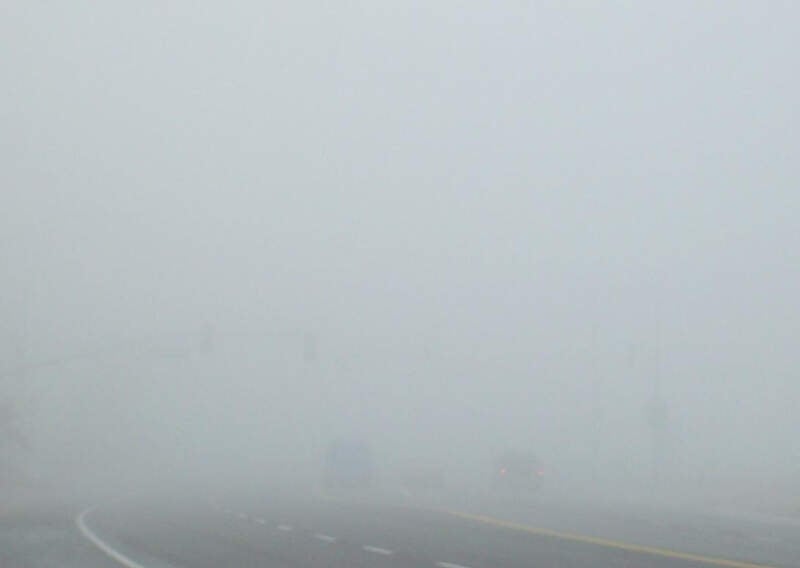
Bakersfield runs hot. Summers routinely exceed 100°F for weeks at a stretch, and the San Joaquin Valley traps pollution, giving the city some of the worst air quality in the country (worth taking seriously if anyone in your household has respiratory concerns). Winters are mild in temperature but foggy; tule fog settles in from November through February and can make driving genuinely dangerous.
San Diego is the easy winner here. Expect mild winters that rarely dip below 50°F, summers hovering in the mid-70s with sea breeze relief, and roughly 266 sunny days per year.
Ocean influence keeps neighborhoods like La Jolla and Point Loma comfortable even in August. The main exception is the occasional Santa Ana wind event in fall, which raises fire risk.
Culture, nightlife, and entertainment
Food, music, neighborhoods, and the city vibe that gives each place its personality.
Bakersfield punches above its weight in one niche: country music. The Bakersfield Sound, pioneered by Buck Owens and Merle Haggard, put the city on the map, and Buck Owens' Crystal Palace is still a working honky-tonk and museum worth a visit. Mechanics Bank Arena hosts touring acts and minor-league hockey, and the downtown strip around 19th Street has seen modest revival with local breweries and restaurants, but nightlife options remain limited compared to most cities its size.
San Diego offers considerably more range. The Gaslamp Quarter anchors a dense nightlife corridor Downtown; North Park has become the craft beer epicenter of Southern California, with spots like Modern Times and Council Brewing drawing serious crowds.
Little Italy is one of the better urban dining neighborhoods on the West Coast. Hillcrest has an active LGBTQ+ community, and Balboa Park's cluster of seventeen museums means weekend cultural options rarely run dry.
Outdoor activities and day trips
Parks, beaches, hikes, and the weekend escapes that define life outside the city limits.
Bakersfield's outdoor appeal is mostly what surrounds it rather than what's in it. The Kern River runs through town and feeds north into Lake Isabella, a genuine draw for kayaking, fishing, and whitewater rafting.
Drive an hour east and you're into Sequoia National Forest; drive two hours and you're walking among the giant sequoias. Hart Memorial Park and the Kern River Parkway offer everyday trail options, though the summer heat limits comfortable outdoor activity to early mornings from June through September.
San Diego's outdoor options help explain the price tag. Torrey Pines State Reserve has coastal bluff hiking with ocean views you won't find in most US cities. Mission Bay and Pacific Beach put water sports minutes from most zip codes.
Anza-Borrego Desert State Park is a two-hour drive east. Balboa Park's 1,200 acres of trails and gardens serve as the city's backyard, and the year-round comfortable temperatures mean you'll actually use them.
Bottom line: which city is right for you?
Based on the head-to-head data above, here's the short version — pick the city that lines up with what you actually care about.
Choose Bakersfield if you prioritize…
- a lower cost of living (cheaper groceries, services, and day-to-day expenses).
- more affordable housing relative to San Diego.
Choose San Diego if you prioritize…
- lower crime — a safer place to live, work, and raise a family.
- a more racially diverse community (lower HHI on Census data).
- a higher overall SnackAbility quality-of-life score.
Methodology: winners are picked from public data — U.S. Census Bureau ACS (income, home value, rent, race/HHI), FBI Uniform Crime Reporting (crime rates per 100k), and HomeSnacks' proprietary SnackAbility quality-of-life score, which blends Bureau of Labor Statistics data with the above.
More about California

Best Places To Live In California
Photo: Public domain
Cheapest Places To Live In California
Photo: Public domain
Most Dangerous Cities In California
Photo: Public domain
Best Places To Raise A Family In California
Photo: Public domain
Best Places To Retire In California
Photo: Public domain
Richest Cities In California
Photo: Public domain
Safest Places In California
Photo: Public domain
Worst Places To Live In California
Photo: Public domain